The Observation Table

We made it to the end of yet another week. Before the weekend begins for most of my audience—though for my UK readers, enjoy the extended bank holiday and God save the Queen—I wanted to take a look at a graphic from xkcd that shows one can use different types of scopes to make different types of observations.

All the scopes.

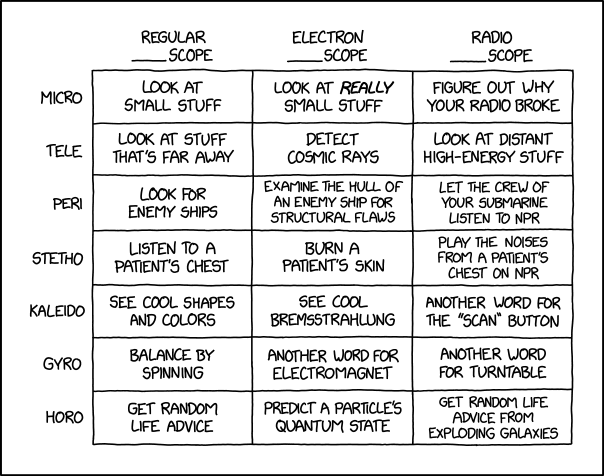
I’m constantly thinking about getting a record player. But if I do, maybe I’ll just start calling it my radiogyroscope.

Credit for the piece goes to Randall Munroe.

Author: Brendan Barry

I am a graphic designer who focuses on information design. My day job? Well, they asked me not to say. But to be clear, this blog is my something I do on my own time and does not represent the views of…my employers. I think what I can say is that given my interest in information design—be it in the shape of clear charts, maps, diagrams, or wayfinding systems—I am fortunate that my day job focuses on data visualisation. Outside of work, I try to stay busy with personal design work. Away from the world of design, I have become an amateur genealogist and family historian. You will sometimes see that area of work bleed into my posts.