Editor’s note: I was having some technical issues last week. This was supposed to post last week.
Editor’s note two: This was supposed to go up on Monday. Still didn’t. Third time’s the charm?
Yesterday I wrote about a piece from the New York Times that arrived on my doorstep Saturday morning. Well a few mornings earlier I opened the door and found this front page: a map of the western United States highlighting the state of New Mexico.
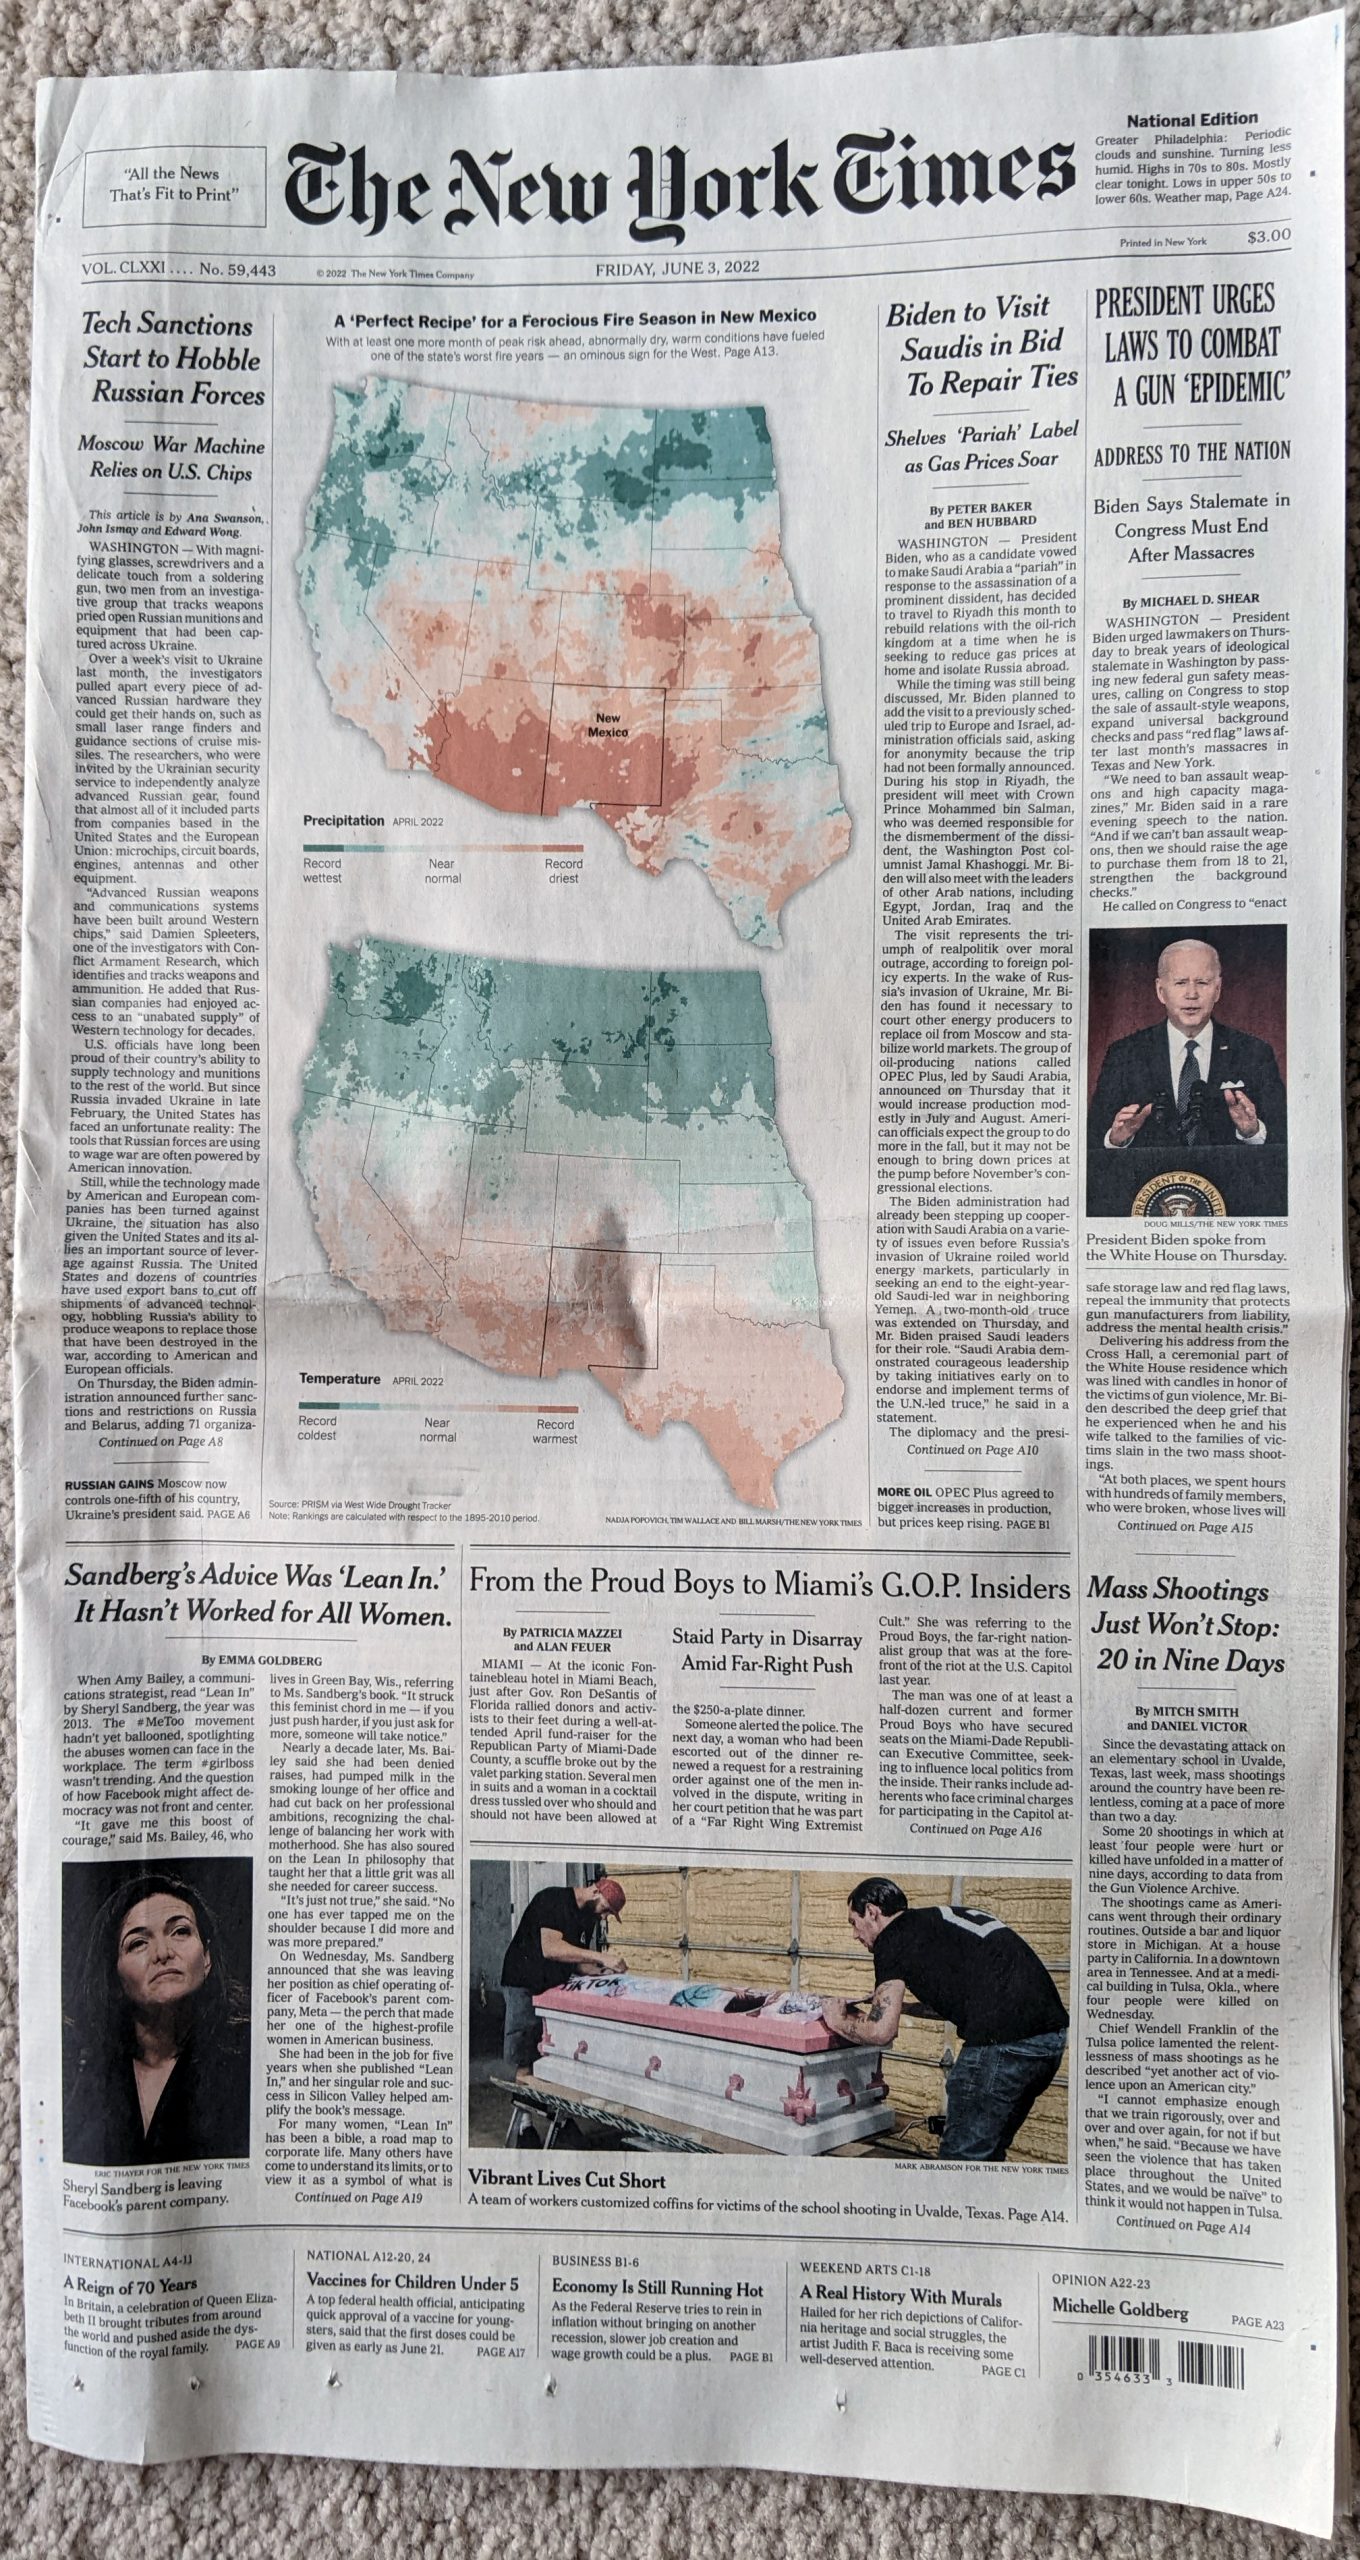
Unlike the graphic we looked at yesterday, this graphic stretched down the page and below the fold, not by much, but still notably. The maps are good and the green–red spectrum passes the colour blind test. How the designer chose to highlight New Mexico is subtle, but well done. As the temperature and precipitation push towards the extreme, the colours intensify and call attention to those areas.
Also unlike the graphic we looked at yesterday, this piece contained some additional graphics on the inside pages.
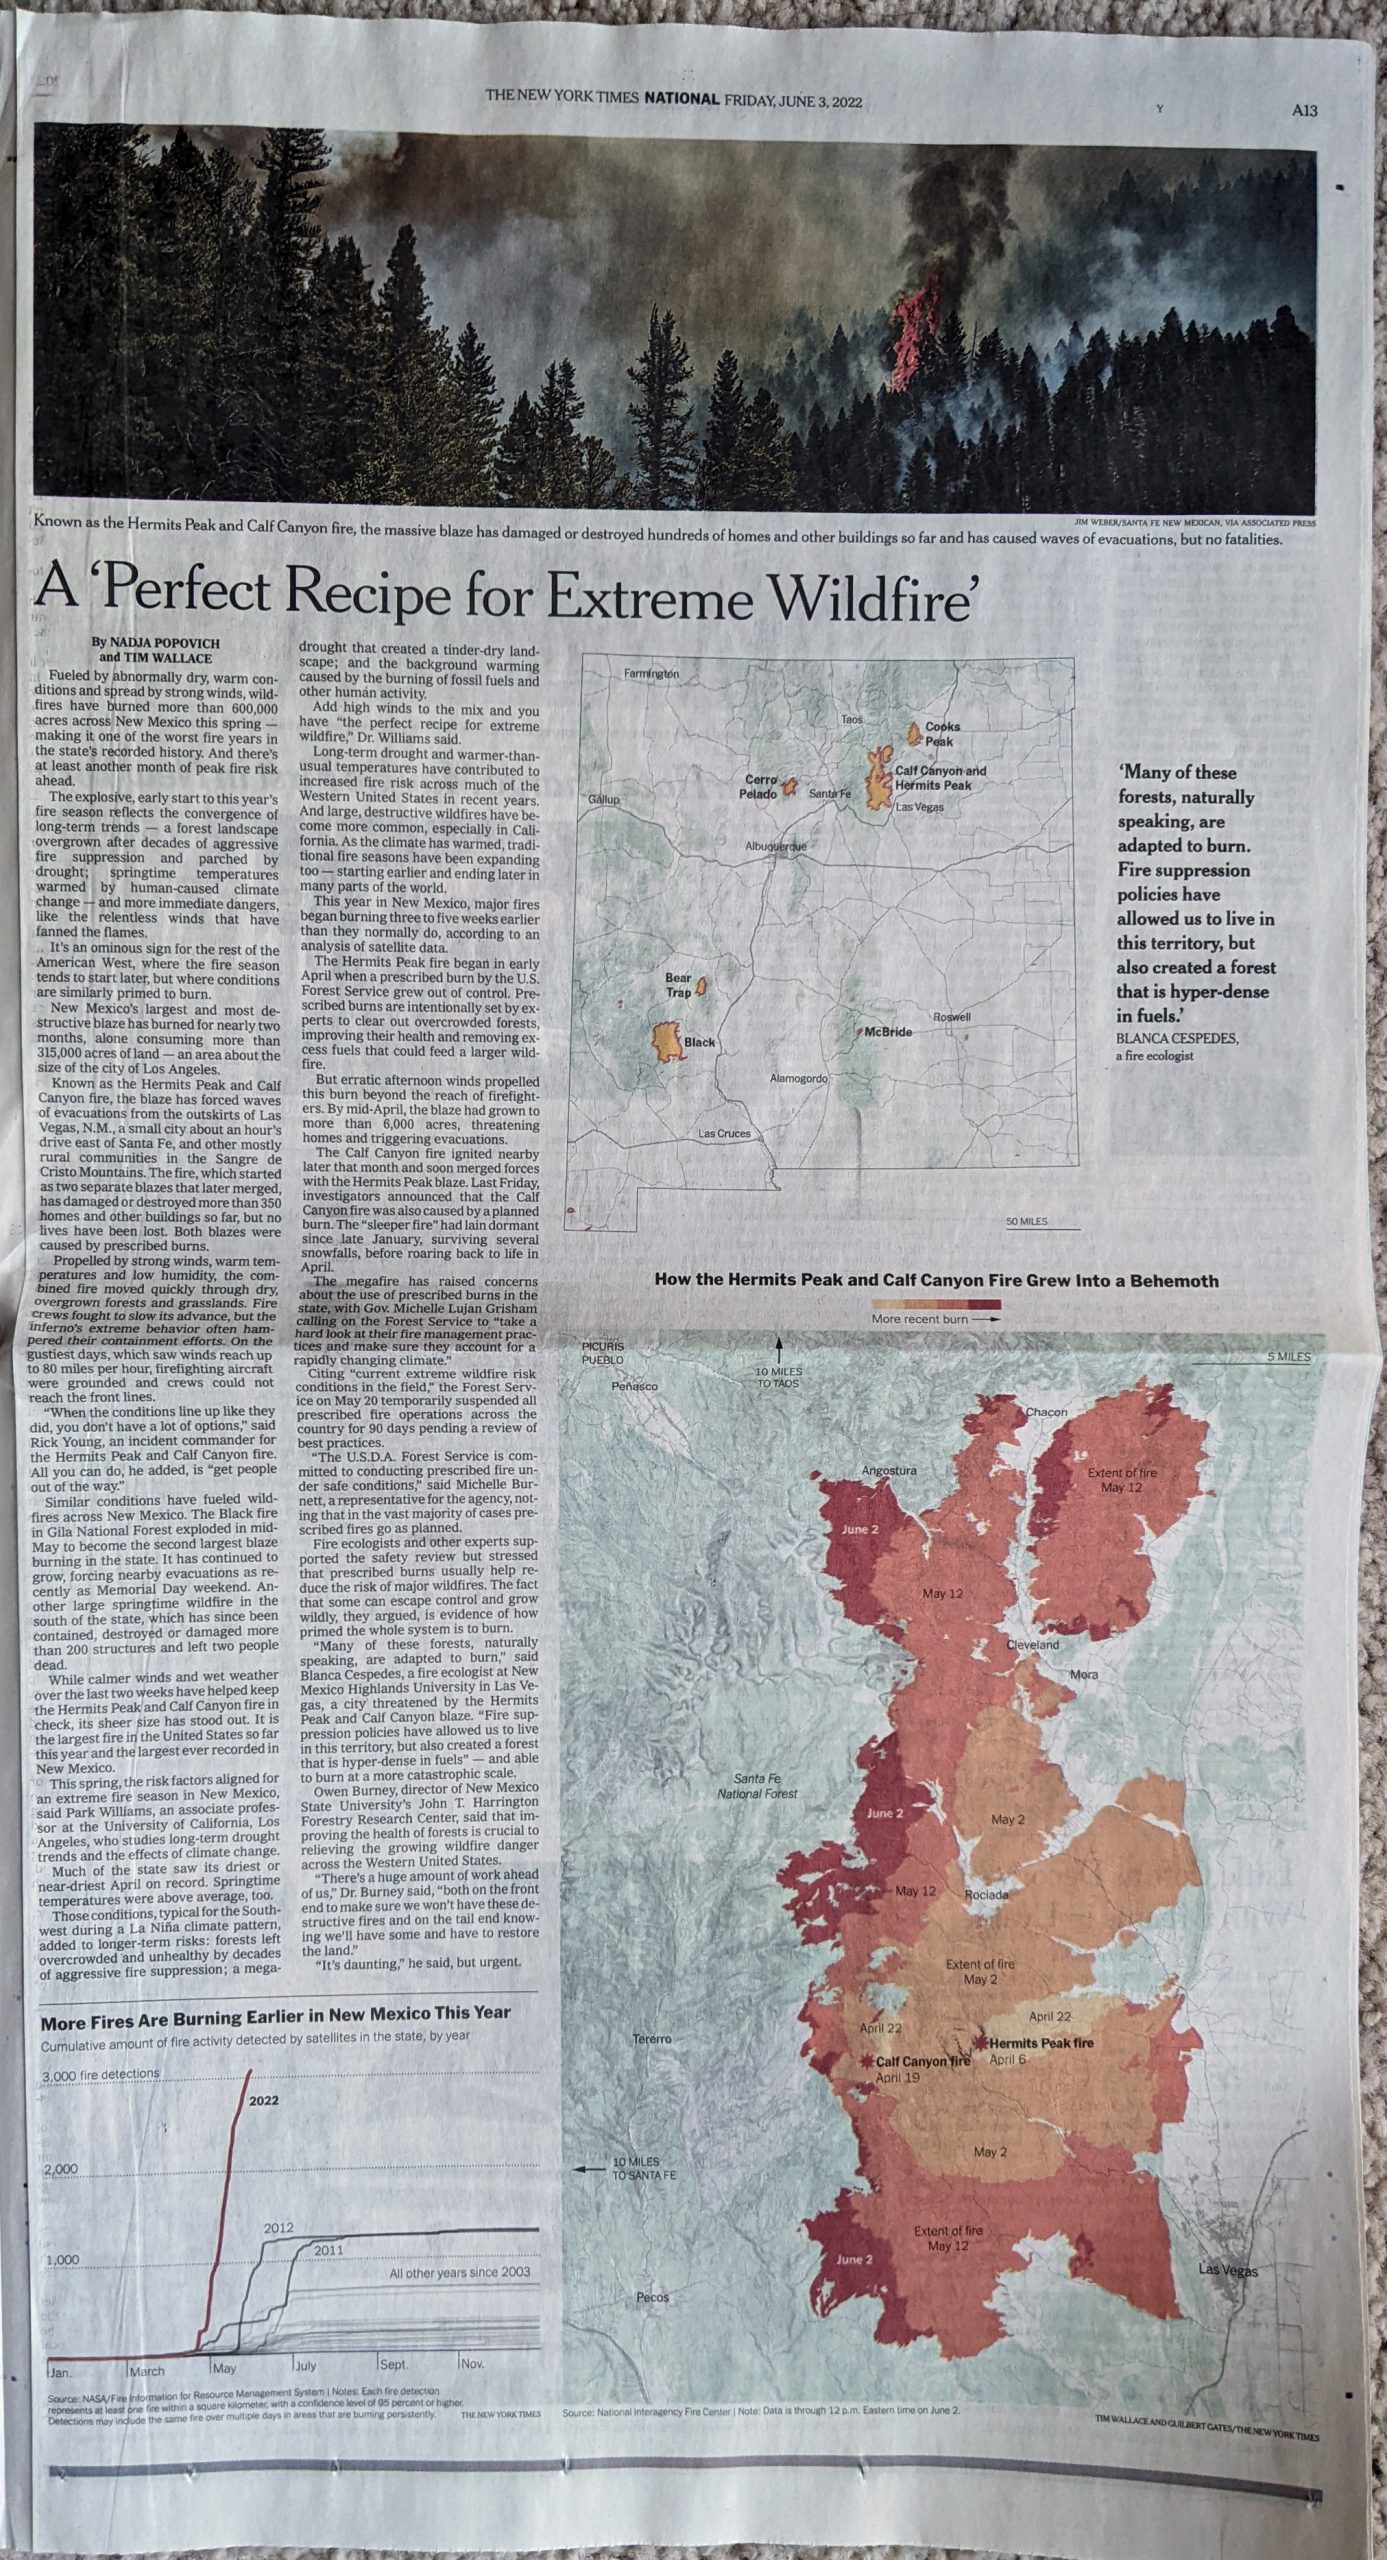
These are also nicely done. Starting with the line chart at the bottom of the page, we can contrast this to some of the charts we looked at yesterday.
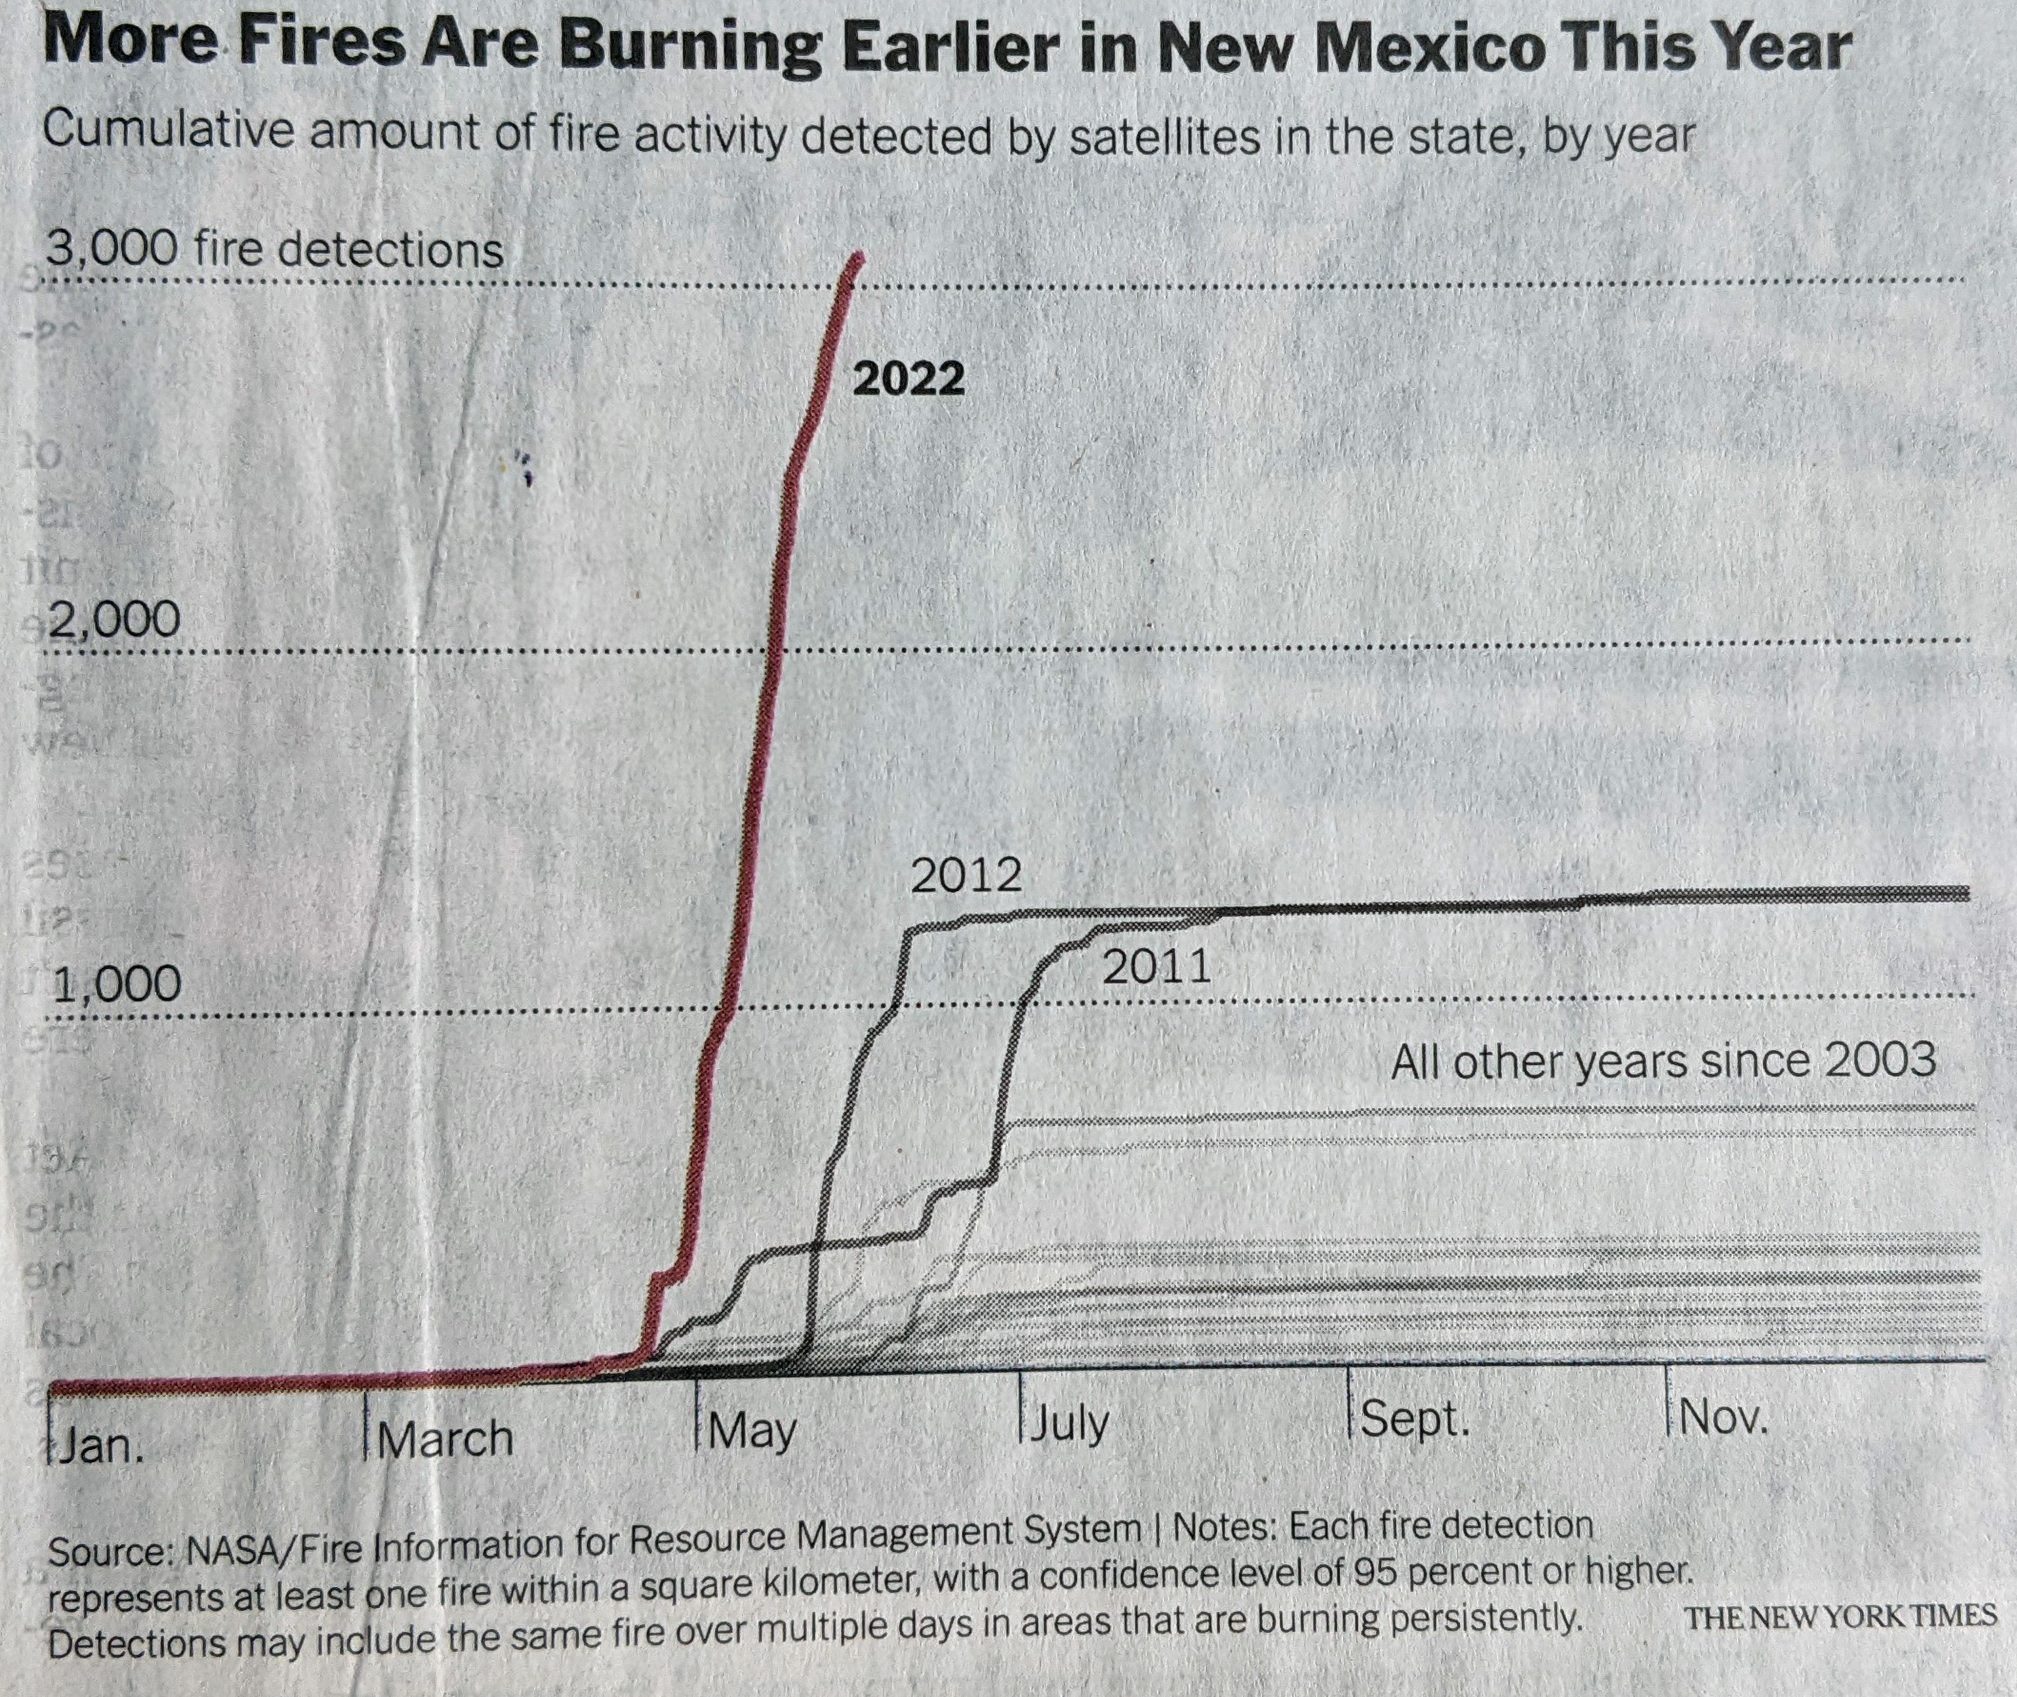
Here the designer used axis lines and scales to clearly indicate the scale of New Mexico’s wildfire problem. Not only can you see that the number of fires detected has spiked far above than the number in the previous years back to 2003. And not only is the number greater, the speed at which they’ve occurred is noticeably faster than most years. The designer also chose to highlight the year in question and then add secondary importance to two other bad years, 2011 and 2012.
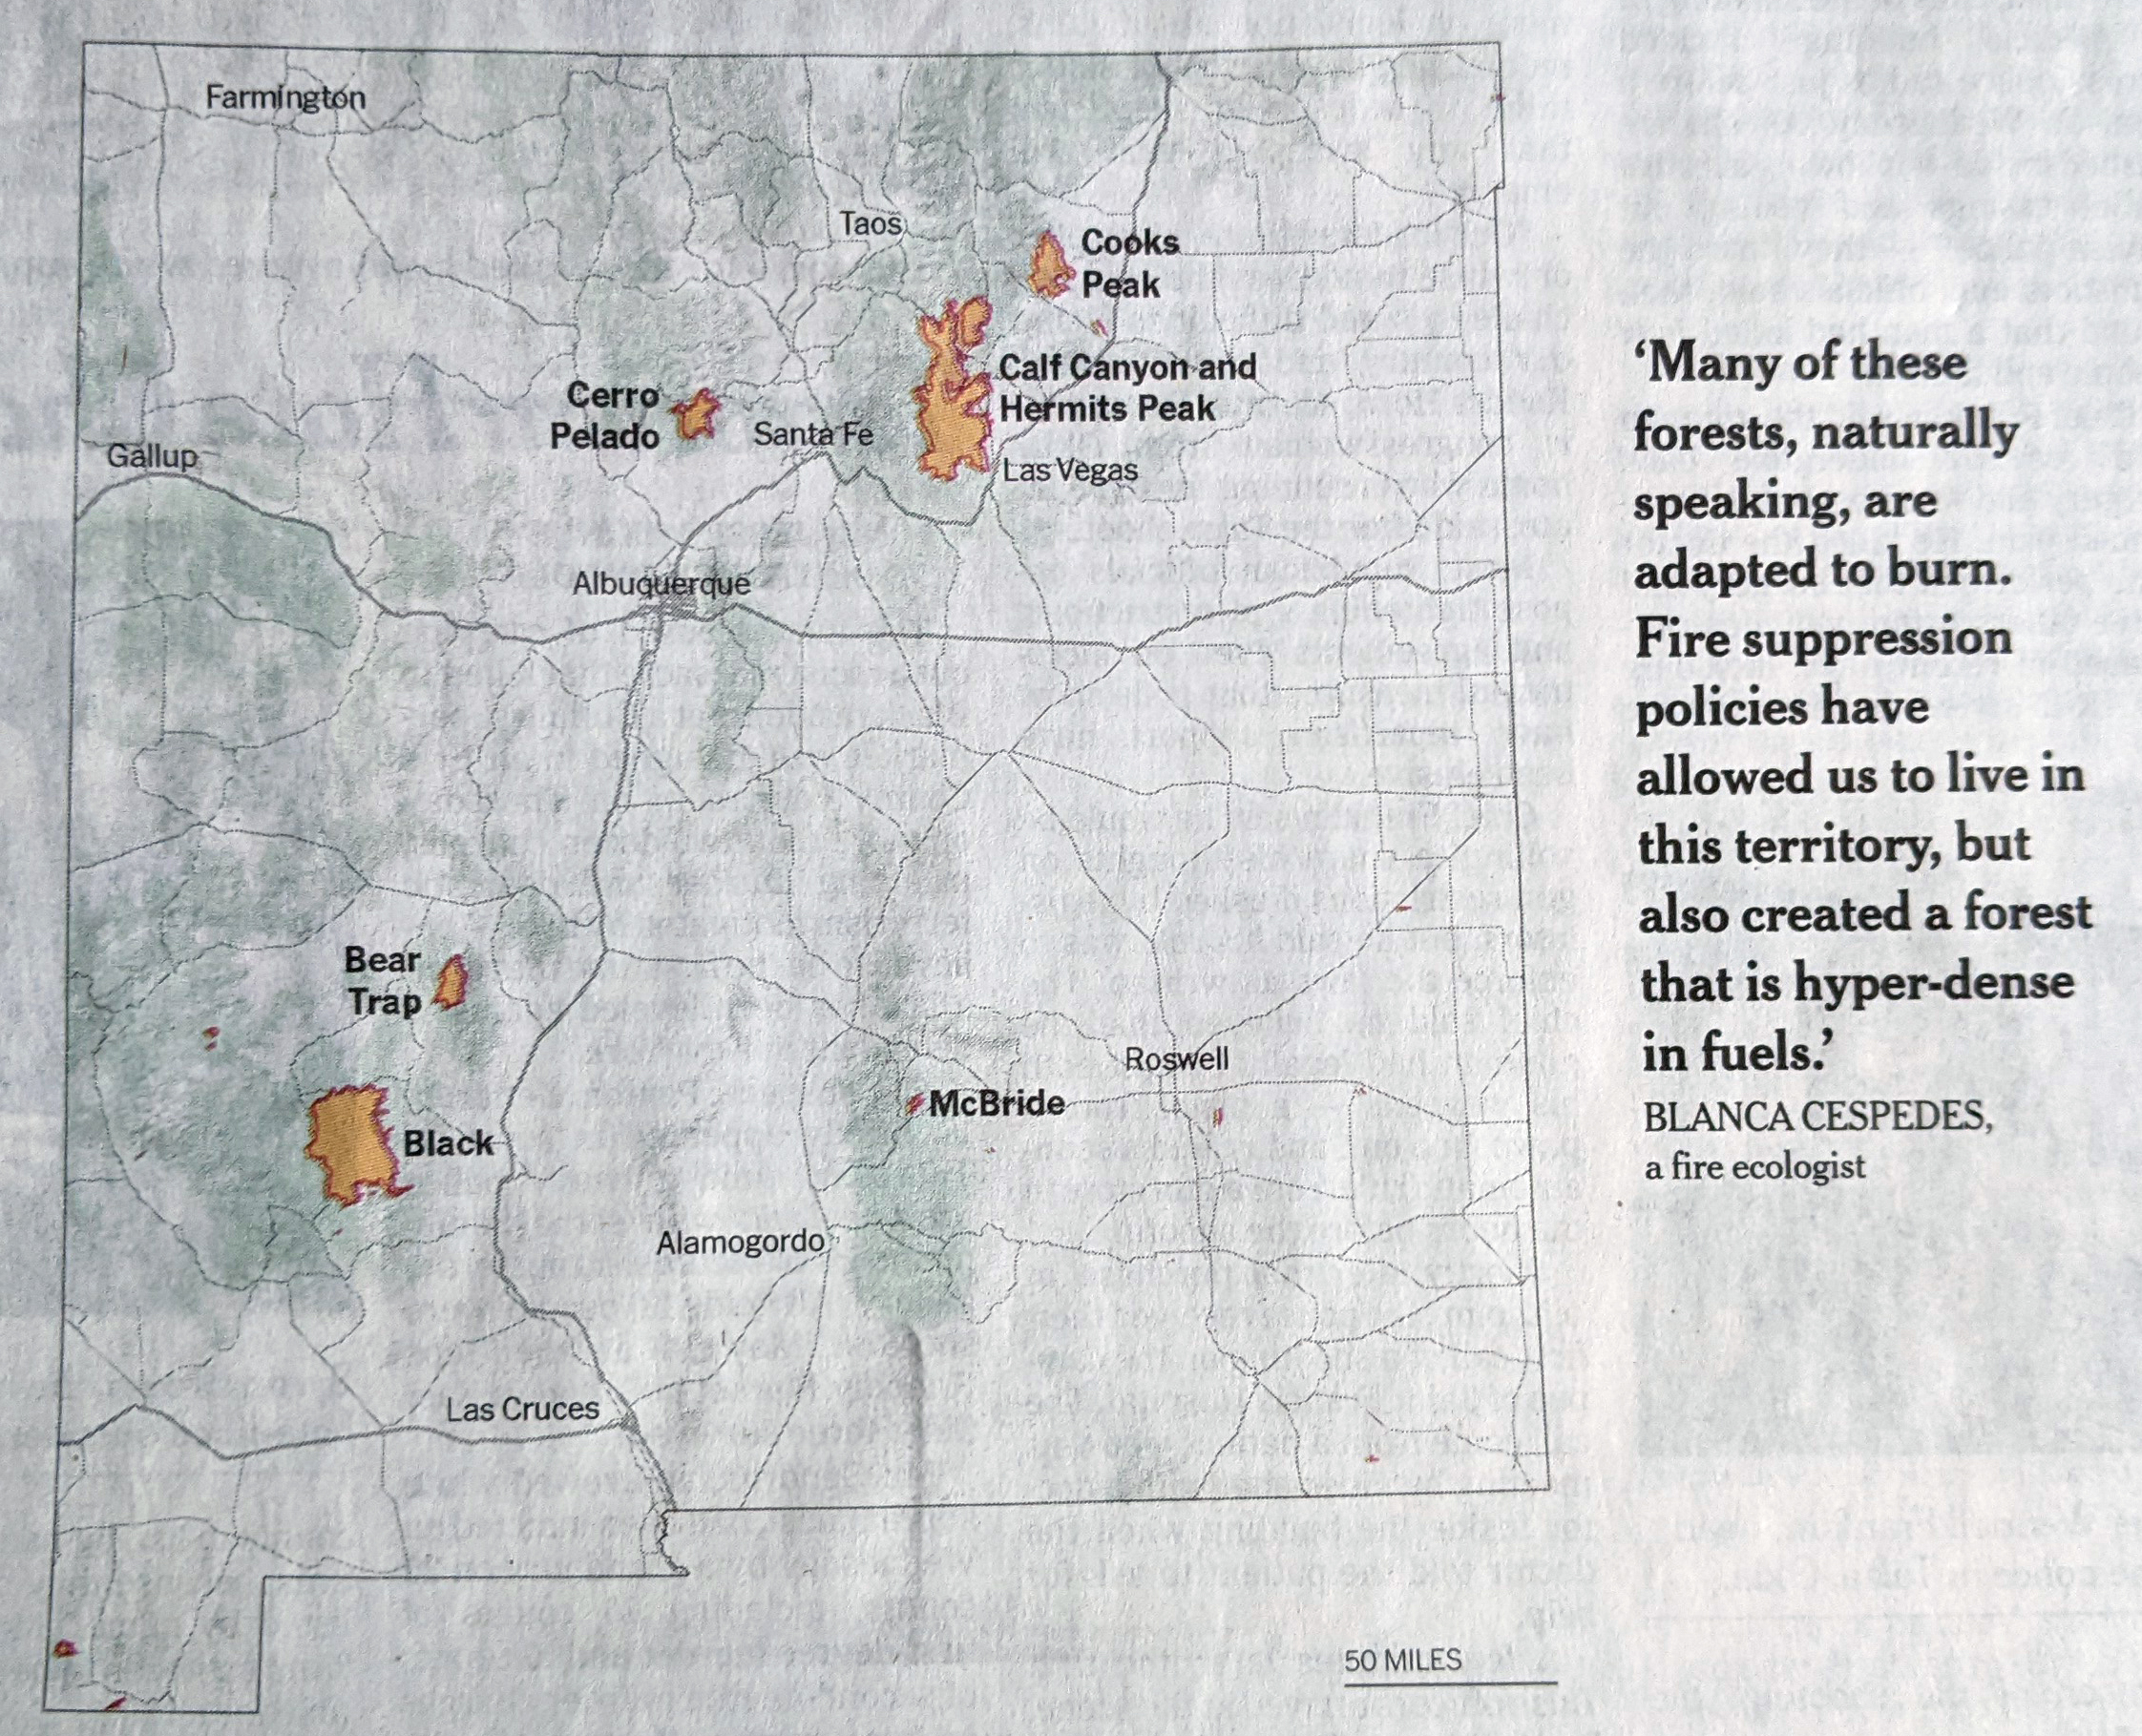
The other graphics are also maps like on the front page. The first was a locator map that pointed out where the fires in question occurred. Including one isn’t much of a surprise, but what this does really nicely is show the scale of these fires. They are not an insignificant amount of area in the state.
Finally we have the main graphic of the piece, which is a map of the spread of the Calf Canyon and Hermits Peak fire, which was two separate fires until they merged into one. The article does a good job explaining how part of the fire was actually intentionally set as part of a controlled burn. It just became a bit uncontrolled shortly thereafter.
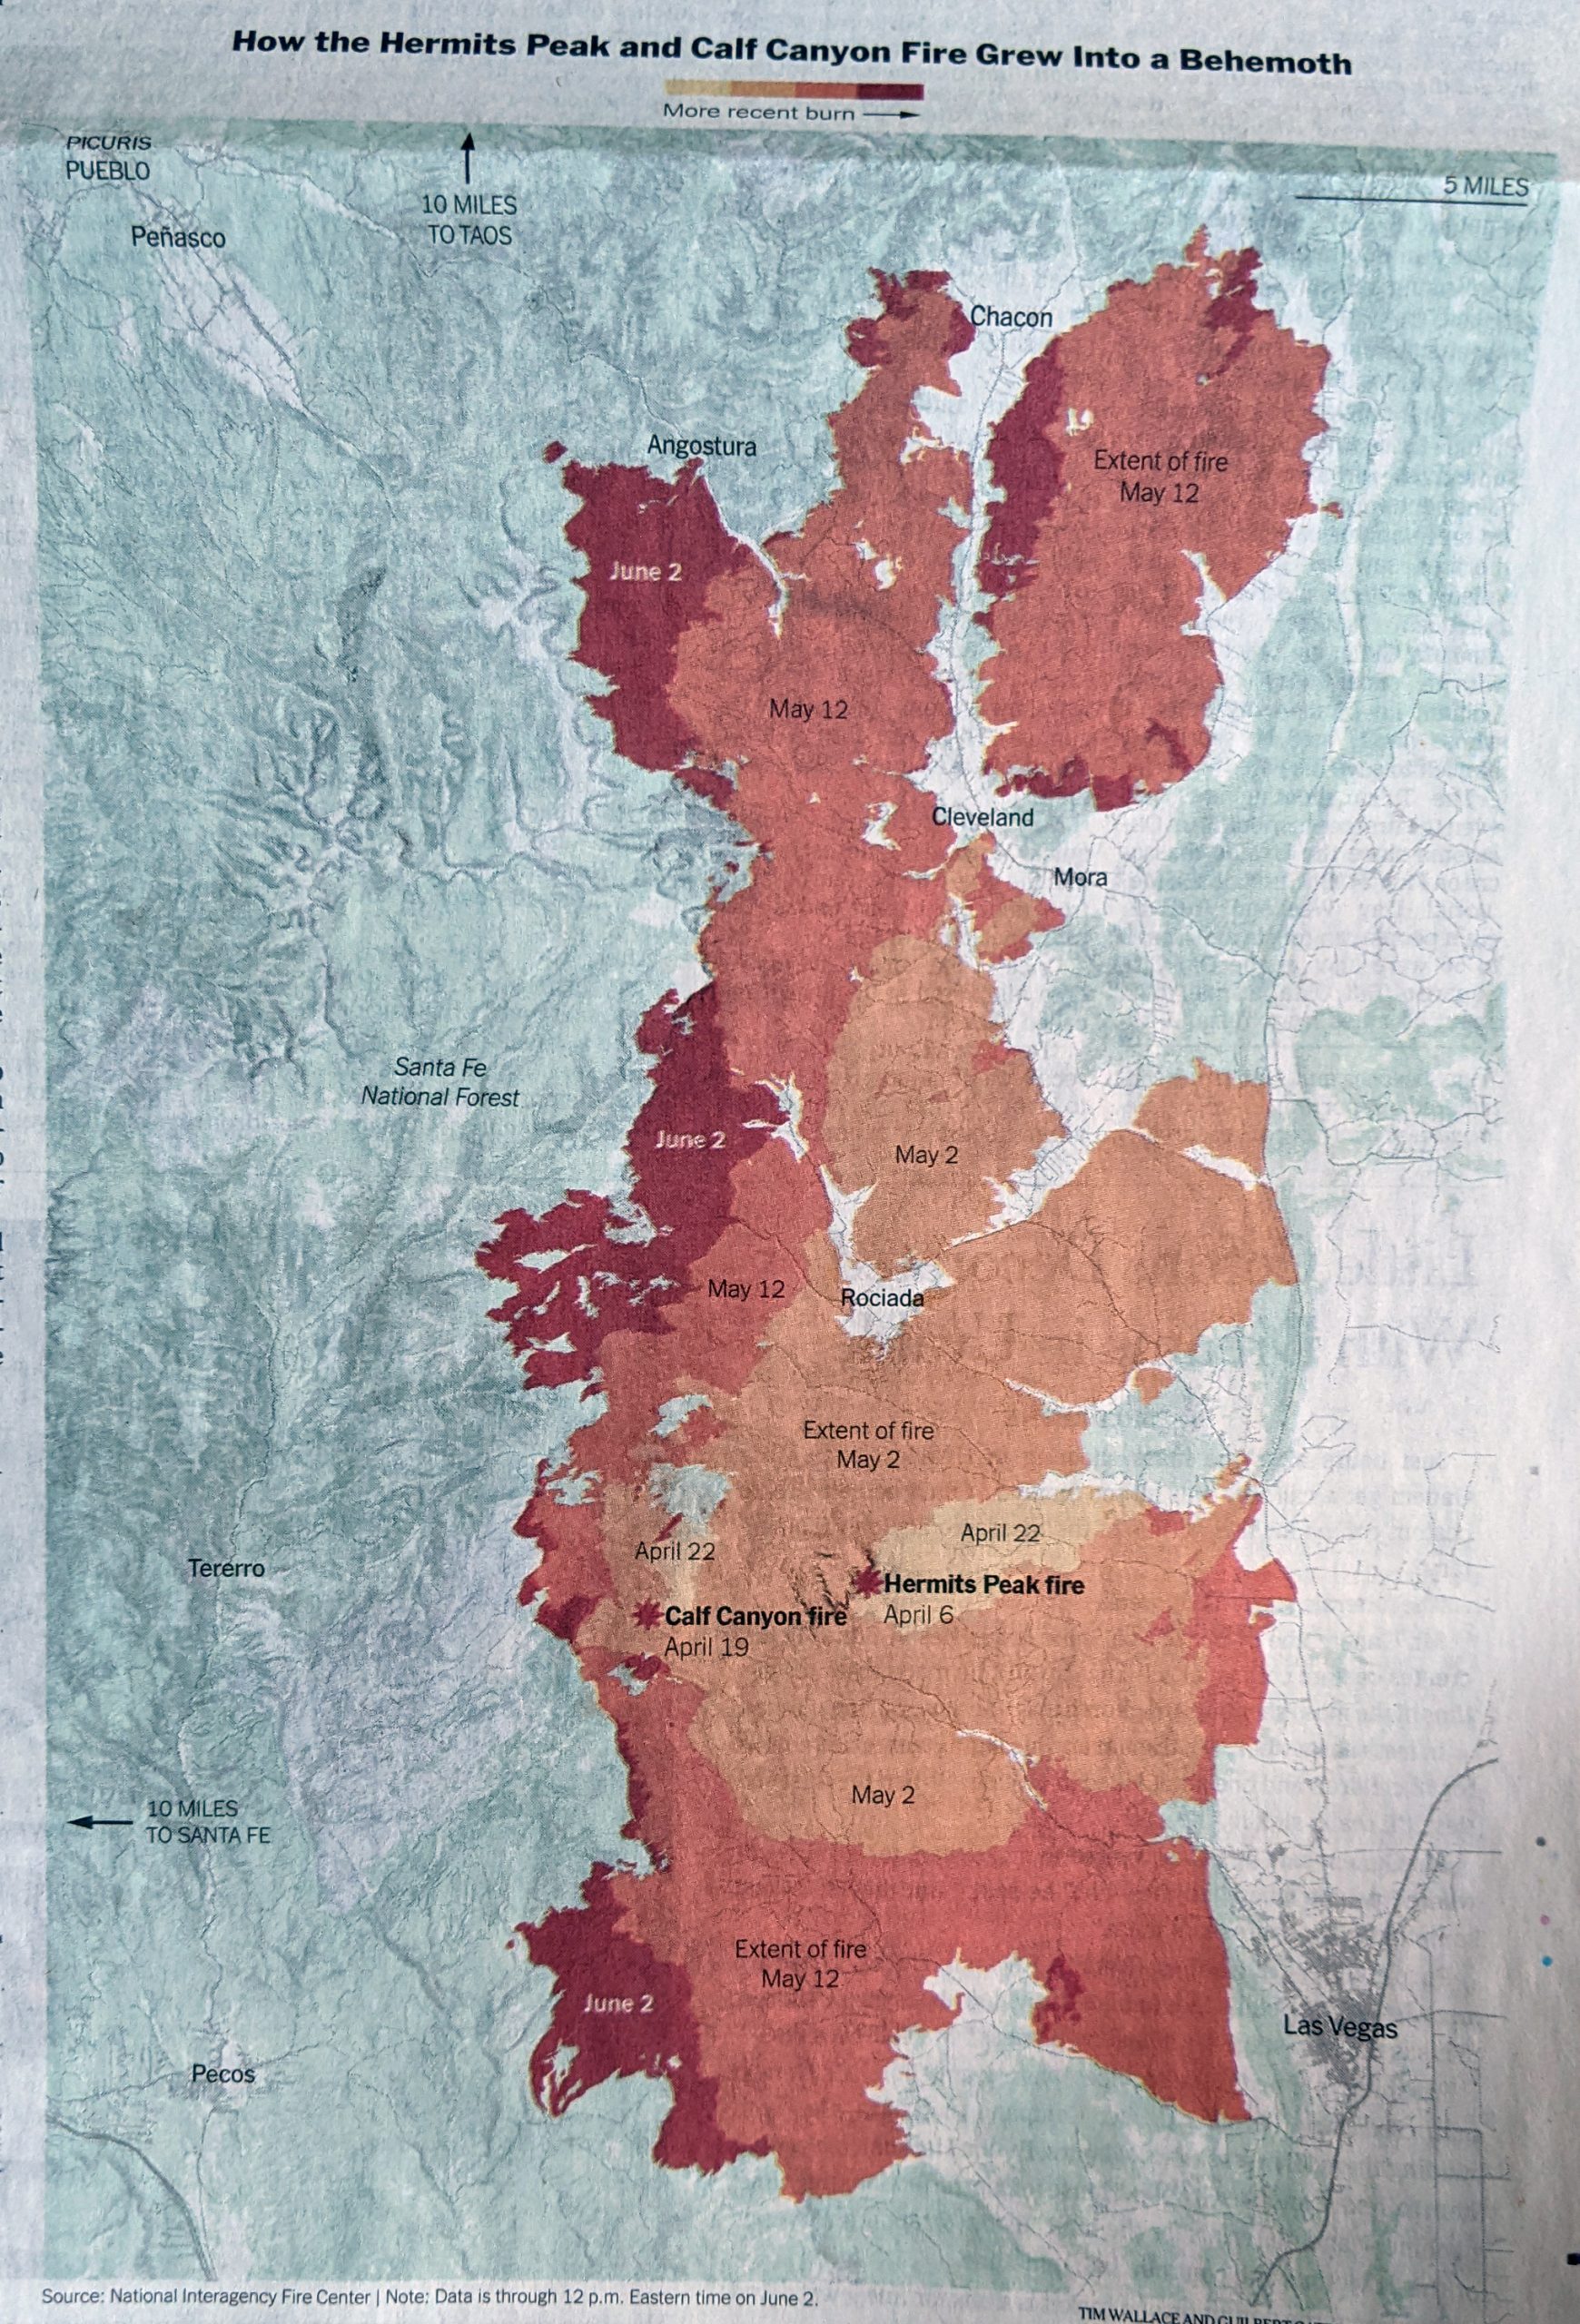
This reminded me of a piece I wrote about last autumn when the volcano erupted on La Palma. In that I looked at an article from the BBC covering the spread of the lava as it headed towards the coast. In that case darker colours indicated the earlier time periods. Here the Times reversed that and used the darker reds to indicate more recent fire activity.
Overall the article does a really nice job showing just what kind of problems New Mexico faces not just now from today’s environmental conditions, but also in the future from the effects of climate change.
Credit for the piece goes to Guilbert Gates, Nadja Popovich, and Tim Wallace.
