I took two weeks off as work was pretty crazy, but we’re back to covering data visualisation and design with a graphic about trains. And anybody who knows me knows how I love trains. One of the early acts of the Biden administration was funding a proper expansion of rail service in the United States.
Last week the Washington Post published an article that explored some of the difficulties Amtrak, the national rail company, faces in that expansion. Most of it has to deal with the fact that outside the Northeast Amtrak largely uses rail lines owned by freight companies.
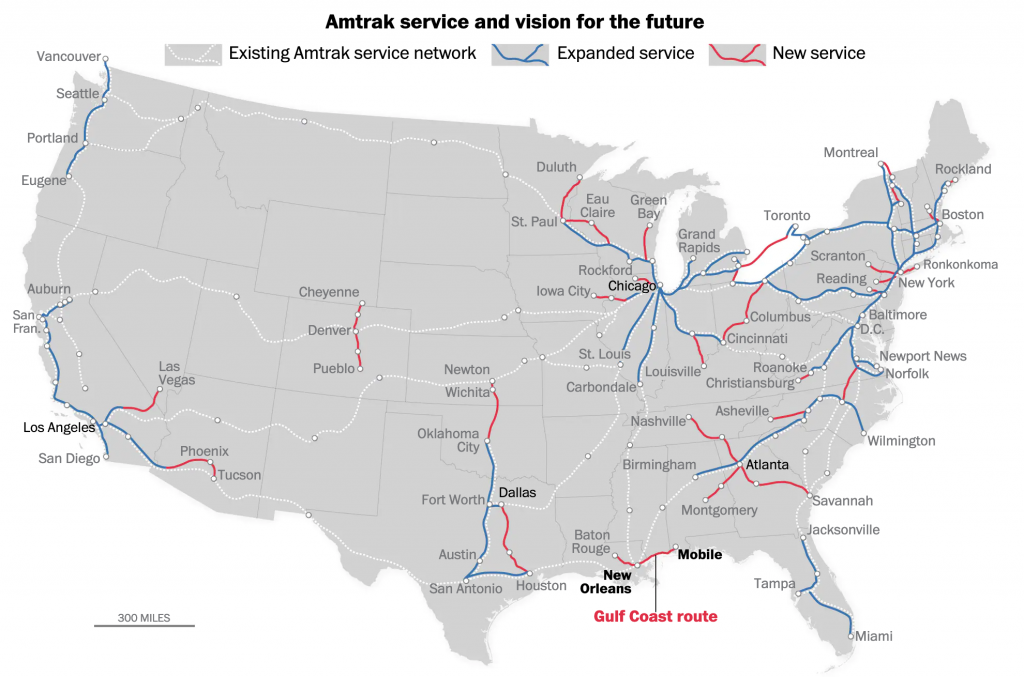
The article uses a map to show Amtrak routes and, in particular, where Amtrak wants to increase service or create new service.

As far as the map goes, it does a nice job needing not to reinvent the wheel. When an existing route will have expanded service, e.g. the Northeast Corridor, the blue line sits next to the dotted white line. What remains a bit unclear to me is the use of black text for Chicago, Atlanta, Dallas, and Los Angeles. The bold type for New Orleans and Mobile makes sense because of the story’s focus on that particular route. Chicago is mentioned once, but Dallas is not. So that is unclear.
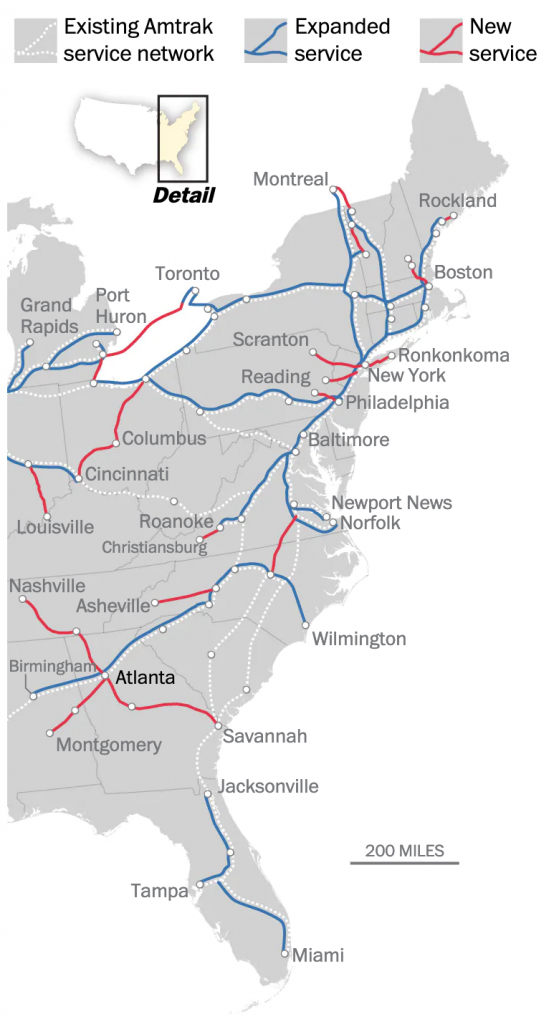
But what really stood out to me was what happened when I re-read the story on my mobile. The graphic split from a full map to three narrow graphics, each featuring 1/3 of the United States. The designers moved the text labels so that they are fully visible in each graphic.

Overall, the piece does a great job at showing the map, but in particular it shines when it swaps out the large map for the smaller graphics on small screens. And the attention to detail in moving the text labels makes it all the better.
Credit for the piece goes to Luz Lazo.
