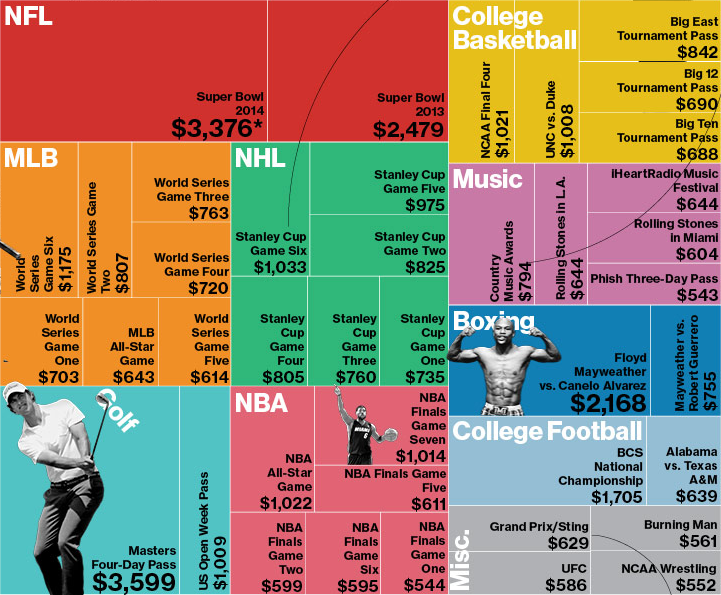
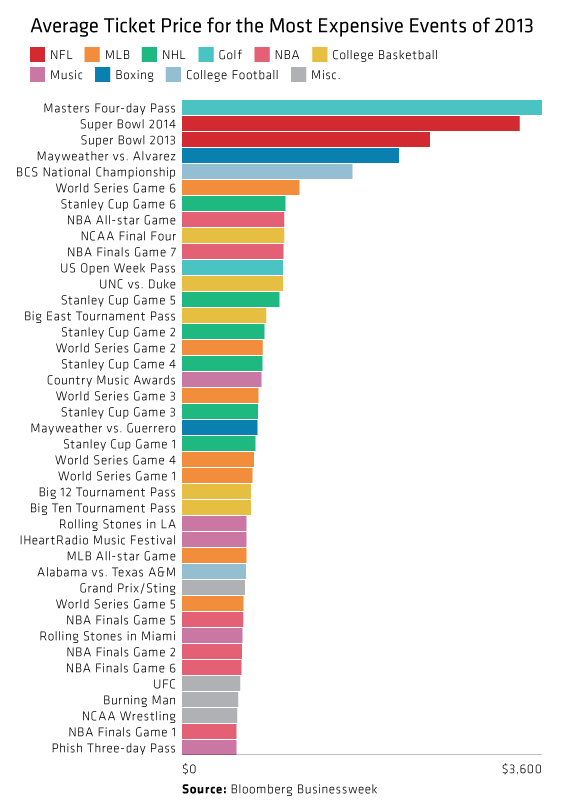
So yeah, the Super Bowl thing. Apparently tickets are expensive? Earlier, Bloomberg Businessweek took a look at average prices for the most expensive events of 2013. The only sentence supporting the graphic was that the most expensive event was not the Super Bowl. Okay, so what was?

I think this graphic actually makes it more difficult to tell. But beyond that, the decision to use the tree map confuses me. We are already looking at a subset of ticket prices—not all, but only the “most expensive”. What criteria determined that selection? After all, from my own experience and personal knowledge I know that Red Sox–Yankees game are also incredibly expensive. But those are not present in this set. And then if the idea is to undermine the common thought that the Super Bowl is the most expensive ticket, should the user be forced to find through each square—and no, the events are not squarified very nicely—the highest value?
So I took an hour before the game to try a quick stab at quickly identifying the most expensive tickets. It turns out that the glorious bar chart more than suffices. It also then shows how quickly the remainder of the prices become quite comparable. (Ridiculous I suppose depends upon your preference for sport/event/disposable income.)

Credit for the original piece goes to Bloomberg Businessweek.

