Census data fascinates me from a data visualisation perspective; one can look at it so many different ways. Last week I looked at some of the Slovakian census data on the Carpatho-Rusyns that live in the northeastern mountains of Slovakia. But yesterday, the British Office of National Statistics released the results from their census of England and Wales (Scotland reports later and Northern Ireland did so already, yay devolution.) One of the big news stories was that England and Wales had 500,000 more people than had been expected. That doesn’t sound like a lot of people, but to put it roughly into American proportions, that would be like finding that there was a whole new city the size of Chicago somewhere in the United States.
But while many organisations and individuals will certainly be looking at the census data in the coming days, weeks, and months, the ONS released its own interactive application. Basically it looks at the population pyramid for England and Wales from 1911 to 2011, a century’s worth of data. But what makes this different from the GE population pyramids, for example, is the context that the ONS has added that strict data pulls lack.

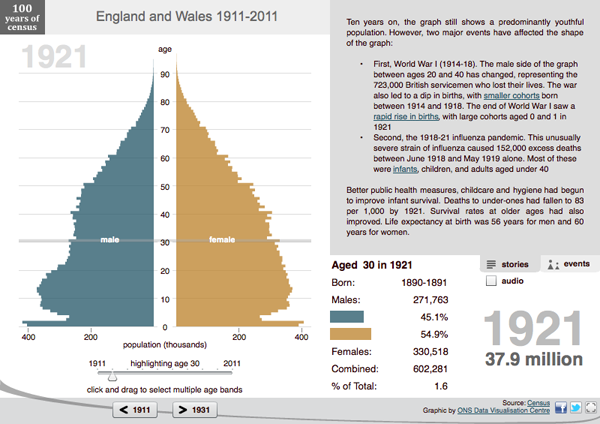
Here in 1921, rolling over a particular cohort reveals the details of those aged 30 in 1921. There is a clear difference between the number of men and women. But why? The text block’s first note details how 700,000 men aged 20–40 died during World War I and thus altered the basic structure of the English and Welsh population.

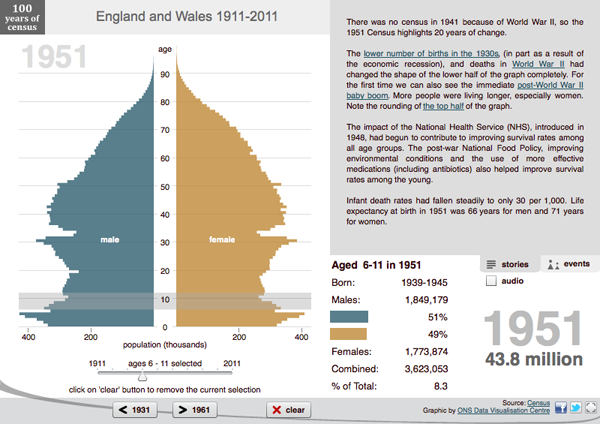
And in 1951 we begin to look at the British baby boom in the post-war era. Again, while the Baby Boom might be expected, the ONS also points out that the NHS, the British National Health Service, had also recently started and was positively affecting life expectancy and the general health of the British public. These are again things that would not likely appear in more data-focused pieces.
But everybody loves to compare things to other things. So, the ONS also released a more data-focused application that allows the user to select two different census geographies and compare them. This is more as one would expect, comparing overlays vs. side-by-side looks at different population pyramids. The example below compares London to Birmingham.
Credit for the pieces go to the ONS Visualisation Centre.
