Wildfires continue to burn across in California. One, the Camp Fire in northern California near Chico, has already claimed 77 lives. But why has this fire been so deadly?
FiveThirtyEight explained some of the causes in an article that features a number of charts and graphics. The screenshot below features a scatter plot looking at the temperature and precipitation recorded from winter through autumn every year since 1895.
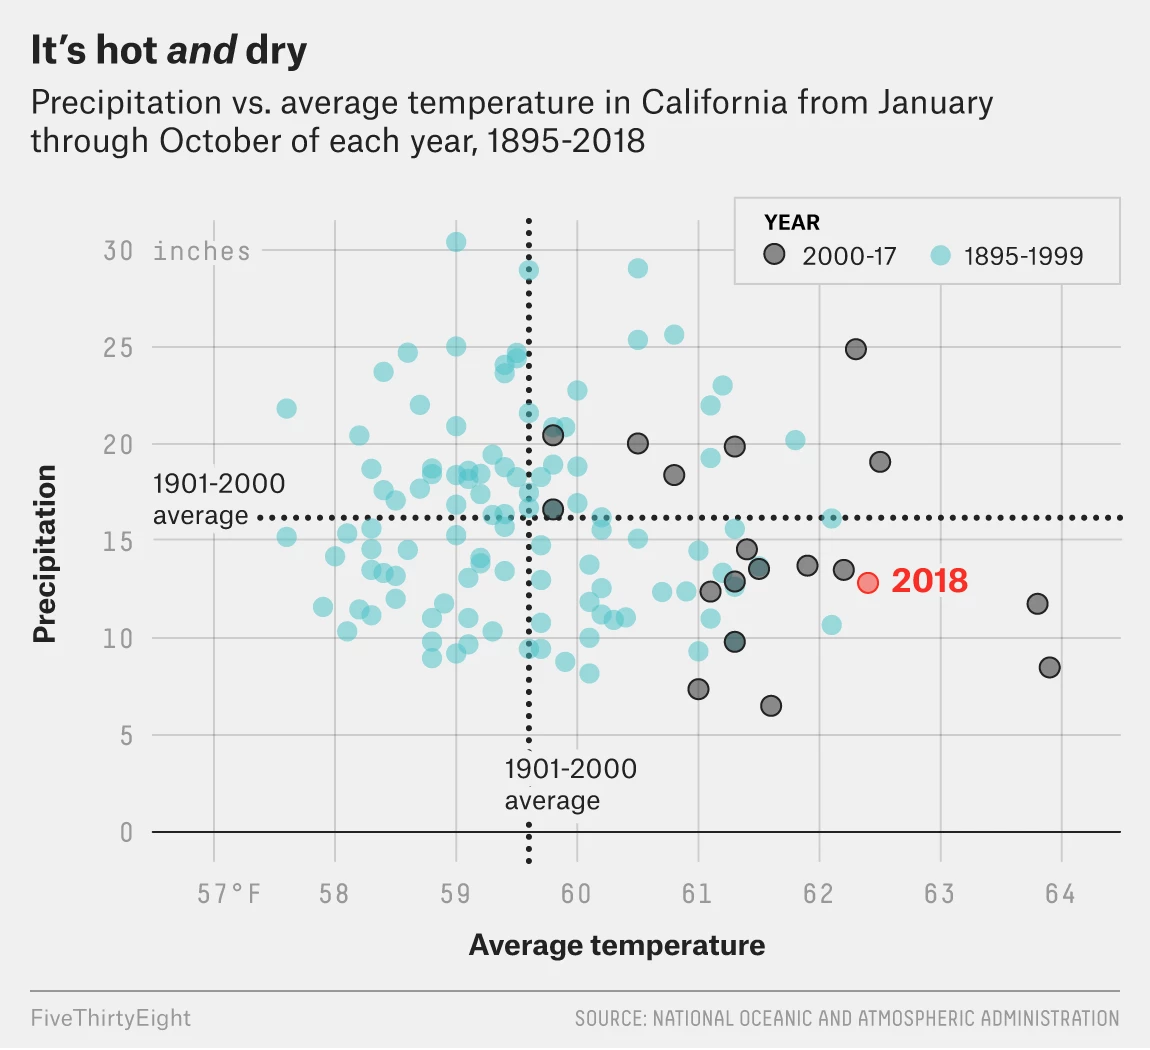
The designers did a good job of highlighting the most recent data, separating out 2000 through 2017 with the 2018 data highlighted in a third separate colour. But the really nice part of the chart is the benchmarking done to call out the historic average. Those dotted lines show how over the last nearly two decades, California’s climate has warmed. However, precipitation amounts vary. (Although they have more often tended to be below the long-term average.)
I may have included some annotation in the four quadrants to indicate things like “hotter and drier” or “cooler and wetter”, but I am not convinced they are necessary here. With more esoteric variables on the x- and y-axis they would more likely be helpful than not.
The rest of the piece makes use of a standard fare line chart and then a few maps. Overall, a solid piece to start the week.
Credit for the piece goes to Christie Aschwanden, Anna Maria Barry-Jester, Maggie Koerth-Baker and Ella Koeze.
Leave a Reply
You must be logged in to post a comment.