Last week I wrote about how new cases had maybe flattened a wee bit in their rapid drop from peaks earlier this year. But the good news is that even in where new cases declines may have slowed down, they continue to decline.
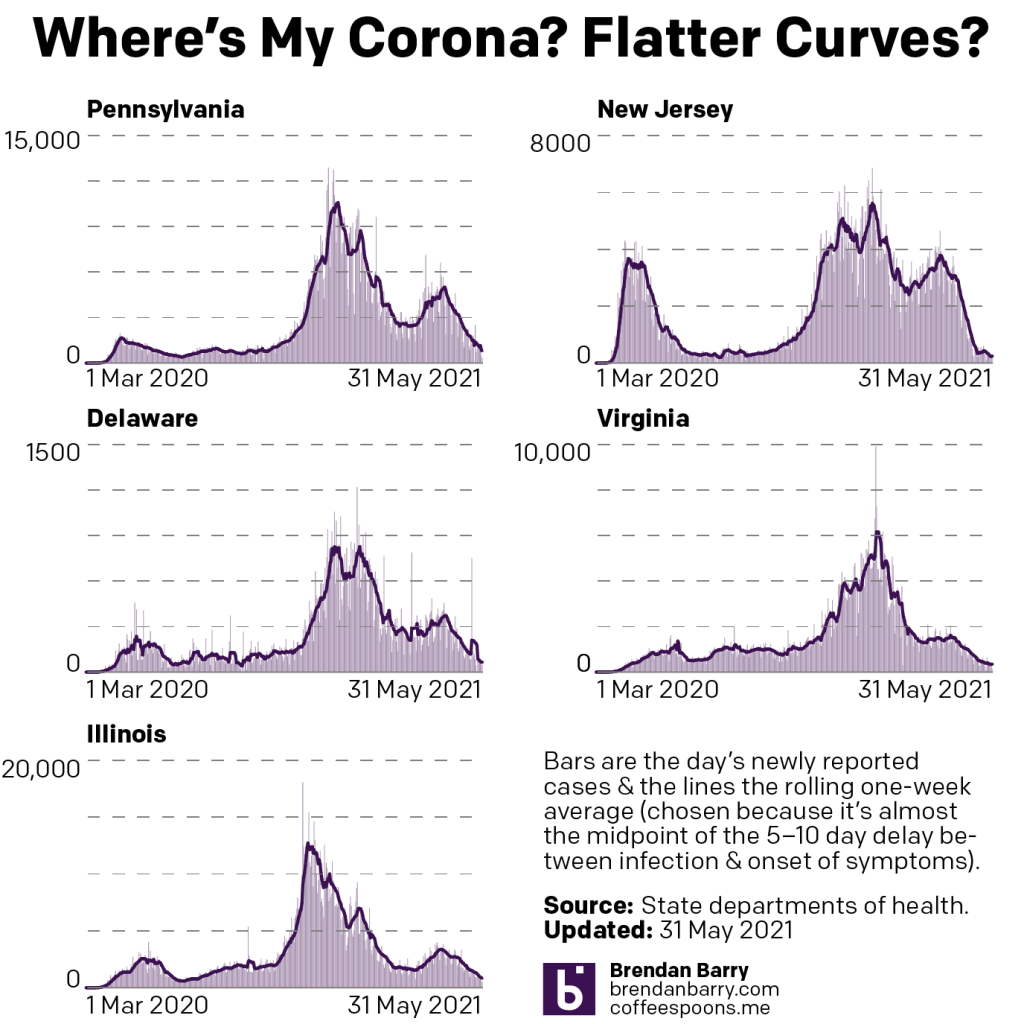
We can see the tails at the right ends are all back to declining shapes. Delaware is perhaps the most deceptive, because remember that there was the anomalous spike from late processing of earlier new cases.
I had noted that deaths had finally seen some data showing them dropping. That has held true to some degree.
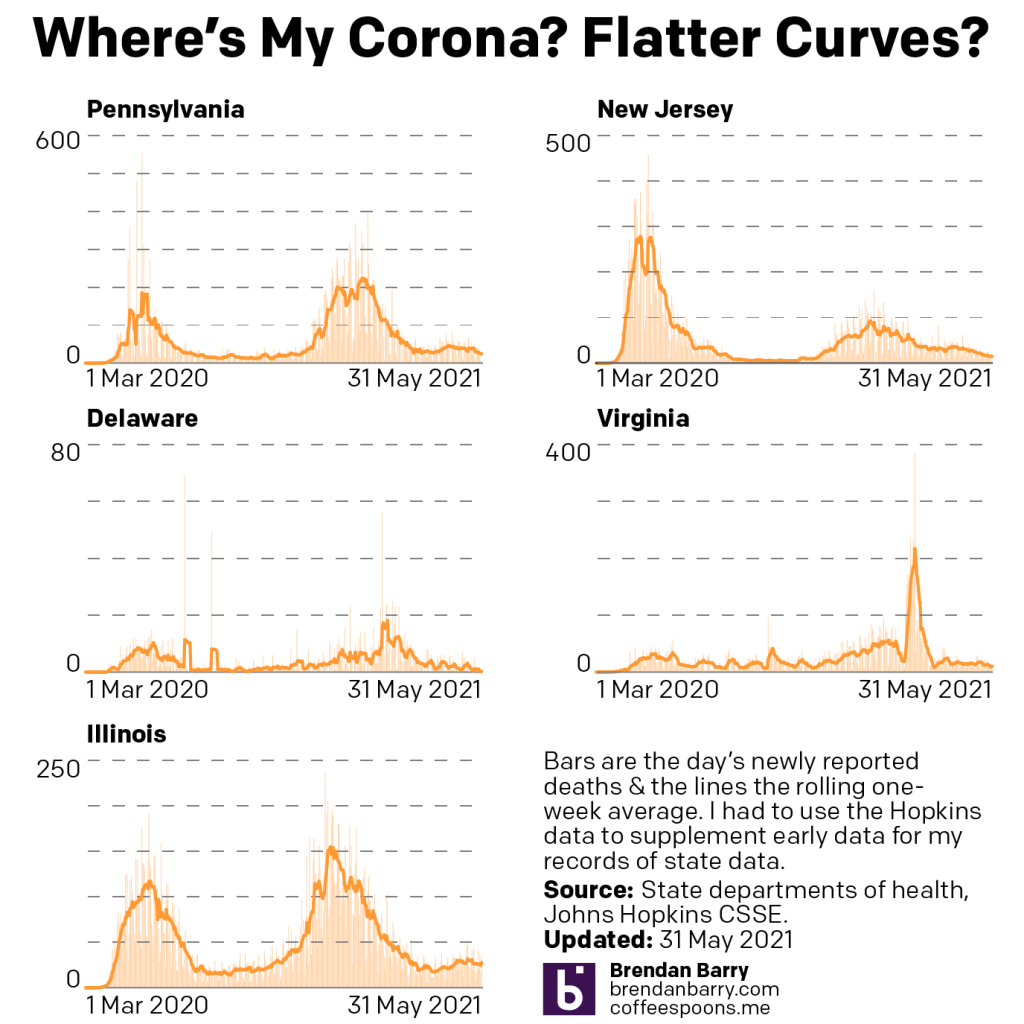
Indeed, the tails at the end of each state have shown slow declines. Delaware is even near 0 deaths per day. Illinois, however, is an exception with a small increase lately.
Finally, a brief look at vaccinations.
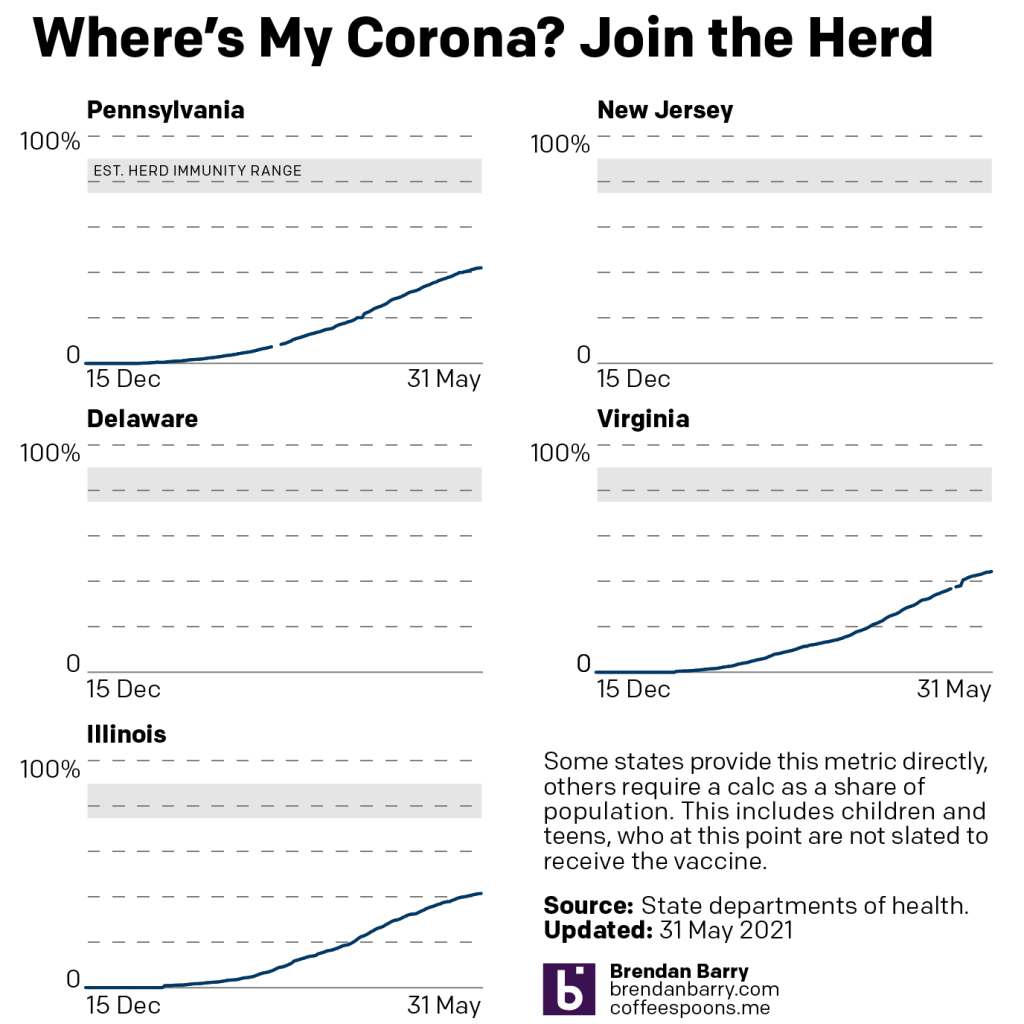
You can see that the rate of full vaccinations has begun to slow. All three states we cover are over 40%, though all are below 45%. Pennsylvania is difficult to evaluate, however, because for the last four days Philadelphia has not updated its numbers. And as the largest county by far in the state, it’s shifts can swing the overall state numbers.
Credit for the piece is mine.
Leave a Reply
You must be logged in to post a comment.