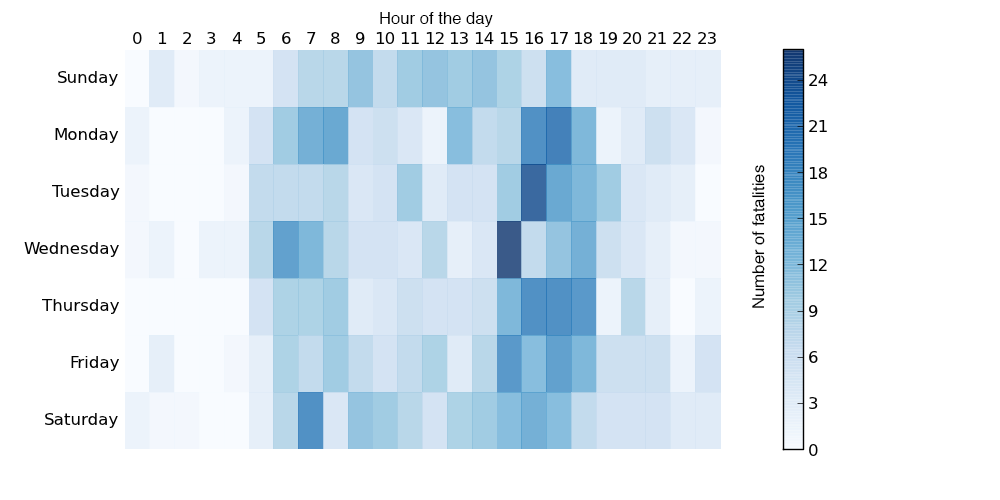
Today’s piece comes via a colleague. It is an article about hit-and-run cycling accidents in and around Los Angeles. The data visualisation in the article is not entirely complex—we are talking only about line charts and bar charts—but they support the arguments and statements in the article. And in that sense they are doing their job.

Credit for the piece goes to Armand Emamdjomeh, Laura J. Nelson, and Joseph Serna.

