Fighting Off My Jet Lag

As I mentioned earlier this week, I visited London for work for a week and then took some rollover holiday time to stay around London and then visit Dublin. But now I am back. And this week that has meant all the jet lag. And while everybody experiences jet lag and recovers from it differently, I wanted to take a look at my experience. The data and such is below. But the basic point, it is about four days before I return to normal.

What is missing, unfortunately, is the Chicago-to-London data. Because anecdotally, that was far, far worse than the return flight.
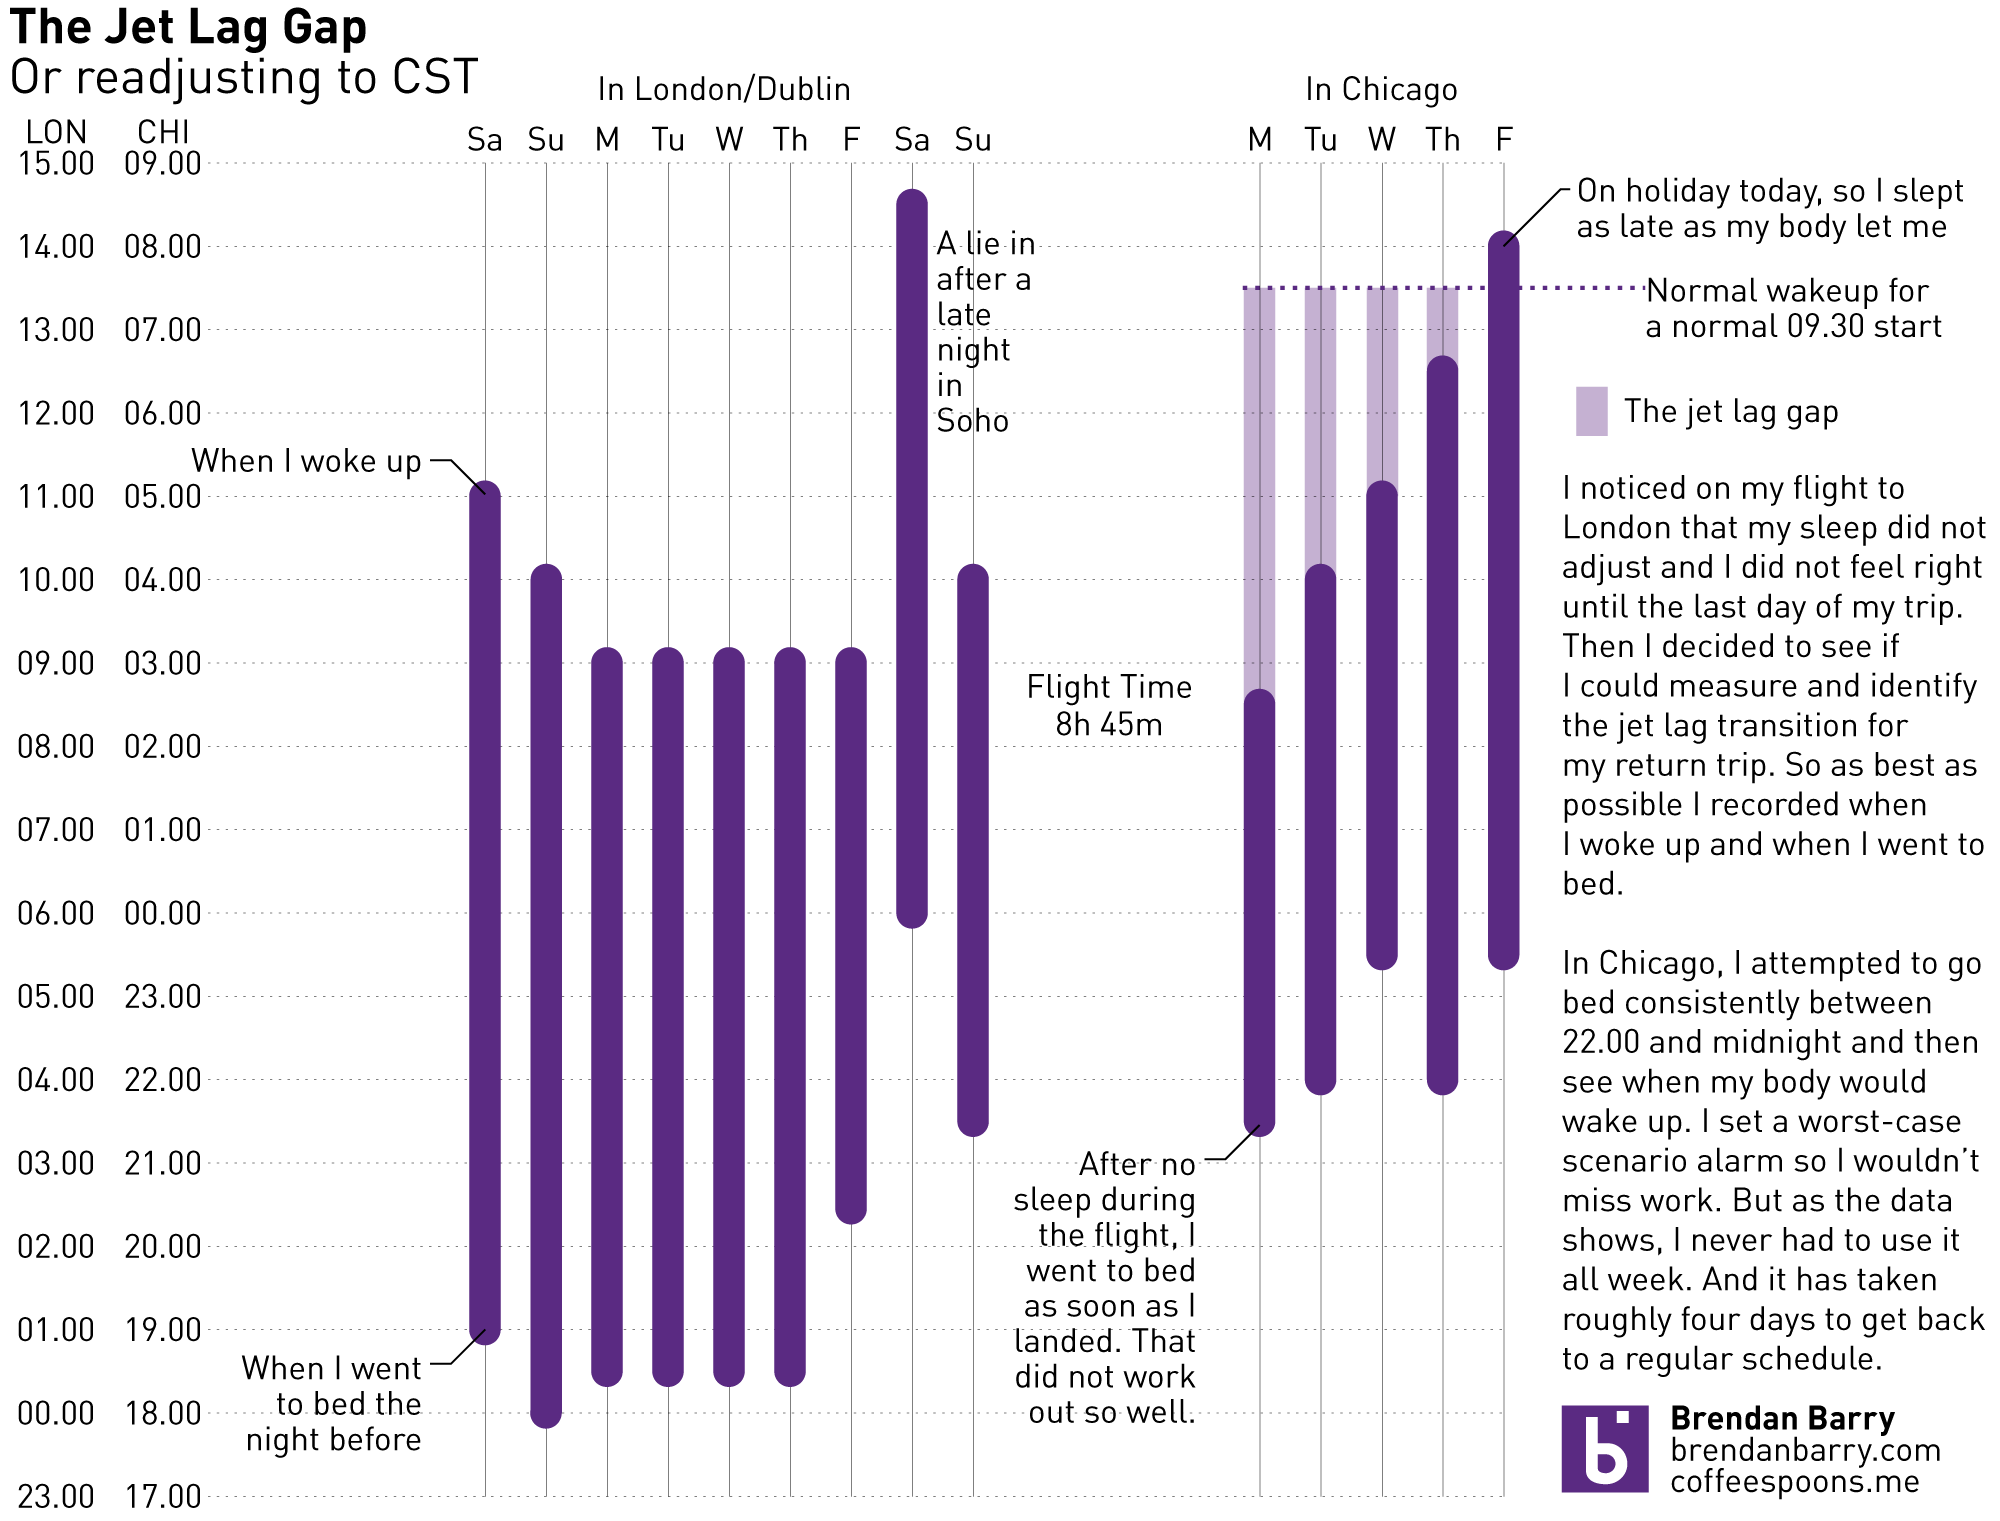
My sleeping periods are in purple

Credit is my own.

Which Countries Do You Drink Like?

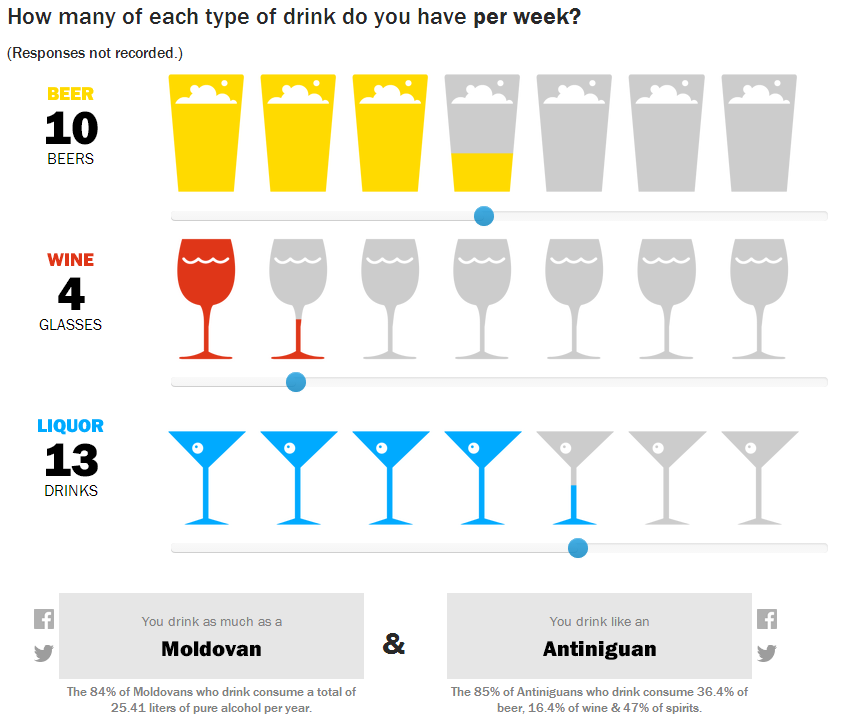
Happy Friday. Happy Memorial Day Weekend. Happy Summer. Just about all of those things mean a drink of some kind. And thanks to Time, we can look at ourselves and find out what drinking culture each of us best reflects. The data comes from the WHO and looks at both total consumption and then share of consumption.

The countries which I drink like

So last week I drank like a Moldovan and most nearly like an Antiniguan. Of course, they meant Antiguan. It just so happens I caught the spelling error. But since most of last week can be chalked up to a house party, I did the week before too. Then I drank like a Belarusian in the style of Guyanese person.

And for those of you who know me, yes, things like this are exactly why I record all the drinks I consumer in my little black book.

Credit for the piece goes to Pratheek Rebala.

Feltron 2012 Annual Report

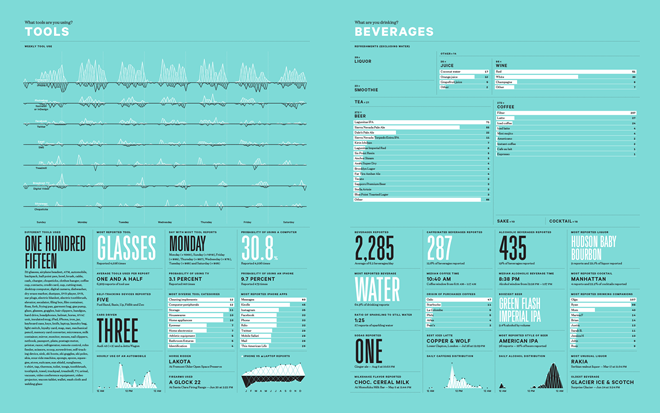
Perhaps the most recent winner in the unsurprising post category is Nicholas Felton’s latest Feltron Report, for 2012. As usual, solid work. Below is the spread for beverages, something which I am known to record and report upon from time to time.

A record of drink consumption sounds familiar…

Credit for the piece goes to Nicholas Felton.

A Nice Cup of Tea

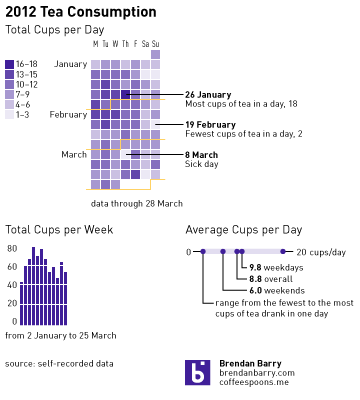
Given the absence of a post yesterday, I took some time to do a small catch-up piece for you all. Those who know me offline are well aware that I document many things about my life including when I happen to drink tea. (And that’s often.) Finding myself with some unexpected time, I looked through the data that I have amassed since 1 January through to 28 March. While I aim to do more with this dataset someday, for now consider this a start. And now a self-surveillance infographic. On drinking tea.

Tea consumption
Tea consumption

It is interesting to note that I have in fact had tea every single day so far this year.