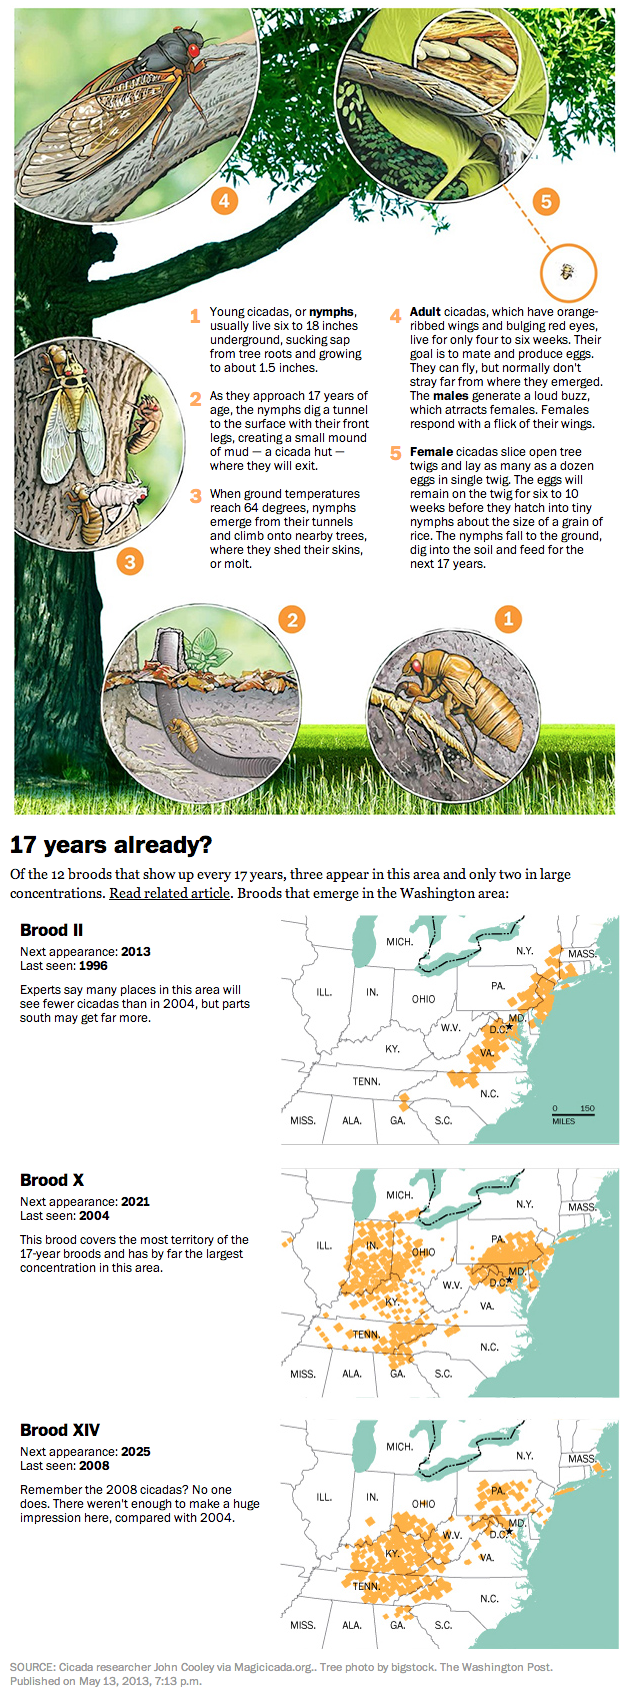
On Tuesday I shared with you some work by Jonathan Corum at the New York Times on the 17-year cicadas now starting to emerge back east. (And as I recall from my childhood, I assure you that they are quite loud.) Today we look at an illustration of the cicada life cycle via the Washington Post.
As I discussed the other day about other graphics, there are differences in how the two newspapers are presenting the same topic or subject matter. The New York Times piece concerns itself with the emergence over time of cicadas across the United States and links to historical articles about those events. Here, however, the Washington Post instead explains just how you get a seventeen-year period between emergences.
Additionally, the Washington Post maps near the end are not interactive as in the New York Times piece. But what this allows the Post to do is focus on those broods that impacted the Washington area instead of all those areas likely outside the Post’s core readership.

Credit for the piece goes to Patterson Clark.
