This is an older piece that I’ve been thinking of posting. It comes from FiveThirtyEight and explores some of the data about Russian trolling in the lead up to, and shortly after, the US presidential election in 2016.
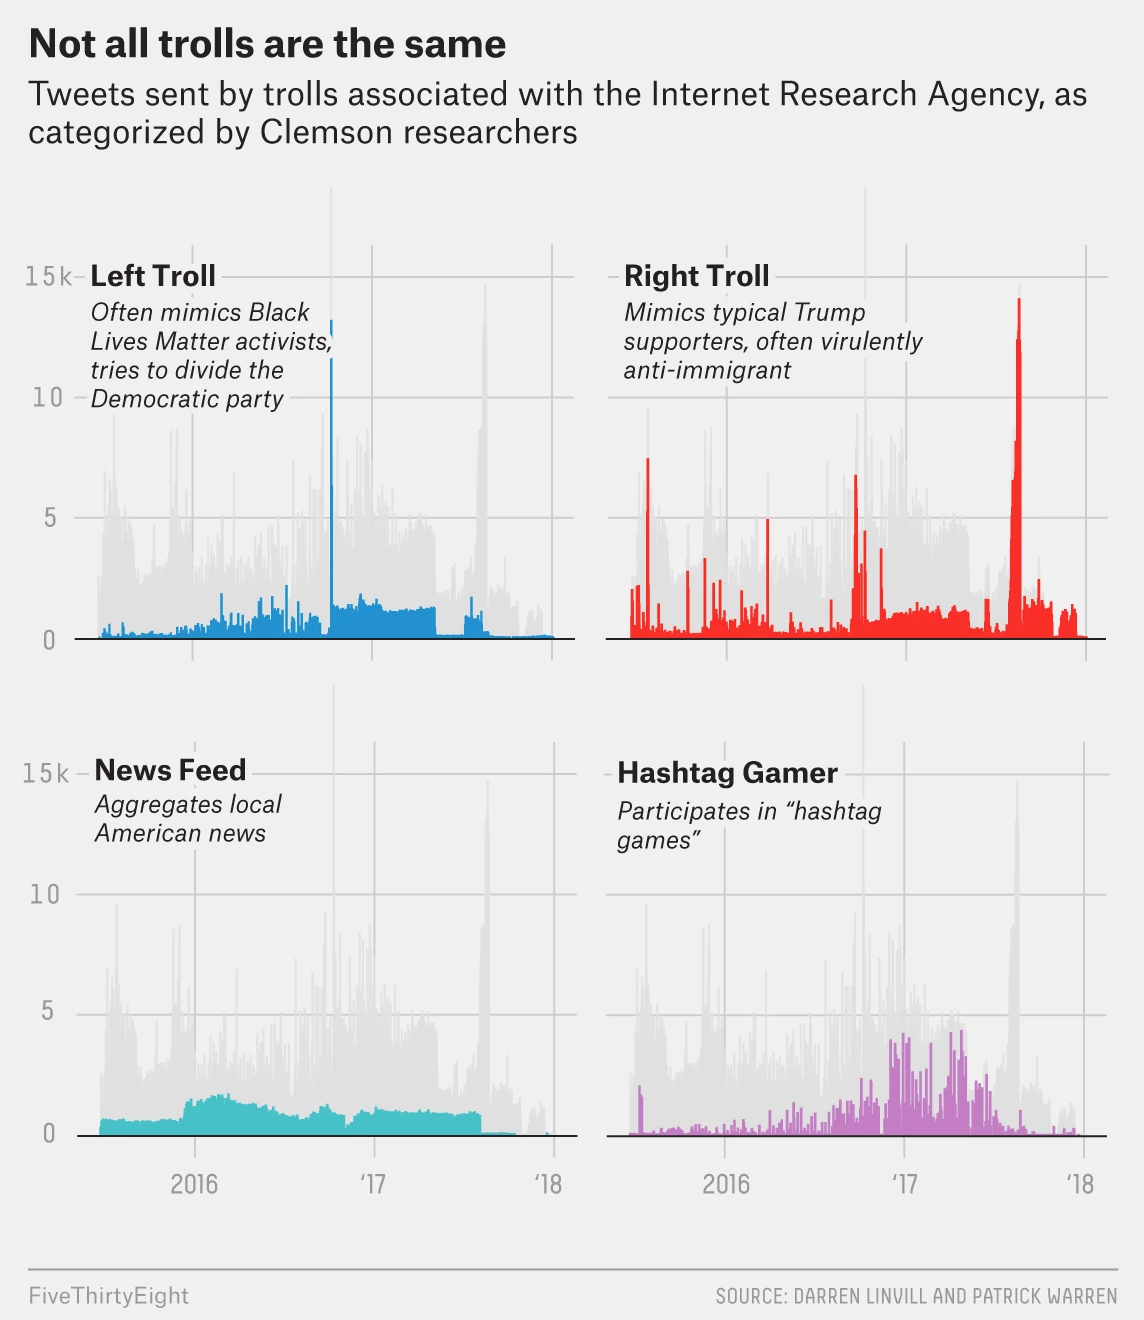
The graphic makes a really nice use of small multiples. The screenshot above focuses on four types of trolling and fits that into the greyed out larger narrative of the overall timeline. You can see that graphic elsewhere in the article in its total glory.
From a design standpoint this is just one of those solid pieces that does things really well. I might have swapped the axes lines for a dotted pattern instead of the solid grey, though I know that seems to be FiveThirtyEight’s house style. Here it conflicts with the grey timeline. But that is far from a dealbreaker here.
Credit for the piece goes to Oliver Roeder.
Leave a Reply
You must be logged in to post a comment.