For those of you reading from the States, I hope you all enjoyed your holiday. And for my UK readers, I hope you all enjoyed your summer bank holiday last weekend. So now to the good and uplifting kind of news.

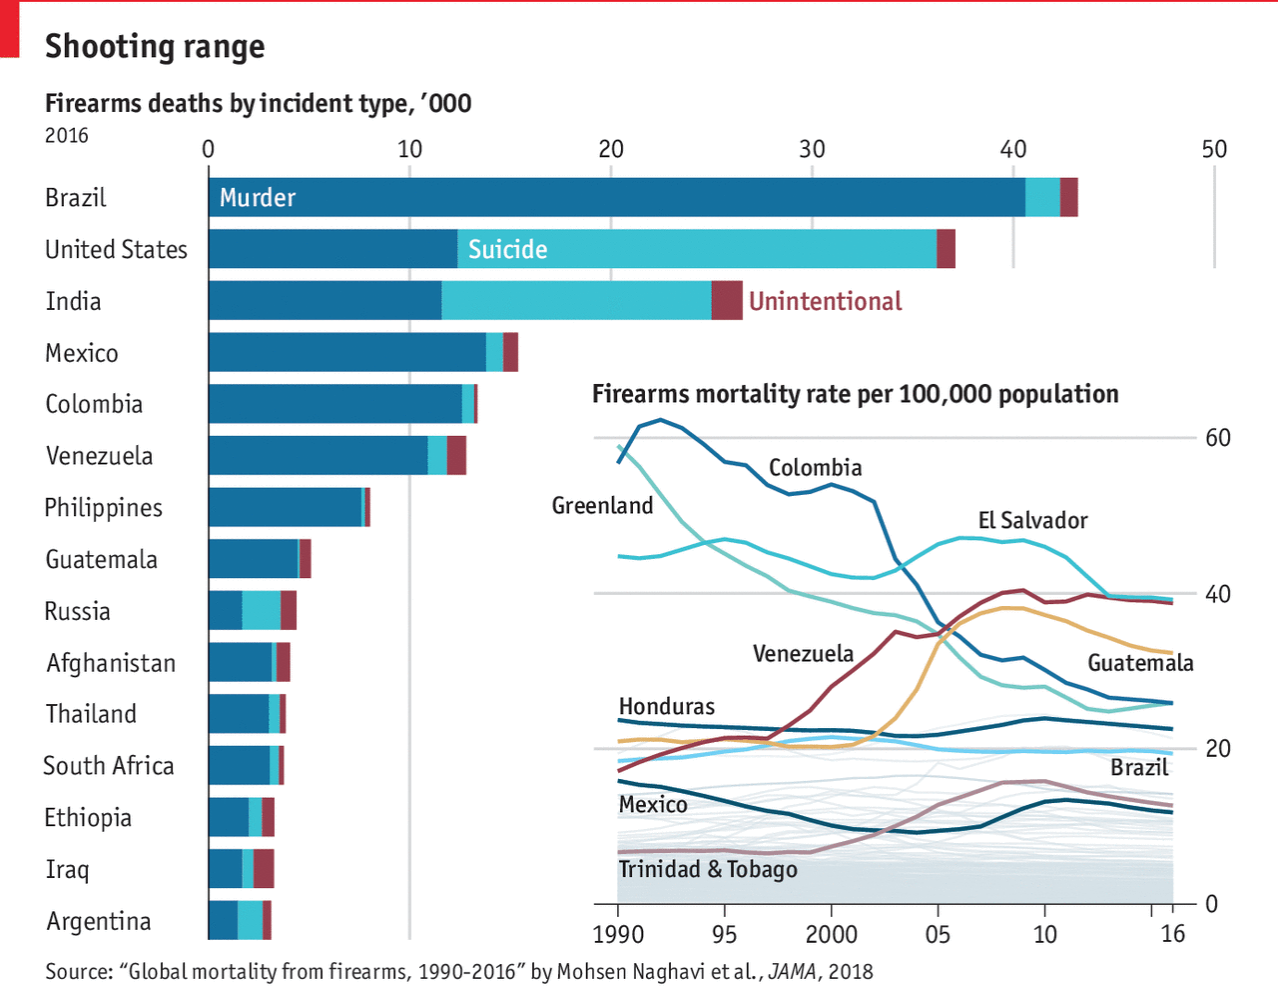
Indeed, a chart about deaths from firearms from the Economist. From a graphical standpoint, we all know how much I loathe stacked bar charts and this shows why. It is difficult for the user to isolate and compare the profiles of certain types of firearm violence against each other. Clearly there are countries where suicide by gun is more prevalent than murder, but most on this list are more murder happy.
And then the line chart that is cleverly spaced within the overall graphic, well, it falls apart. There are too many lines highlighted. Instead, I would have separated these out into a separate chart, made larger, so that the reader can more easily discern which series belongs to which country. Or I would have gone with a set of small multiples isolating those nine countries.
I am also unclear on why certain countries were highlighted in the line chart. Did they all need to be highlighted? Why, for example, is Trinidad & Tobago. It is not mentioned in the article, nor is it in the stacked bar chart.
But the biggest problem I have is with the data itself. But, every one of the countries on that list is among the developing countries or the least developed countries. Except one. And that, of course, is the United States.
Credit for the piece goes to the Economist Data Team.
