I know, I know. You probably expect some sort of climate post given the whole Paris thing. But instead, this morning I came across an article where the supporting chart failed to tell the story. So today we redesign it.
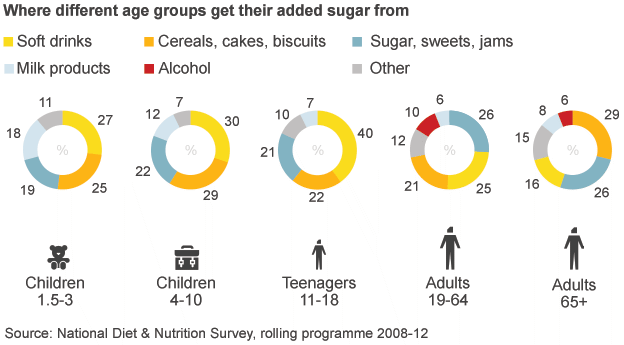
The BBC has an article about MPs backing a tax on sugary drinks. Within the text is a graphic showing the relative importance of sugary drinks in the sugar consumption of various demographics. Except the first thing I see is alcohol—not the focus of the article. Then I focus on a series of numbers spinning around donuts, which are obviously sugary and bad. Eventually I connect the bright yellow to soda. Alas, bright yellow is a very light colour and fails to hold its own on the page. It falls behind everything but milk products.

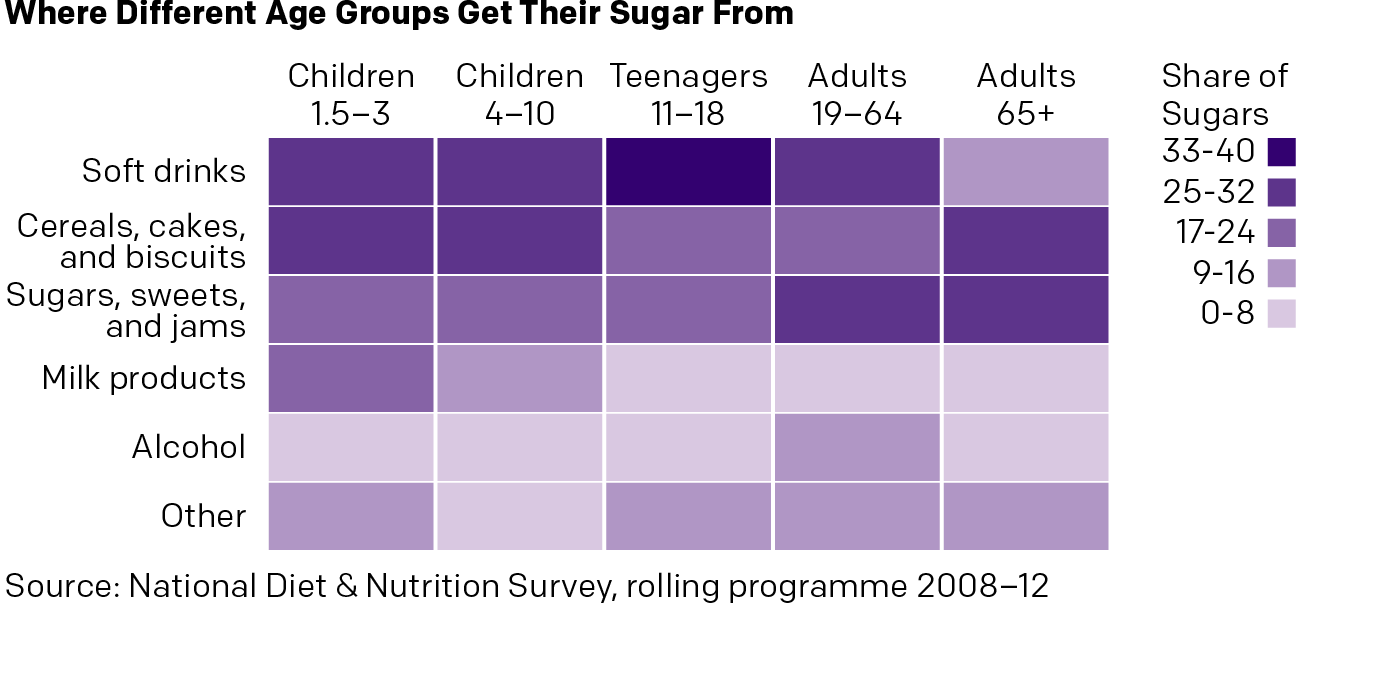
So here is 15 minutes spent on a new version. Gone are the donuts, replaced by a heat map. I kept the sort of the legend for my vertical because it placed soda at the top. I ran the demographic types horizontally. The big difference here is that I am immediately drawn to the top of the chart. So yeah, soda is a problem. But so are cakes and jams, you British senior citizens. Importantly, I am less drawn to alcohol, which in terms of sugars, is not a concern.

Credit for the original goes to the BBC graphics department. The other one is mine.

