Correcting CBS News Charts

One of the long-running critiques of Fox News Channel’s on air graphics is that they often distort the truth. They choose questionable if not flat-out misleading baselines, scales, and adjust other elements to create differences where they don’t exist or smooth out problematic issues.

But yesterday a friend sent me a graphic that shows Fox News isn’t alone. This graphic came from CBS News and looked at the California recall election vote totals.
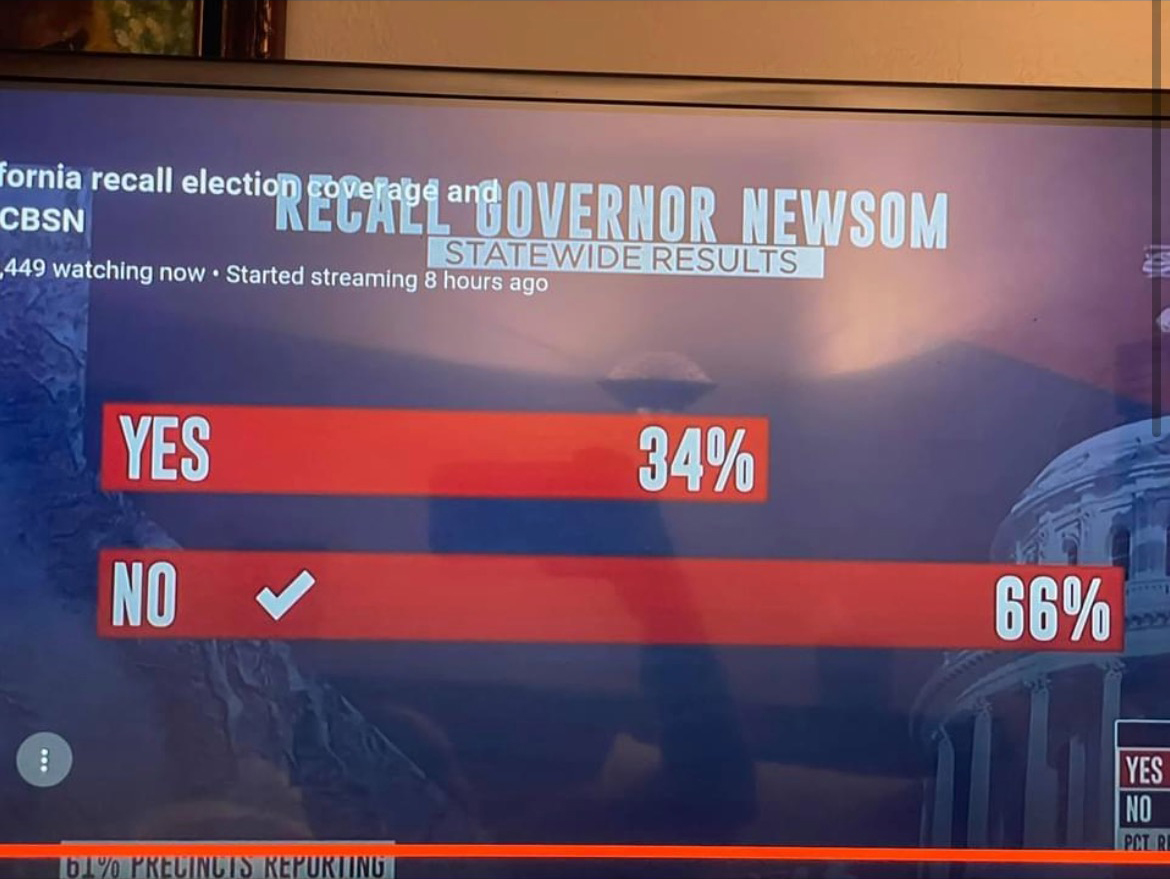
If you just look at the numbers, 66% and 34%, well we can see that 34 is almost half of 66. So why does the top bar look more like 2/3 of the length of the bottom? I don’t actually know the animus of the designer who created the graphic, but I hope it’s more ignorance or sloppiness than malice. I wonder if the designer simply said, 66%, well that means the top bar should be, like, two-thirds the length of the bottom.

The effect, however, makes the election seem far closer than it really was. For every yes vote, there were almost two no votes. And the above graphic does not capture that fact. And so my friend asked if I could make a graphic with the correct scale. And so I did.
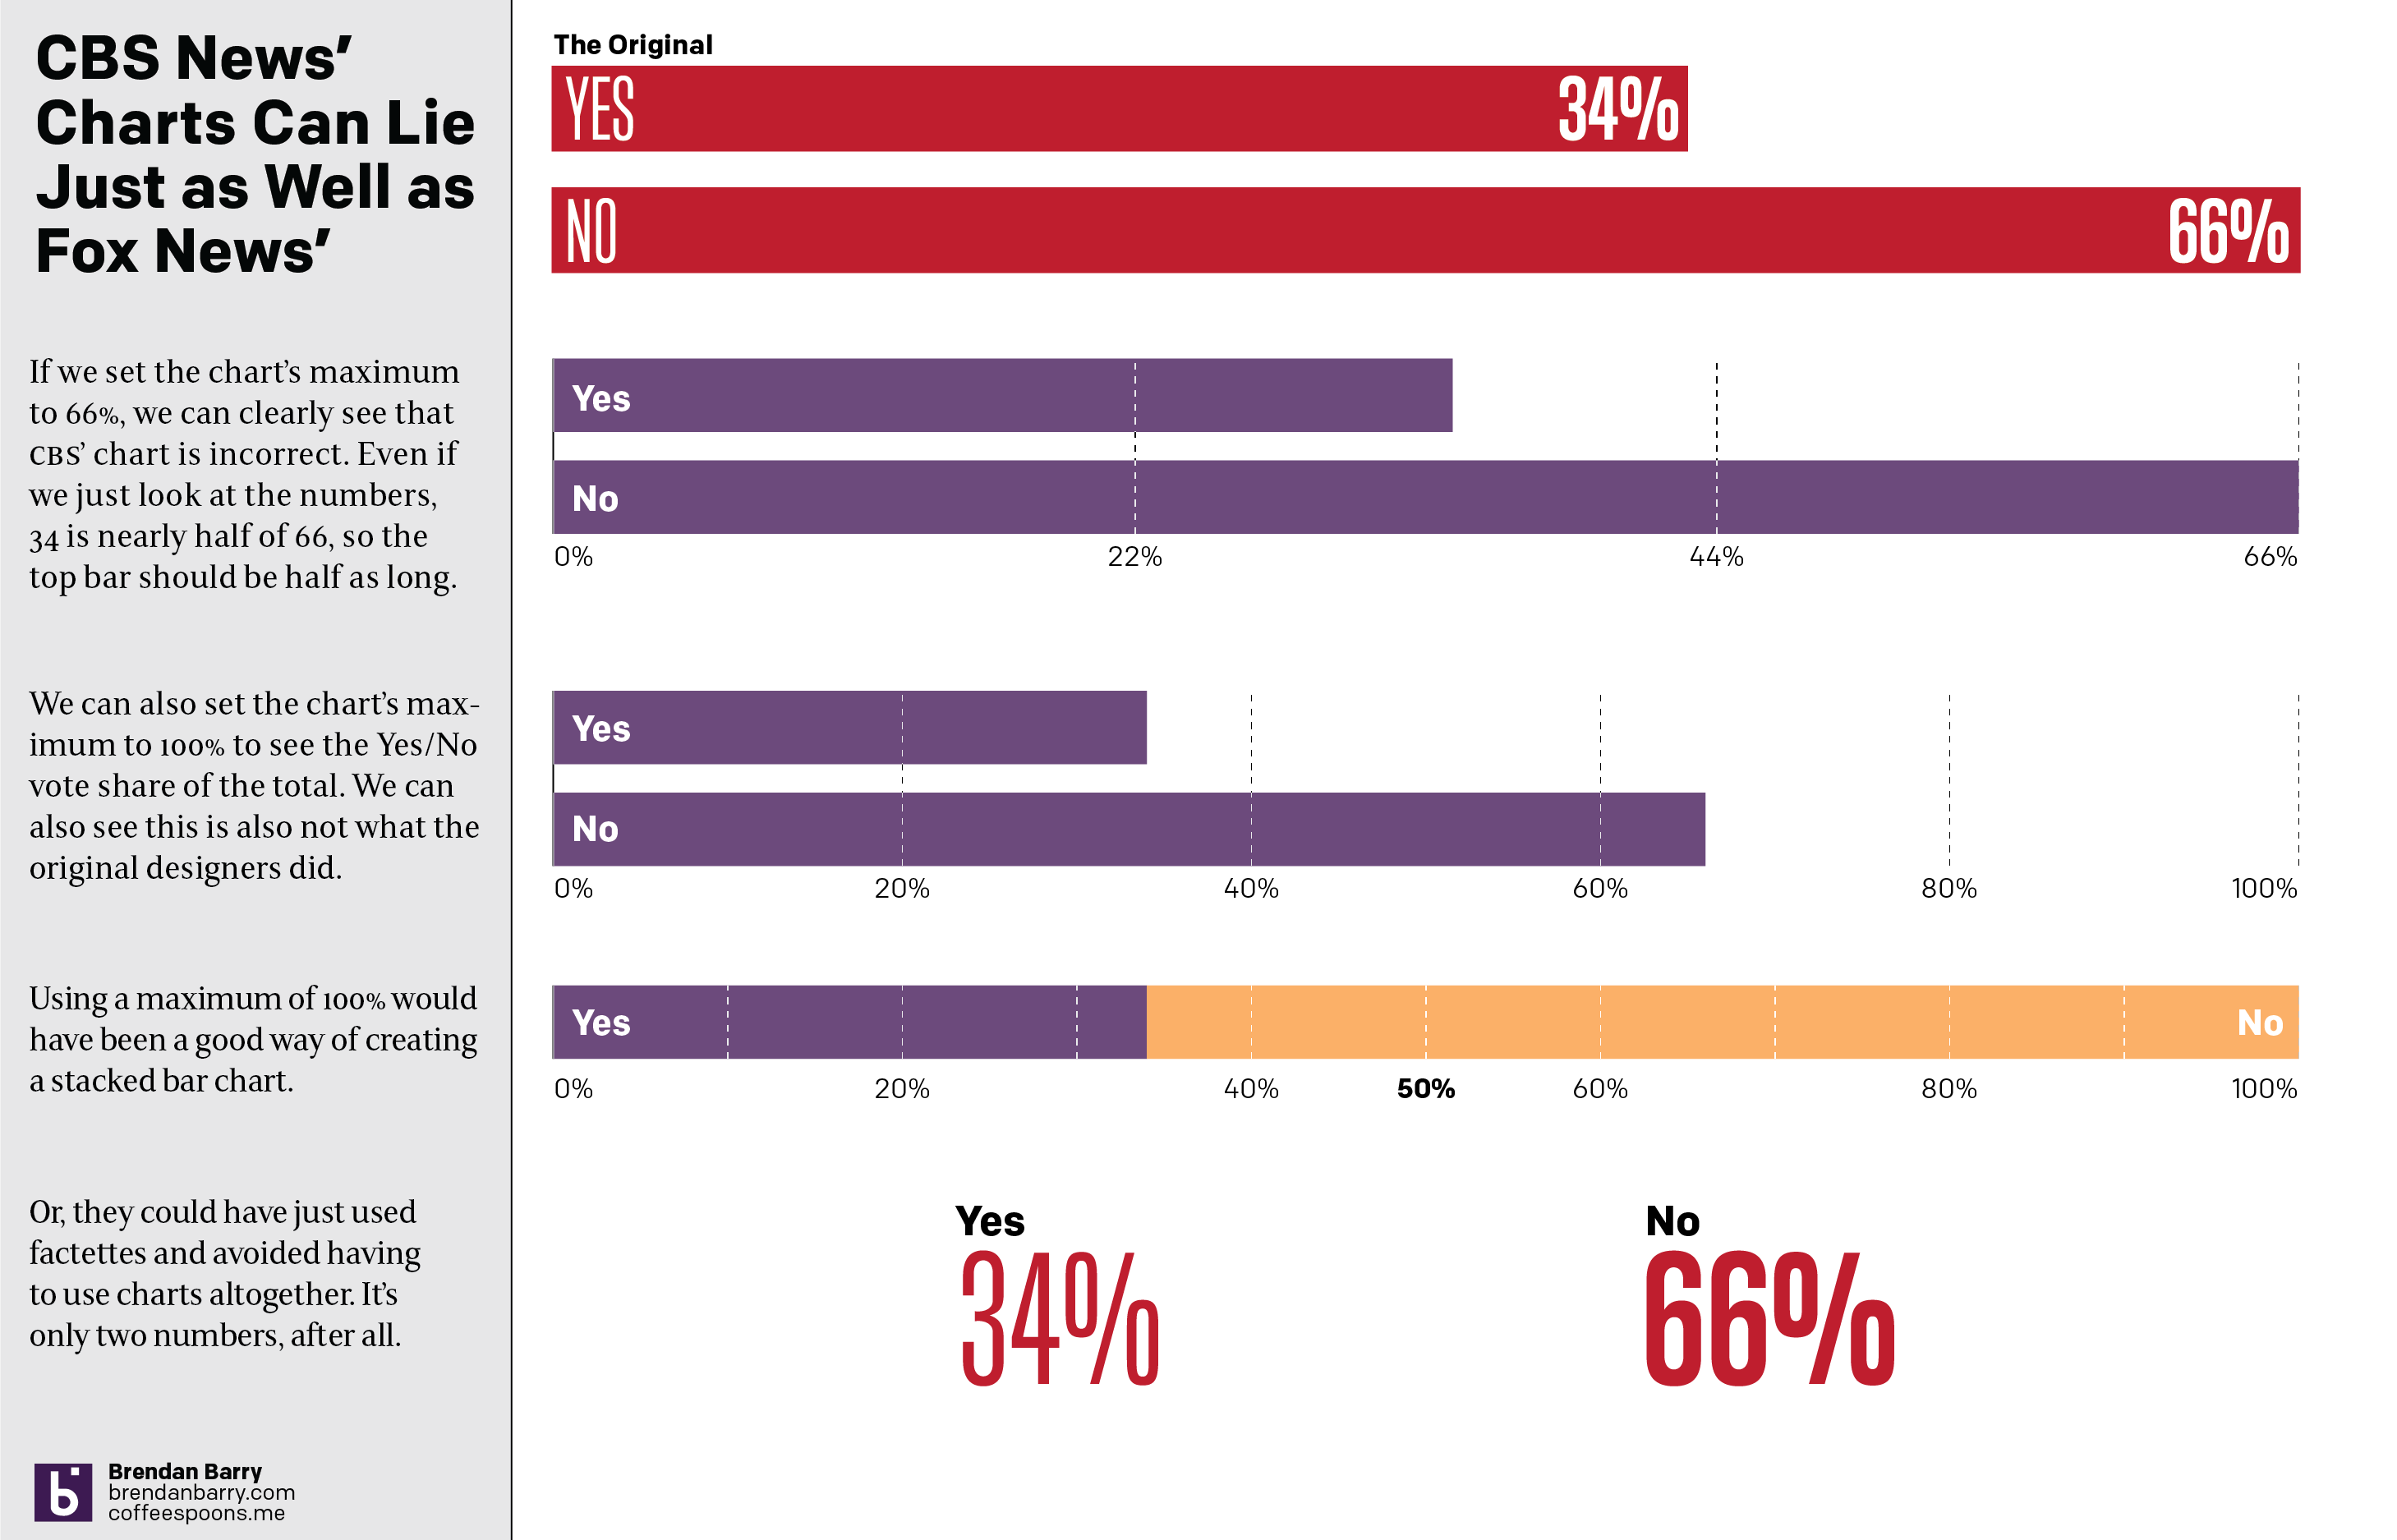
One really doesn’t need a chart to compare the two numbers. And I touch on that with the last point, using two factettes to simply state the results. But let’s assume we need to make it sexy, sizzle, or flashy. Because I think every designer has heard that request.

A simple scale of 0 to 66 could work and we can see how that would differ from the original graphic. Or, if we use a scale of 0 to 100, we can see how the two bars relate to each other and to the scale of the total vote. That approach would also have allowed for a stacked bar chart as I made in the third option. The advantage there is that you can easily see the victor by who crosses the 50% line at the centre of the graphic.

Basically doing anything but what we saw in the original.

Credit for the original goes to the CBS News graphics department.

Credit for the correction is mine.

How to Choose the Match to Broadcast

I was reading the Sunday paper yesterday and whilst I normally skip the sports section, especially during baseball’s offseason, this time a brightly coloured map caught my attention. Of course then I had to read the article, but I am glad that I did.

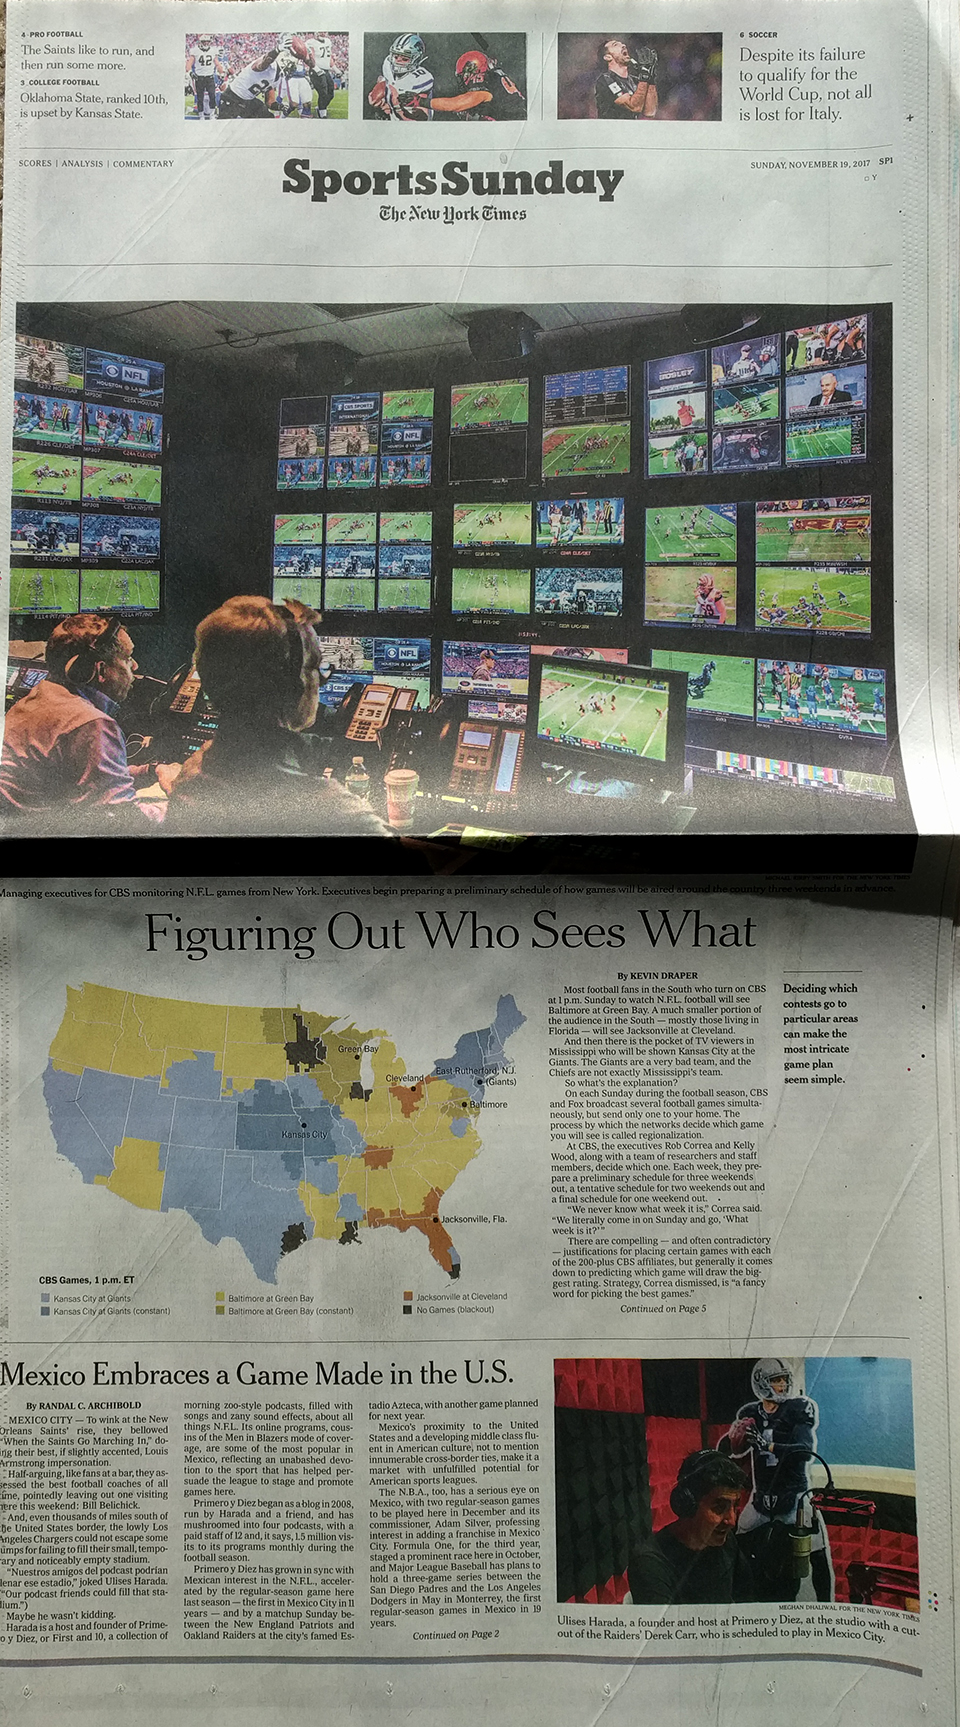
On Sunday the New York Times ran a print piece—I mean I assume I can find it online (I did.)—about CBS chooses which American football matches to air in the country’s markets. It is a wee bit complicated. And if you can find it, you should read it. The process is fascinating.

But I want to quickly talk about the design of the thing. Remember how I said a map caught my attention. That was pretty important, because the map was not the largest part of the article. Instead that went to a nice big photo. But the information designer I am, well, my eyes went straight to the map below that.

The story dominated the section page

There is nothing too special about the map in particular. It is a choropleth where media markets are coloured by the game being aired yesterday. (The piece explains the blackout rules that changed a few years ago from what I remember growing up.)

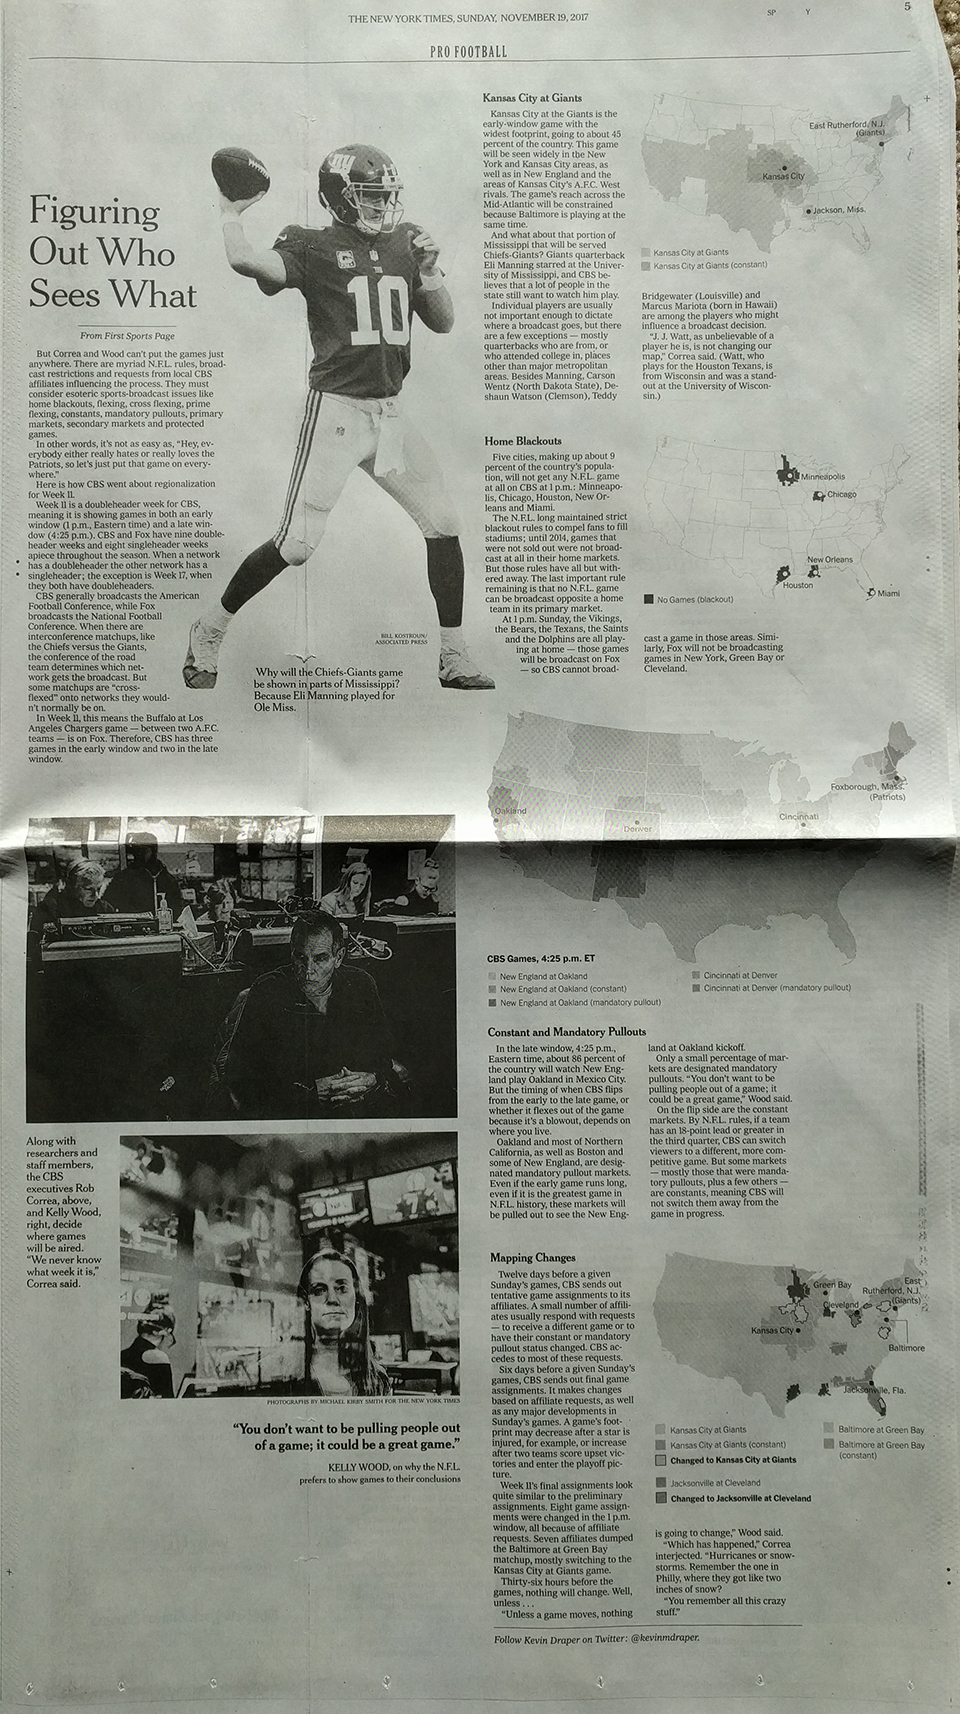
But then on the inside, the article takes up another page, this time fully. It runs maps down the side to highlight the matches and scenarios the author discusses, reusing the same map as above, but because this is an interior page, in black and white. It probably looks even better online as they likely kept the colour. (They did. But the maps are smaller.)

To have that much space in which to design an article…

Overall, I really enjoyed the piece and the maps and visuals not only drew me into the piece, but helped contextualise the story.

Credit for the piece goes to Kevin Draper.

McDonald’s All-day Breakfast

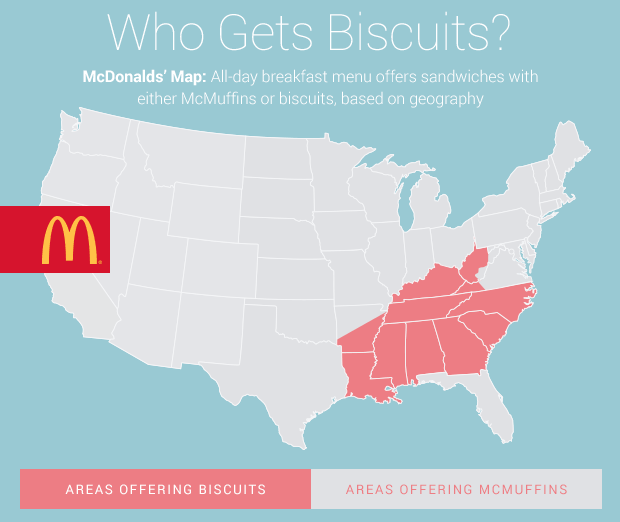
I don’t know about you, but I have seen a lot of those all-day breakfast bags sitting about the city of Chicago the last few days. (That they are not in waste bins is a different story.) CBS took a look at where the biscuit vs. McMuffin offering is available in the US—hint, not Chicago—and compared that geographic spread to something else. It’s worth a quick look.

Where to go for biscuits

Credit for the piece goes to CBS graphics department.

Pitch Recognition

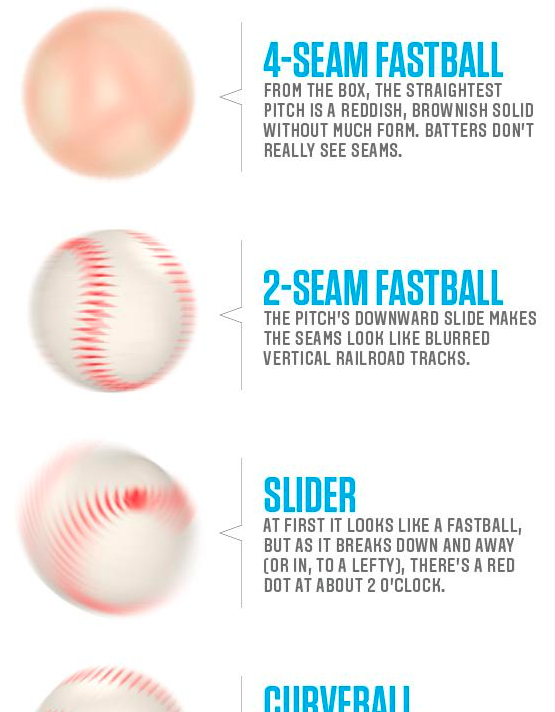
Hitting a baseball is hard. Really, really hard. You’re good at it if you fail 7 out of 10 times. Part of the way you get good at hitting baseballs is by recognising the spin or rotation of the red seams on the white outside of the ball. This article from CBS takes a look at five common pitches and what they look like to the batter.

I have certainly never been able to see these

Credit for the original piece goes to an unknown person, I don’t think it was the article’s author.