The Sun’s Over the Yardarm Somewhere

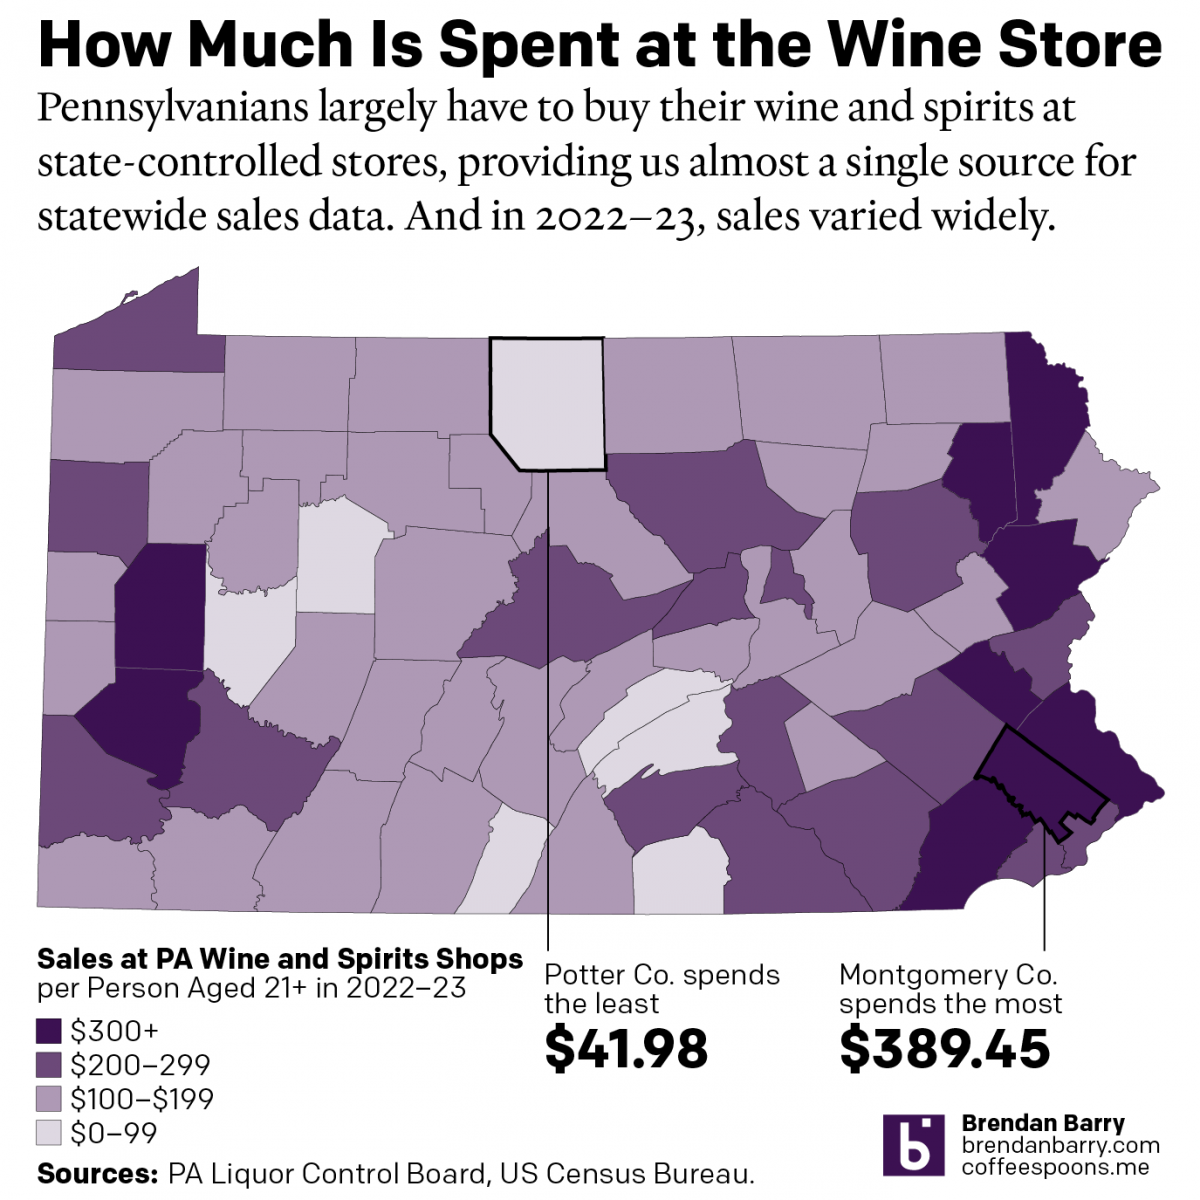
It’s been a little while since my last post, and more on that will follow at a later date, but this weekend I glanced through the Pennsylvania Liquor Control Board’s annual report. For those unfamiliar with the Commonwealth’s…peculiar…alcohol laws, residents must purchase (with some exceptions) their wine and spirits at government-owned and -operated shops.

It’s as awful as it sounds. Compare that to my eight years in Chicago, where I could pick up a bottle of wine at a cheese shop at the end of the block for a quiet night in or a bottle of fine Scotch a few blocks from the office on Whisky Friday for that evening’s festivities. Here all your wine and spirits come from the state store.

And whilst it’s awful from a consumer/consumption standpoint, it makes for some interesting data, because we can largely use that one source to get a sense of the market for wine and spirits in the Commonwealth. That is to say, you don’t need to (really) worry about collecting data from hundreds of other large vendors. Consequently, at the end of the fiscal year you can get a glimpse into the wine and spirit landscape in Pennsylvania.

So what do we see this year?

A choropleth map of per 21+ capita sales of wine and spirits in Pennsylvania.

To start I chose to revisit a choropleth map I made in 2020, just before the pandemic kicked off in the United States. Broadly speaking, not much has changed. You can find the highest per 21+ year old capita value sales—henceforth I’ll simply refer to this as per capita—outside Philadelphia, Pittsburgh, and up in the northeast corner of the Commonwealth.

The great thing about per capita sales are that, by definition, it accounts for population. So this isn’t just that because Philadelphia and Pittsburgh are the largest two metropolitan areas they have the largest value sales—though they do in the aggregate as well. In fact, if we look at the northeast of the Commonwealth in places like Wayne County we see the second highest per capita sales, just under the top-ranked in Montgomery County.

Wayne County’s population, at least of the legal drinking age, is flat comparing 2018 to 2022: 0.0% or just six people. However, sales over that same period are up 20.2% per person. That’s the 15th greatest increase out of 67 counties. What happened?

A little thing called Covid-19. During the pandemic, significant numbers of higher-income people from New York and Philadelphia bought second properties in Wayne County and, surely, they brought some of that income and are now spending it on wine and high-priced spirits.

Wayne County stands out starkly on the map, but it does not look like a total outlier. Indeed, if you look at the highest growth rates for per capita sales from 2018 to 2022, you will find them all in the more rural parts of the Commonwealth. Furthermore, almost every county that has seen greater than 15% growth is in a county whose drinking-age population has shrunk in the last five years.

Overall, however, the map looks broadly similar to how it did at the beginning of 2020. The top and centre of the Commonwealth have relatively low per capita sales, and this is Appalachia or Pennsyltucky as some call it. Broadly speaking, these are more rural counties and counties of lower income.

I spend a little bit of time out in Appalachia each year and have family roots out in the mountains. And my experience casts one shadow on the data. Personally, I prefer my cocktails, whiskies, and gins. But when I go out for a drink or two out west, I often settle for a pint or two. That part of the Commonwealth strikes me as more fond of beer than wine or spirits. And this dataset does not include beer. I have to wonder how the data would look if we included beer sales—though lower price-point session beers would still probably keep the per capita value sales on the lower end given the broad demographics of the region.

Finally, one last note on that second call out, Potter County having the lowest per capita sales at just under $42 per person. The number struck me as odd. The next lowest county, Fulton, sits nearly $30 more per person. Did I copy and paste the data incorrectly? Was there a glitch in the machine? Is the underlying data incorrect? I can’t say for certain about the third possibility, but I did some digging to try and hit the bottom of this curiosity.

First, you need to understand that Potter County is, by population, the 5th smallest with just over 16,000 total people living there. And as far as I can tell, it had just three stores at the beginning of 2022. But then, before the beginning of the new fiscal year, one of the three stores closed when an adjoining building collapsed. It was never rebuilt. And so perhaps 1/3 of the local population was forced to head out-of-county for wine and spirits. Compared to 2018, per capita sales in Potter County declined by 62%, and most of that is within the last year as the annual report lists the year-on-year decline as just under 54%.

In coming days and weeks I’ll be looking at the data a bit more to see what else it tells us. Stay tuned.

Credit for the piece is mine.

Where Is Pennsyltucky?

So last week I mentioned Pennsyltucky in my blog post about Pennsylvania’s forthcoming importance in the election. And then on Friday I shared a humourous illustrated map of Pennsylvania that led into an article on Pennsyltucky. But where exactly is it?

Luckily for you, I spent a good chunk of my weekend trying to find some data on Pennsylvania and taking a look at it. You can see and read the results over on a separate page of mine.

Where is Pennsyltucky?