Crossing the Detroit River (Panic in Detroit)

The National Post’s business section, branded separately as the Financial Post, posted a comment about a proposed bridge that would span the Detroit River and add a third major crossing to the Detroit–Windsor area. The comment used a graphic to explain one of the key points of the story, that early 21st century traffic projections haven proven to be very much incorrect. Unfortunately, it took me a little bit of time to realise that in the graphic.
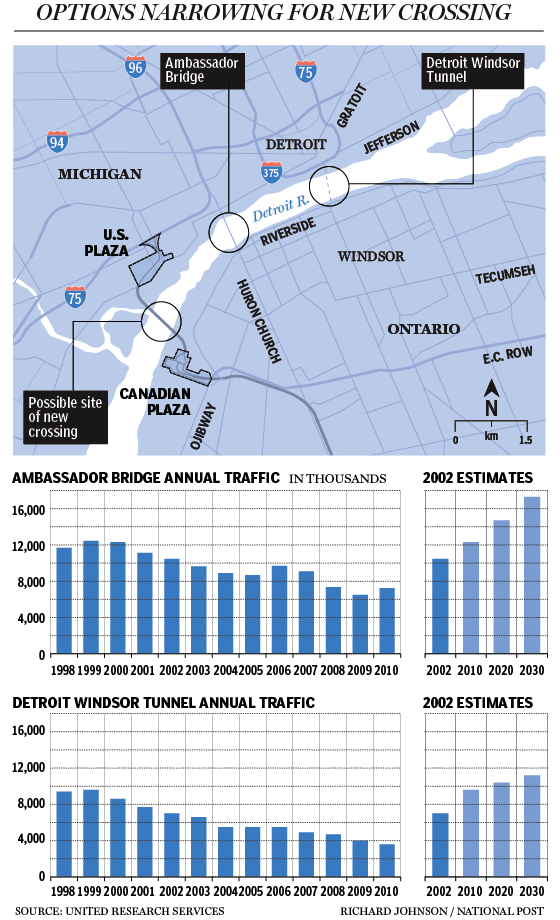
Crossing Options Original

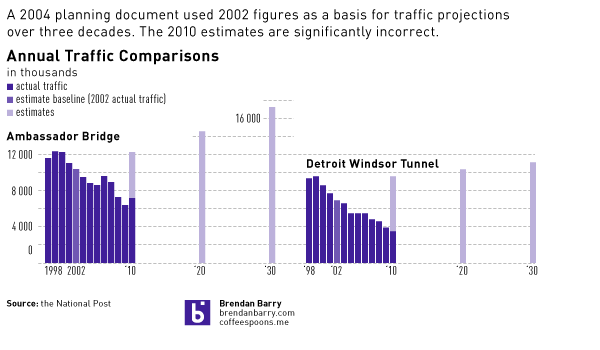
So without access to the raw data provided by United Research Services I have made a quick attempt to improve the graphic within the confines of Coffee Spoons’ main column space, i.e. 600 pixels. The original locator map is quite useful and therefore not included in my effort.
Detroit River Crossing Traffic Revisited

My main issues with the charts are the separation of the estimates from the actuals and the spacing between the estimates. I would have preferred to have seen, as in my example, how the actuals for 2010 fell far short of the 2004 projections. Ideally, I would have liked to have seen the original estimates for the intervening years between 2010, ’20, and ’30, however that data was not provided in the comment if it is even available from the original source. Consequently, unlike the original, I have kept the spacing of the actual data in the estimates with the intervening gaps.

The subtle effect of this increased spacing is to reduce the visual speed, if one will, of the projected growth. Over the original and narrower space the rate of increase appears fairly dramatic. However when given the correct spacing the ‘time’ to reach the projections lengthens and thus the rate ‘slows down’.

Credit for the original piece goes to Richard Johnson. The reinterpretation and any errors therein are entirely my own.

New New York

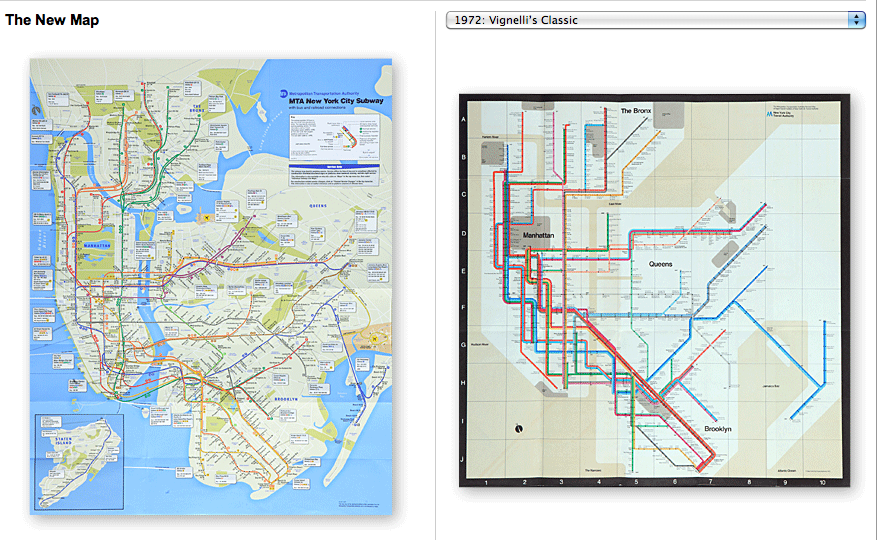
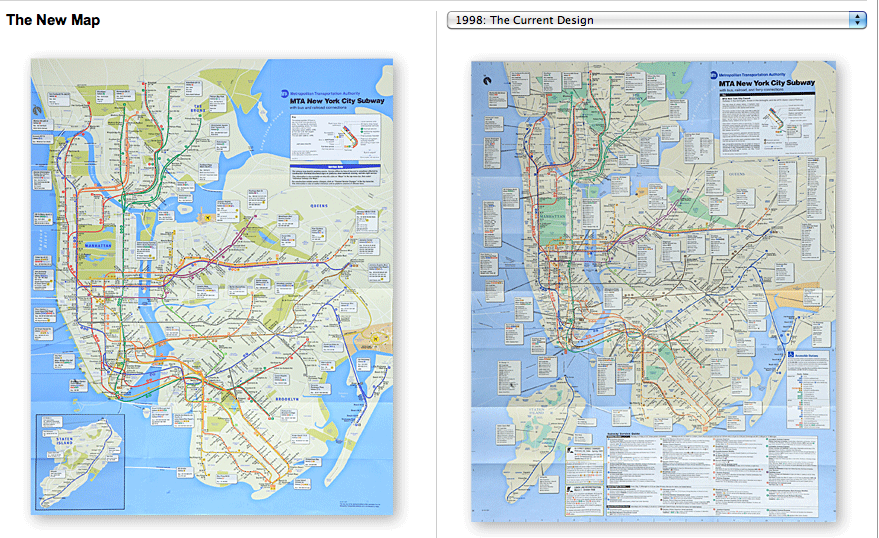
Not quite of the New Earth (and therefore the 15th reincarnation of New York) variety, but, with maps being a key means of defining a city, state, or country, when a map is changed its meaning can also be changed. So, the new MTA map for New York presents some interesting changes summarised in this piece by the New York Times.

current–1998

When you compare the new map to the most recent, a few things stand out. The blue is much brighter—which I think detracts from the purpose of communicating rail routes over land—for starters. Beyond that we see that the boroughs are all larger with the exception of Staten Island. An unfortunate implication is that reducing the prominence of Staten Island on the map will, well reduce the prominence of the island to those who ride the MTA. To be fair, that is likely an acceptable trade-off given what I understand about the demographic, commercial, and cultural scales of importance between Staten Island and the other four boroughs when you factor in the need to display routes and other such transit information.

Another key change is the reduction in the additional information at the bottom of the map. Removing the text—perhaps the bus connection information referenced in the article, but as a non-New Yorker I cannot say for certain—allows one the space to make the boroughs larger. This allows the rail map to be more a map about rails than about bus connections.

All in all, the map appears an improvement. I disagree with some of the colour choice and the drop shadowing of the lines over the map. But for making the map larger and more about being a map, I could live with those changes. On the other hand, I still prefer non-geographic maps for transit maps. And so I shall never quite understand why they dismissed the Vignelli map.

current–1972

The Challenge from FlowingData

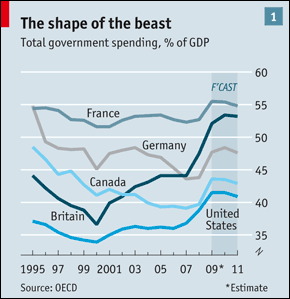
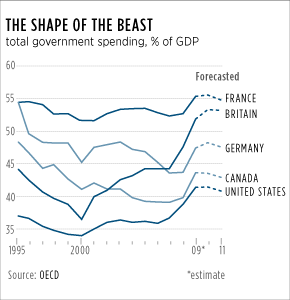
The 25 February posting from FlowingData issues a challenge to improve a chart from the Economist. I find that the Economist usually does pretty solid work and so improving their output is by no means easy. Regardless, I figured I would further delay starting my Friday work by spending 15–20 minutes on an attempt to improve the Economist’s work.

Original from the Economist vs. My Attempt

challenge-original

challenge-redux

I did not find a whole lot of flaws in their chart. Most unnecessary bits have been eliminated and we have a clean line chart. The semi-advantage allowed us all is that we do not have to follow the branding guidelines of the Economist. Initially, I attempted to do a straight grey-scale chart but found the overlapping lines could be a bit confusing. And so I added a hint of blue and then tinted lines when they overlapped to aid the reader in following each line.

I also eliminated the shaded Forecast area and replaced it with switching the solid lines of the historic data to a dashed line for forecast data. The exact shape of the lines may not be exact because I traced over the lines with the pen tool in Illustrator—but for these purposes that seemed reasonable to me.

The other ‘big’ change was more typographic in nature. I decided to highlight the countries and drop back the labels by making the latter grey.