Last week I wrote about how CBS News’ coverage of the California recall election featured a misleading graphic. In particular, the graphic created the appearance that the results were closer than they really were.
This week we had another election and, sadly, I find that I have to write the same sort of piece again. Except this time we are headed north of the border to Canada.
I was watching CBC coverage last night and I noticed early on that the vote share bar chart looked off given the data points. Next time it popped up I took a screenshot.
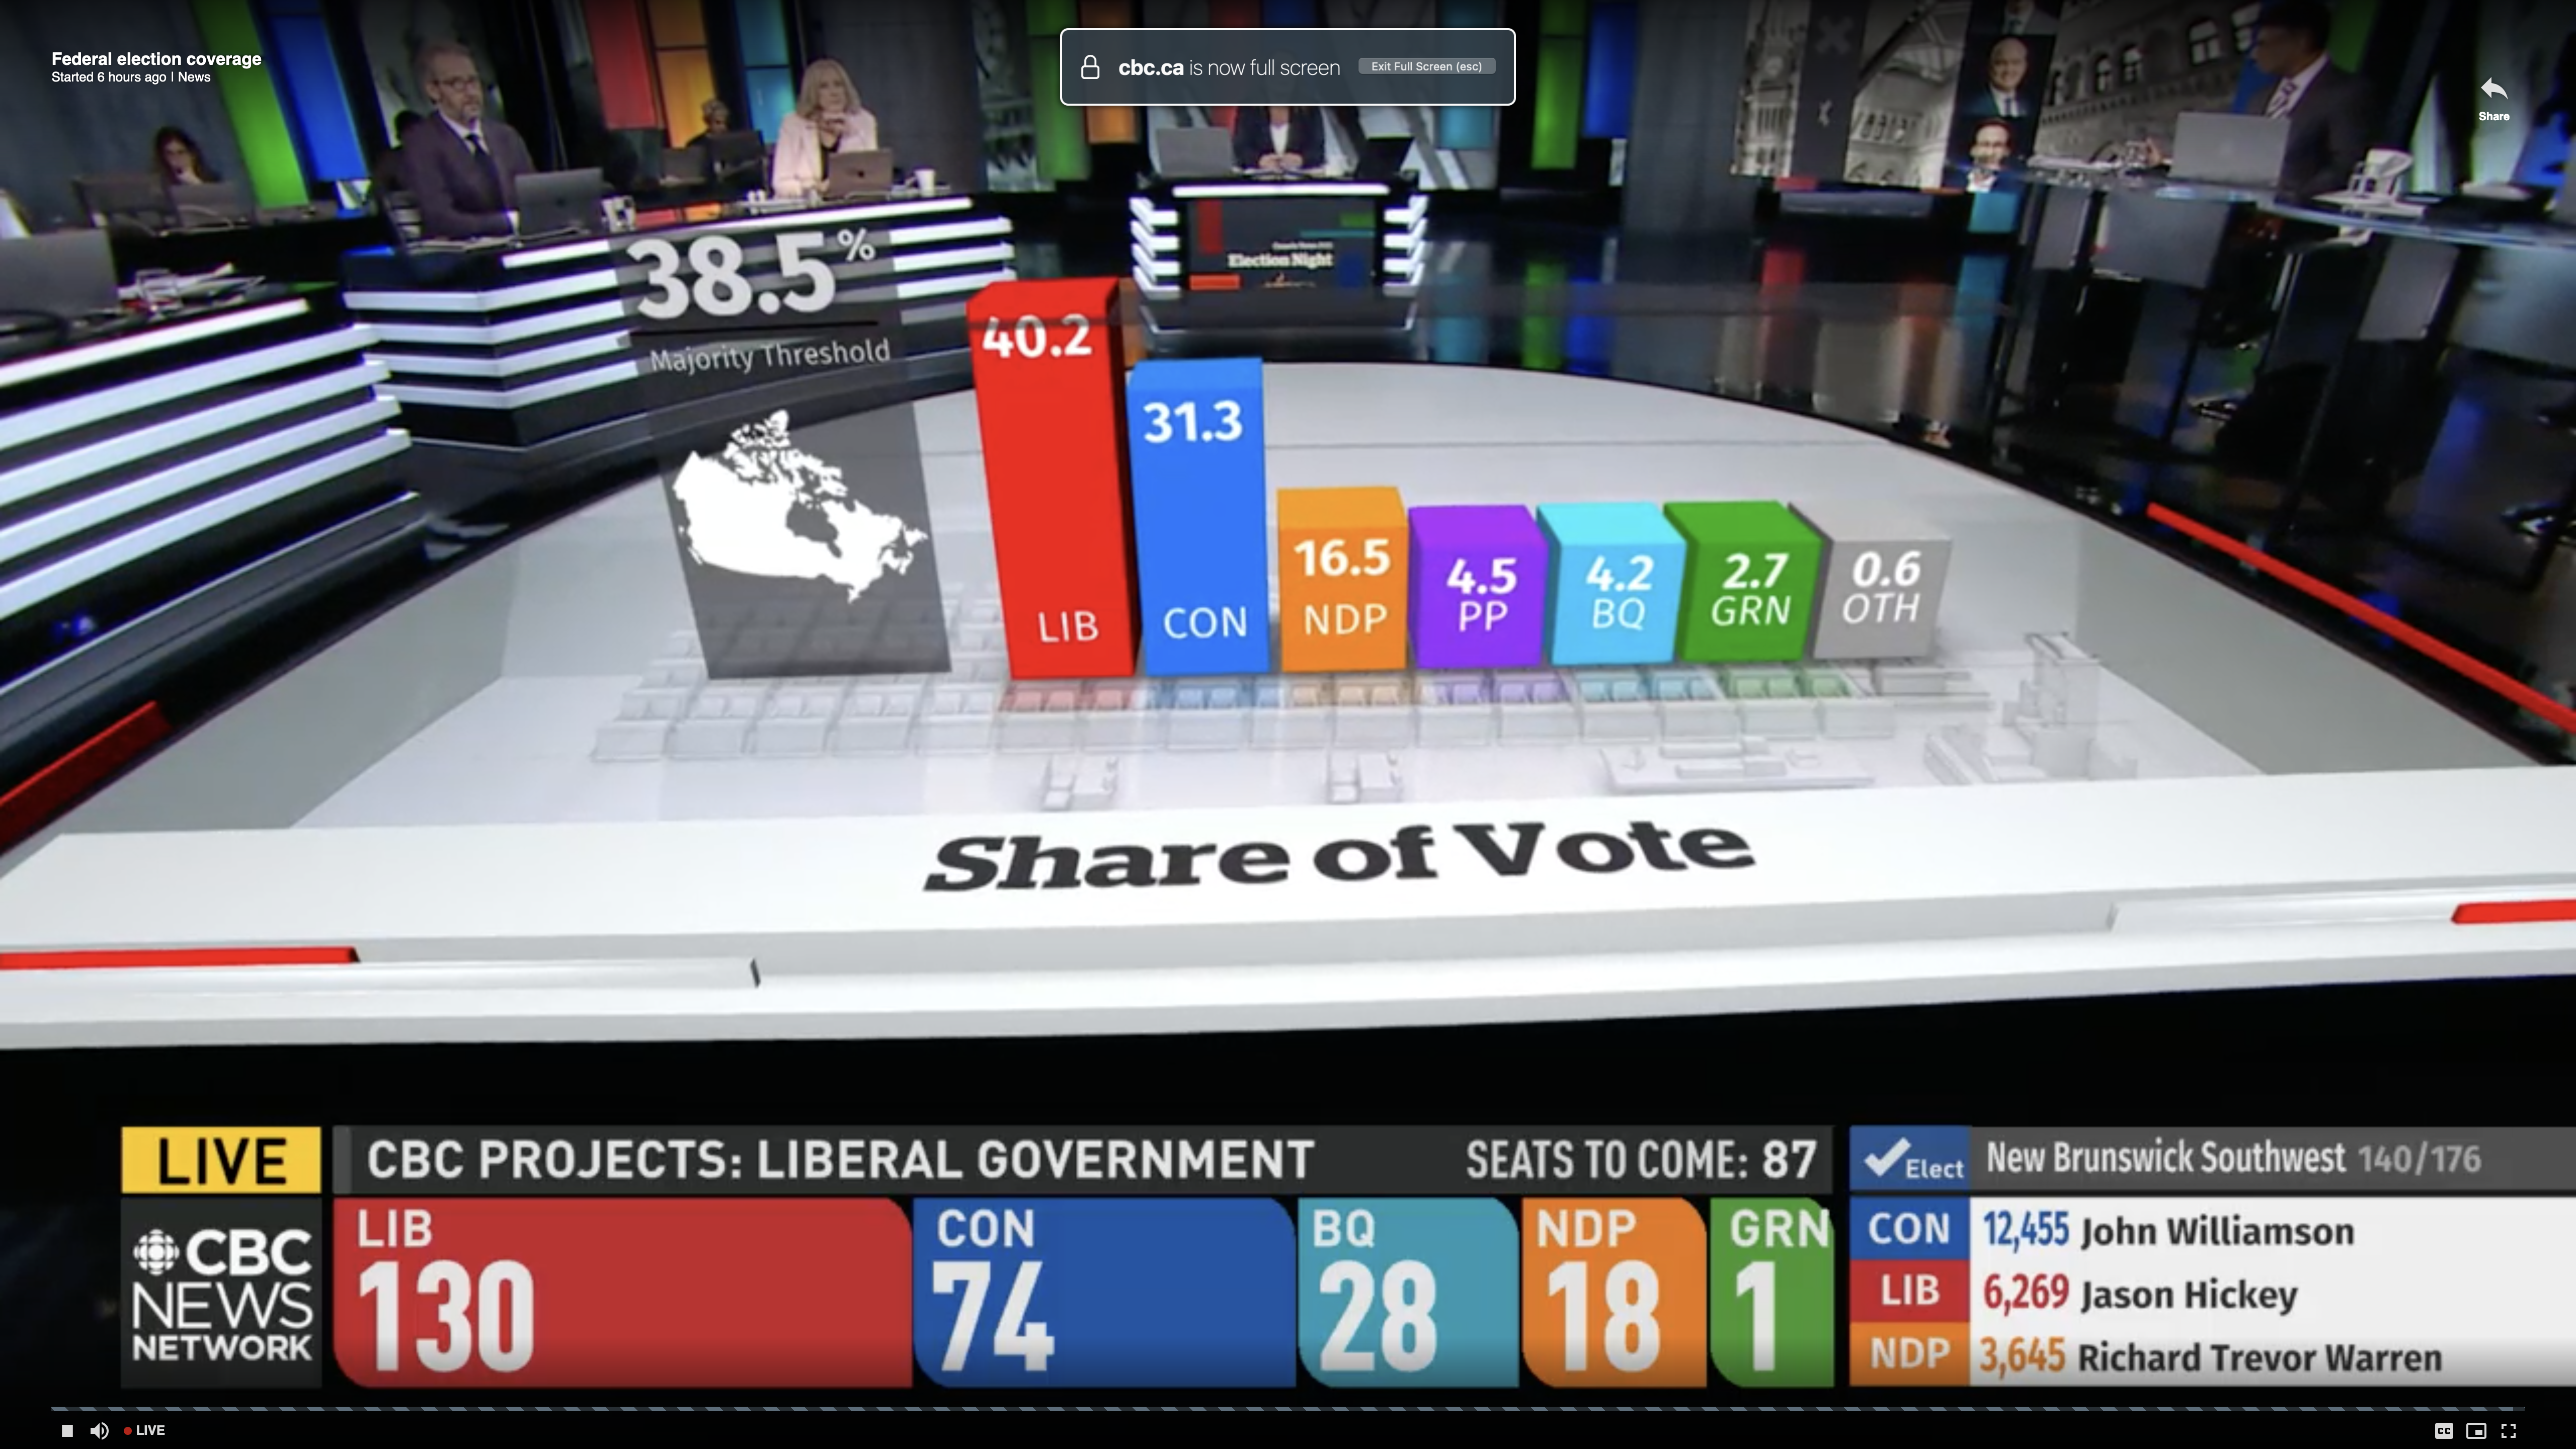
First we need to note these are three-dimensional and the camera angle kept swinging around—not ideal for a fair comparison. This was the most straight-on angle I captured.
Second, at first glance, we have the Conservative share at a little more than 3/4 the Liberal vote share. That looks to be about right. Then you have the New Democratic Party (NDP) at roughly half the vote of the Conservatives. And the bar looks about half the height of the blue Conservative bar. Checks out. Then you have the People’s Party of Canada at roughly 1/4 the amount of NDP votes. But now look at the bar’s height. The purple bar is nearly the same height as the orange bar.
Clearly that is wrong and misleading.
The problem, I think, is that the designers artificially inflated the height of the bars to include the labels and data points for the bars. The designers should have dropped the labelling below the bars and let the bars only represent the data.
I created the following graphic to show how the chart should have looked.
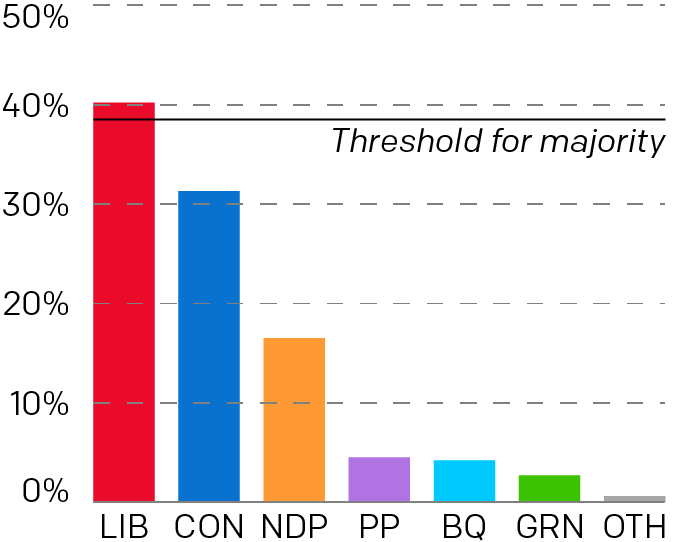
Here you can more clearly see how much greater the NDP victory was over the People’s Party. The labelling falls below the charts and doesn’t distort the height comparison between the bars. In some respects, it wasn’t even close. But the original graphic made it look else wise.
I just wish I knew what the designers were thinking. Why did they inflate the bars? Like with the CBS News graphic, I hope it wasn’t intentional. Rather, I hope it was some kind of mistake or even ignorance.
Credit for the original piece goes to the CBC graphics department.
Credit for the updated version is mine.

