Canada held an election yesterday. For your briefing on it, John Oliver did a great job on Last Week Tonight. But for the serious coverage, we have results.
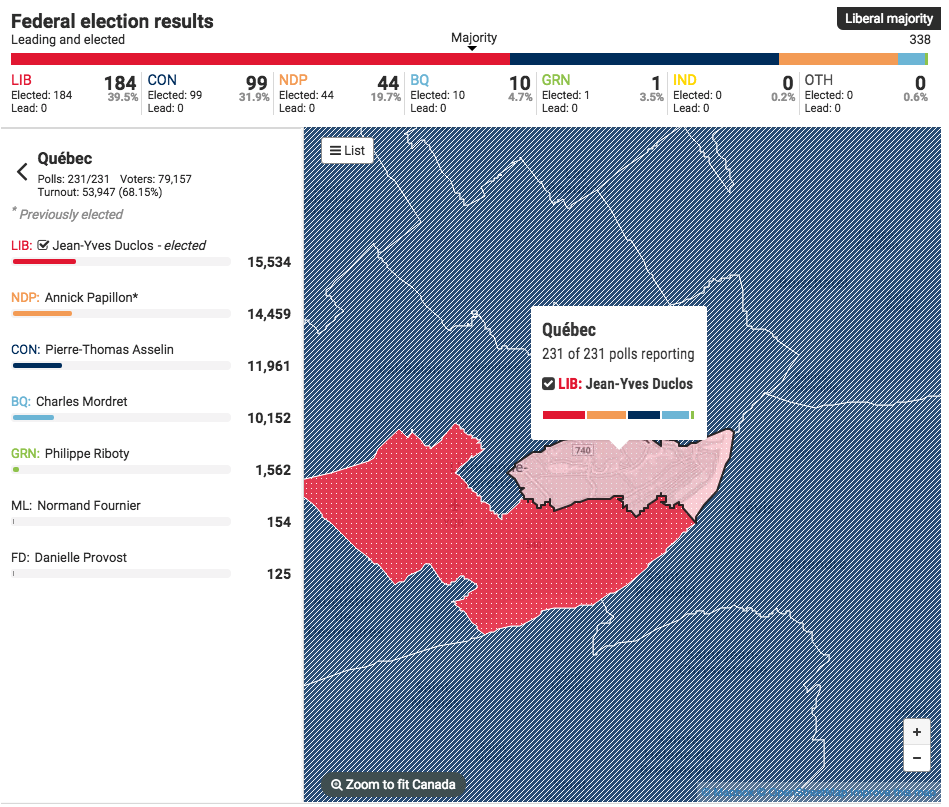
Here we have the results coverage by the National Post. It’s your standard choropleth coloured by the victor in each riding, or constituency. From a design side, I find the pattern fill interesting and not something I have seen done before for a political map.

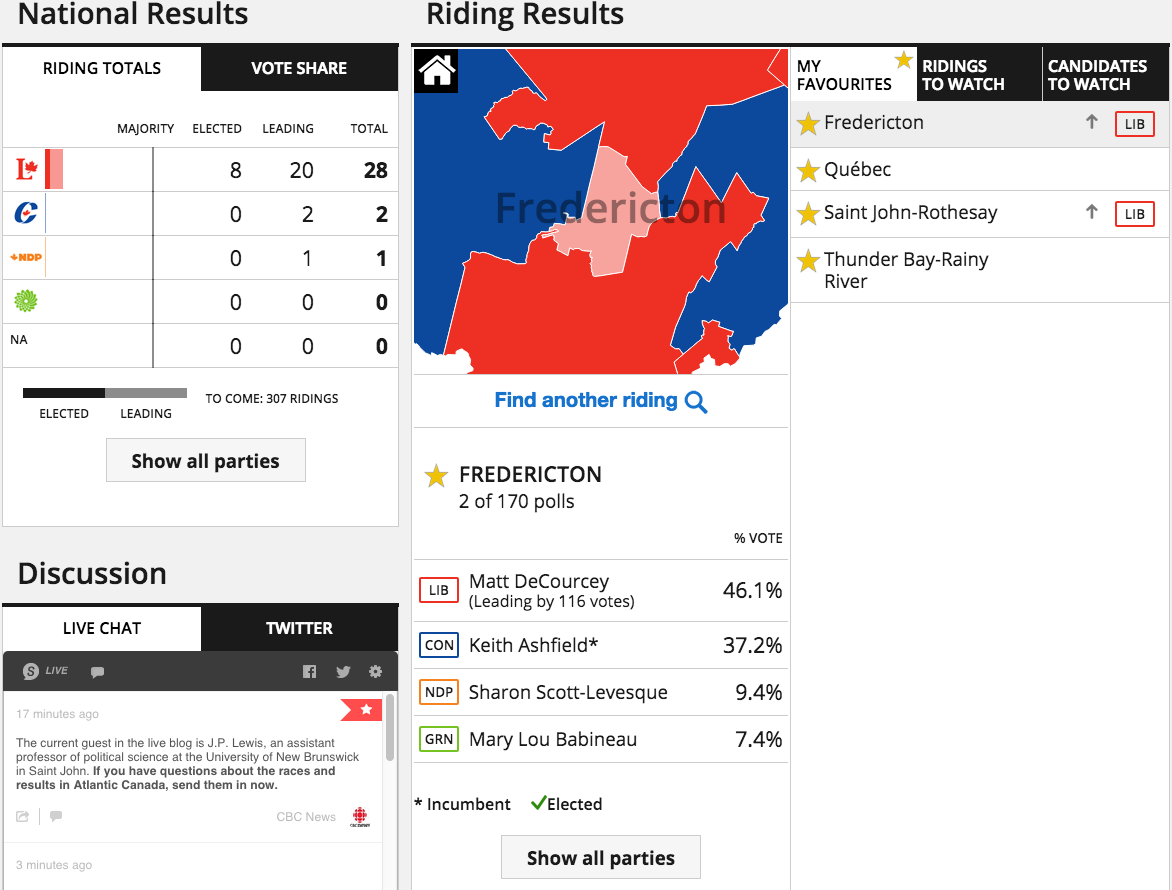
But I really like what the CBC did. They built an interactive application to cover the evening’s results as they arrived. This screenshot is for the riding in Fredericton, where my ancestors lived in the 19th century. (I had to have a connection to the ridings somehow.) In particular, I liked the ability to star ridings of interest and have them immediately retrievable. The CBC complemented that with a list of ridings to watch. It was a great resource for the evening.

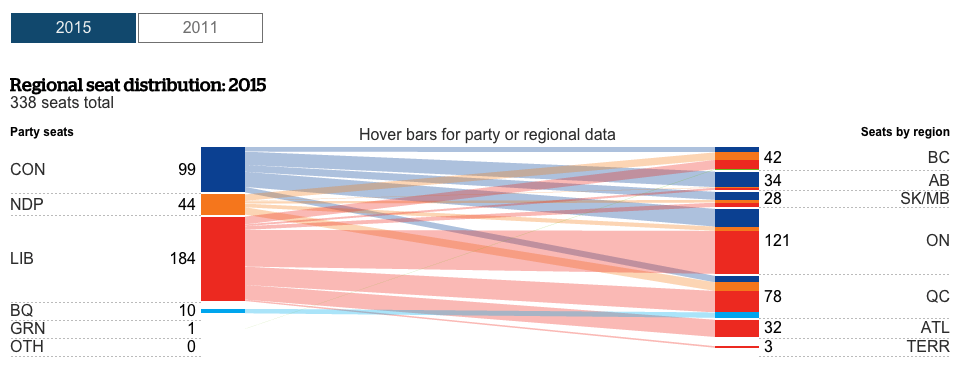
But then they also covered the results with an article with interactive graphics. This is more your standard fare with choropleths, bar charts, and line charts. But they flow through the article quite sensibly. Overall, a solid results piece.

Credit for the National Post piece goes to the National Post graphics department.
Credit for the CBC piece goes to the the CBC graphics department.
