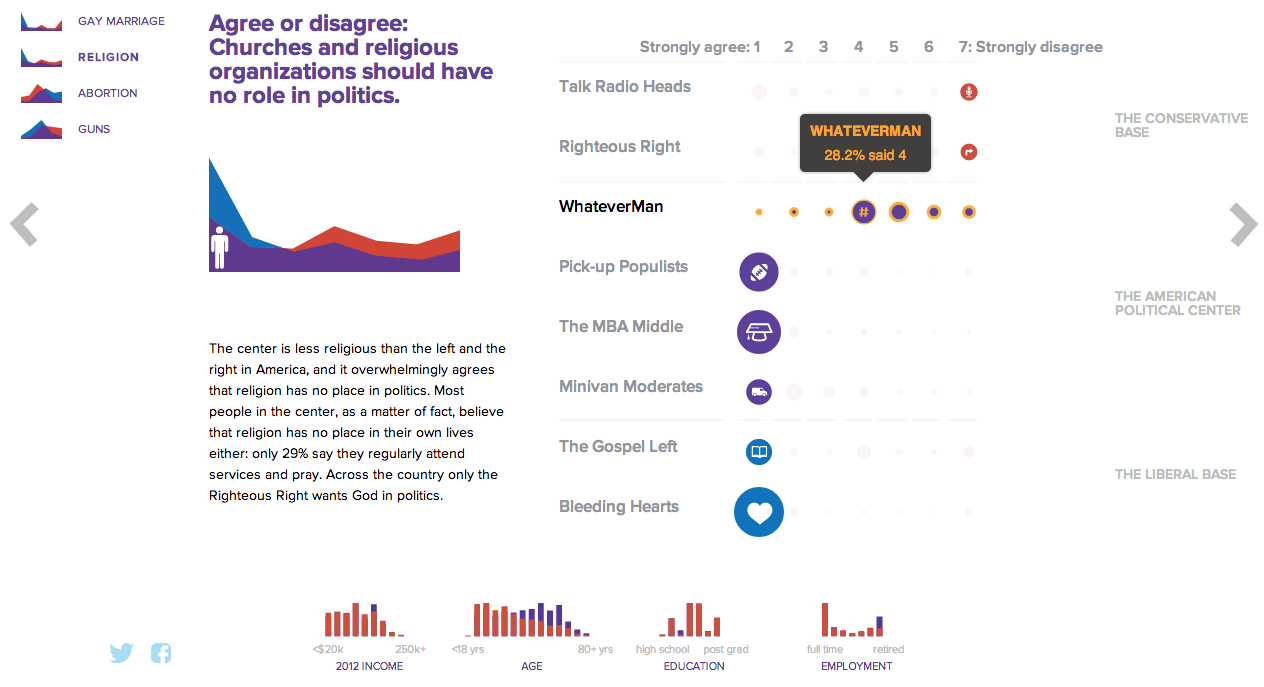
NBC News and Esquire magazine published results from their August survey of some 2000+ respondents that attempted to define the New American Center, i.e. the political persuasions of the majority of the country excepting the radical right and the loony left. For the purposes of Coffee Spoons, I am most interested in looking at the data visualisation and the infographics that result.
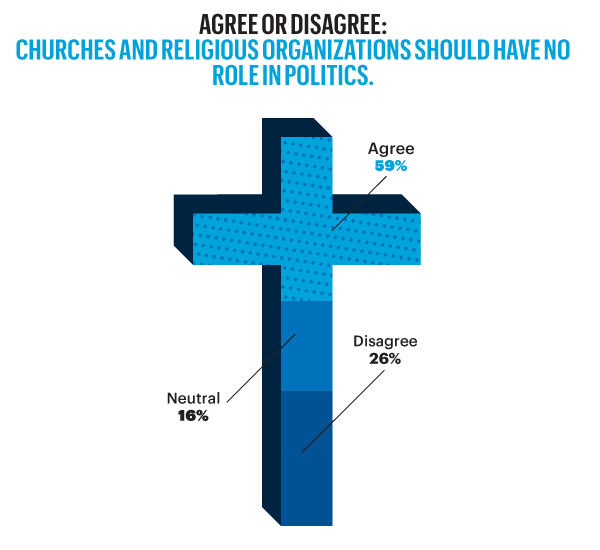
Both NBC News and Esquire visualised the results. While I could write two long blog posts looking at both of them, for today, it is more important to look more at the fundamental design difference between the two.
NBC News opted for a design direction emphasising data first. Perhaps because NBC is a news platform, their focus was on the clean communication of the data. Looking

On the other hand, Esquire opted for a more sensationalised direction. The same data points used for the screenshot above creates this graphic below. Not only is less data is contained, less context given, less subtlety and nuance captured, it also is just difficult to read. Is the 59% supposed to be the area of the cross filled in? Its length? Why is it three-dimensional? Where are the Snowdens of yesteryear? At first glance, I ignore the horizontal wings and focus solely on the vertical length of the main bar.

For a useful representation of data, I think NBC News clearly wins. But that both organisations used the same data to craft their separate results, this story on the New American Center is useful for comparing two different design directions and the results thereof.
No designers are specifically mentioned, at least not that I could find, so credit for each piece goes to its respective owner, i.e. NBC News or Esquire.
