Pie Charts v Bar Charts, Round…Some Really High Number

Not strictly a commentary on a piece or project, instead, this is a link to an interesting opinion piece about the Great Infographic Debate, i.e., most loosely and least helpfully, substance vs. style, vis-a-vis the use of pie charts and such vs. bar charts. Where does one draw the line between clear communication and, frankly, just getting somebody’s attention so that one can communicate?

From the article, an illustration of just how bar charts are significantly better than pie charts at clearly communicating data such as which is the largest data point.
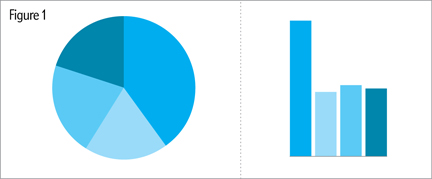
The largest datapoint is obvious, but what about the order of those that follow?

Thanks to Ben for the heads up.

Charging the Flux Capacitor: No Lightning Required.

My co-worker, Ben, who is far more knowledgable about cars than myself, brought the following to my attention.

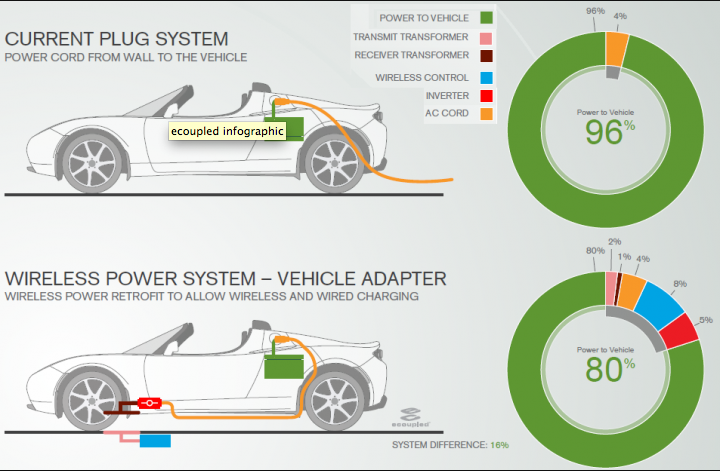
At the Consumer Electronics Show we always get to see the latest in cool, new, must-have toys. This year, however, a company called Fulton Innovations displayed a proof-of-concept, wireless charging-station for electric vehicles. And while one must wonder about the conservation and inefficiencies of such a powering station, Fulton provided information on just how efficient their system would be. In the form of graphics.

Car Charger Graphics

And by and large, they are not bad. Yes, yes, the pie charts could be substituted for something else. But, I do like linking the colours in the pie chart to the parts in the power-system located in the diagram of the car. They help to explain just where exactly the inefficiencies in the system are to be found. And by providing the base of the plugged-in car, they also allow one to compare the two methods of wireless charging to that of plugging the vehicle in.

May I Have Pepperoni on That Pie (Chart)?

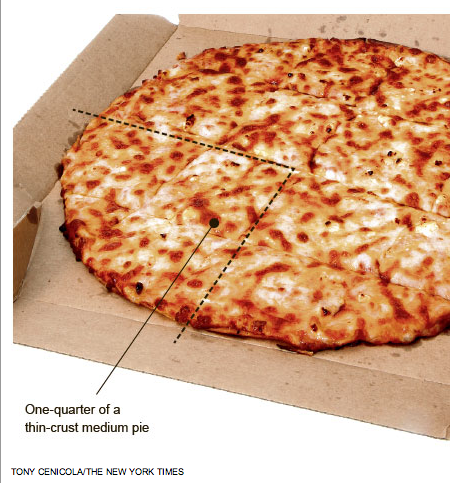
I love pizza. I think most people do too, though, we can all disagree on whether thin crust or thick crust is better. Yet as someone who has now eaten both…well…I shall not wade into the matter. But, I will toss up this piece from the New York Times.

a Pizza Pie Chart
a Pizza Pie Chart

The paper has an article about Domino’s adding more cheese to their pizza to increase sales as part of a plan from a US government-supported agency. At the same time, the US government is also trying to reduce the amount of saturated fats consumed to reduce obesity. And of course cheese contains saturated fat.

Naturally, the supporting graphic should make use of pizza. And in what better form than as a pie chart.

Though having now been looking at this for quite some time, I am in the mood for pizza. Though I could do without the saturated fat…