How Accurate Is Punxsutawney Phil?

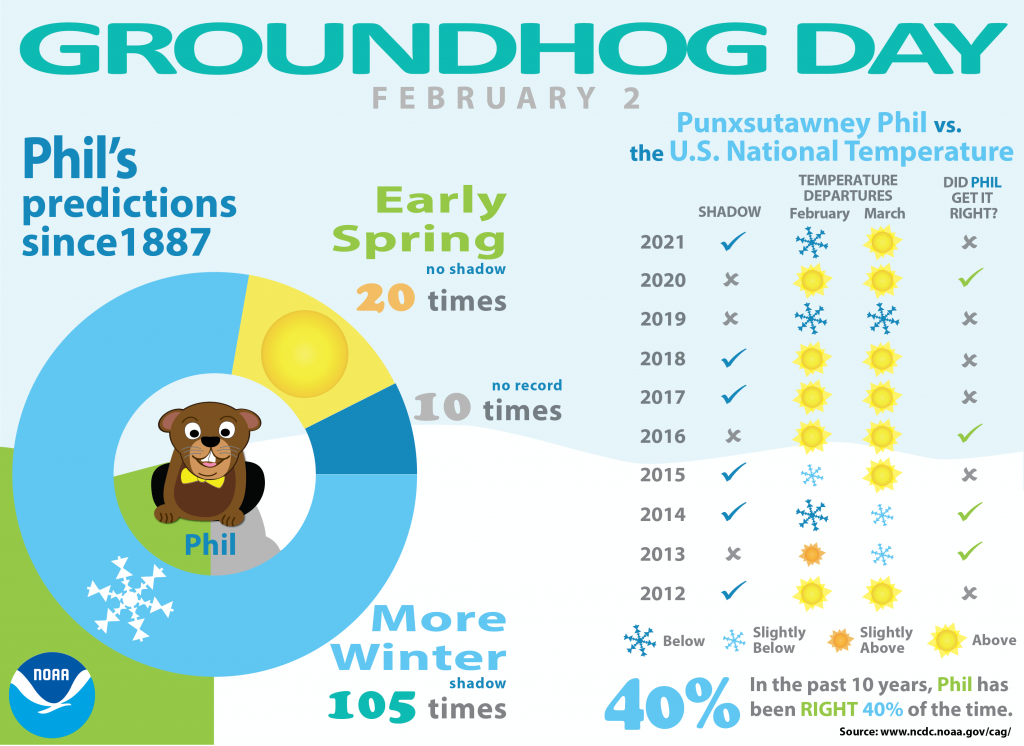
For those unfamiliar with Groundhog Day—the event, not the film, because as it happens your author has never seen the film—since 1887 in the town of Punxsutawney, Pennsylvania (60 miles east-northeast of Pittsburgh) a groundhog named Phil has risen from his slumber, climbed out of his burrow, and went to see if he could see his shadow. Phil prognosticates upon the continuance of winter—whether we receive six more weeks of winter or an early spring—based upon the appearance of his shadow.

But as any meteorological fan will tell you, a groundhog’s shadow does not exactly compete with the latest computer modelling running on servers and supercomputers. And so we are left with the all important question: how accurate is Phil?

Thankfully the National Oceanic and Atmospheric Administration (NOAA) published an article several years ago that they continue to update. And their latest update includes 2021 data.
Not exactly an accurate depiction of Phil.

I am loathe to be super critical of this piece, because, again, relying upon a groundhog for long-term weather forecasting is…for the birds (the best I could do). But critiques of information design is largely what this blog is for.

Conceptually, dividing up the piece between a long-term, i.e. since 1887, and a shorter-term, i.e. since 2012, makes sense. The long-term focuses more on how Phil split out his forecasts—clearly Phil likes winter. I dislike the use of the dark blue here for the years for which we have no forecast data. I would have opted for a neutral colour, say grey, or something that is visibly less impactful than the two light colours (blue and yellow) that represent winter and spring.

Whilst I don’t love the icons used in the pie chart, they do make sense because the designers repeat them within the table. If they’re selling the icon use, I’ll buy it. That said, I wonder if using those icons more purposefully could have been more impactful? What would have happened if they had used a timeline and each year was represented by an icon of a snowflake or a sun? What about if we simply had icons grouped in blocks of ten or twenty?

The table I actually enjoy. I would tweak some of the design elements, for example the green check marks almost fade into the light blue sky. A darker green would have worked well there. But, conceptually this makes a lot of sense. Run each prognostication and compare it with temperature deviation for February and March (as a proxy for “winter” or “spring”) and then assess whether Phil was correct.

I would like to know more about what a slightly above or below measurement means compared to above or below. And I would like to know more about the impact of climate change upon these measurements. For example, was Phil’s accuracy higher in the first half of the 20th century? The end of the 19th?

Finally, the overall article makes a point about how difficult it would be for a single groundhog in western Pennsylvania to determine weather for the entire United States let alone its various regions. But what about Pennsylvania? Northern Appalachia? I would be curious about a more regionally-specific analysis of Phil’s prognostication prowess.

Credit for the piece goes to the NOAA graphics department.

Lead Pie

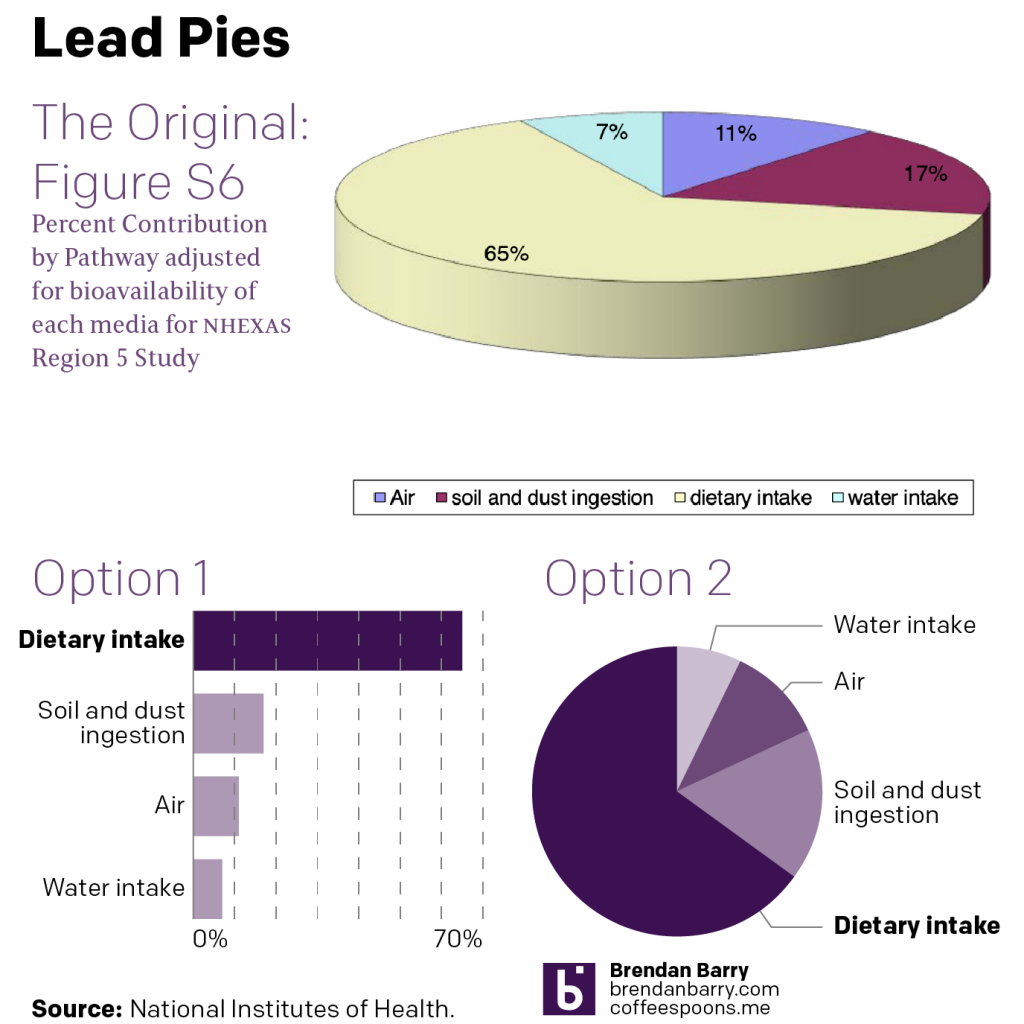
This past weekend, I read an article in Politico discussing parents’ outrage over levels of lead and other toxic metals in baby food. The story focuses on a Congressional report into the matter, but that ties back into an EPA study from 2017 that investigated lead contamination. Specifically the article’s author notes “a chart that was buried in supplemental material”. Buried chart? Well I went off to investigate.

And I found all the charts. But I wanted to focus on one. I am not entirely clear what it means: Percent contribution by pathway adjusted for bioavailability of each media for NHEXAS Region 5 study. I get that it’s looking at channels of intake, but it’s unclear if this is lead or some other contaminant. Is this for all people? Or a sub-section of the population as other charts in that supplemental material pack are?

So I made a graphic where I compared the original to two alternate versions.

Now, the editorial focus of the article is on baby food, which is not the apparent focus of the study (unless it is couched in academic/technical terms). But what’s worth noting is that the pale yellow recedes into the background as the burgundy dominates the graphic.

If graphics are done well, they should show clear visual relationships, they do not need to label specific datapoints unless through a progressive disclosure of information. But if you are going to label everything, I would want to make certain that in the case of that same burgundy slice, we have sufficient contrast to read the 17% label.

Pie charts are not good at allowing people to compare slices. So the pie chart as the format here is not a great place to start, but as you can see in my Option 2, if you are going to choose a pie chart form, there are ways of making it more legible. Namely, do not make it three-dimensional.

Here the foreground receives prominence over the background, which may be receding and visually shrinking into the background. And as the point of a chart is to make visual comparisons, if we cannot compare like for like, it’s not ideal.

Also, we have the thickness of the pie chart. That vertical heights adds yellow to the slice of the pie we see in front. Casually, that makes the yellow slice appear even larger than it already is from the three-dimensional foreshortening.

Option 2 presents this as a stripped down pie chart. Make it flat. I used one colour with tints of one purple. I used the 100% to highlight the dietary intake channel, because of the Politico article’s focus.

But really, Option 1 is the improvement here. Comparing the smaller slices is easier here as the eye simply moves vertically down the graphic. We are also able to add axis lines that provide a context for where those values fall, between 0 and 10 for Water intake, and just over 10 for Air. Somewhere between 15 and 20 for Soil and dust ingestion.

Finally, that legend. We don’t want the reader to have to strain to identify what slice is what. Why is the legend in a box? Why is it so far away from the pie? In both my options I closely and visually link the labels to the slices/bars they represent. That makes it easier for the reader to know what they are looking at when they are looking at it.

The moral of the story, people, don’t use three-dimensional pie charts.

Credit for the original version goes to the EPA. Credit for the alternate versions is mine.

Or Just Don’t Be a Dick

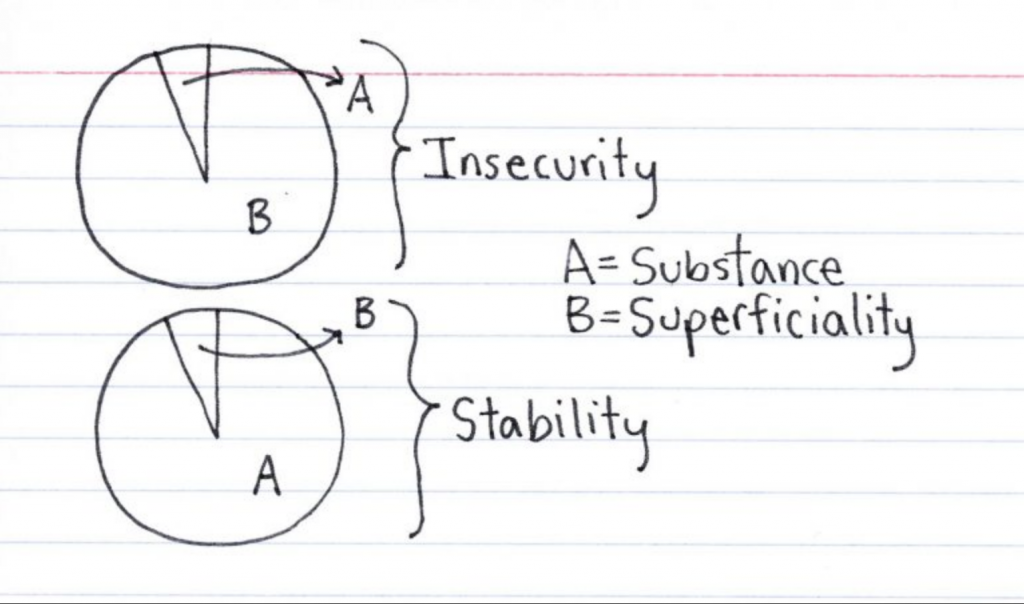
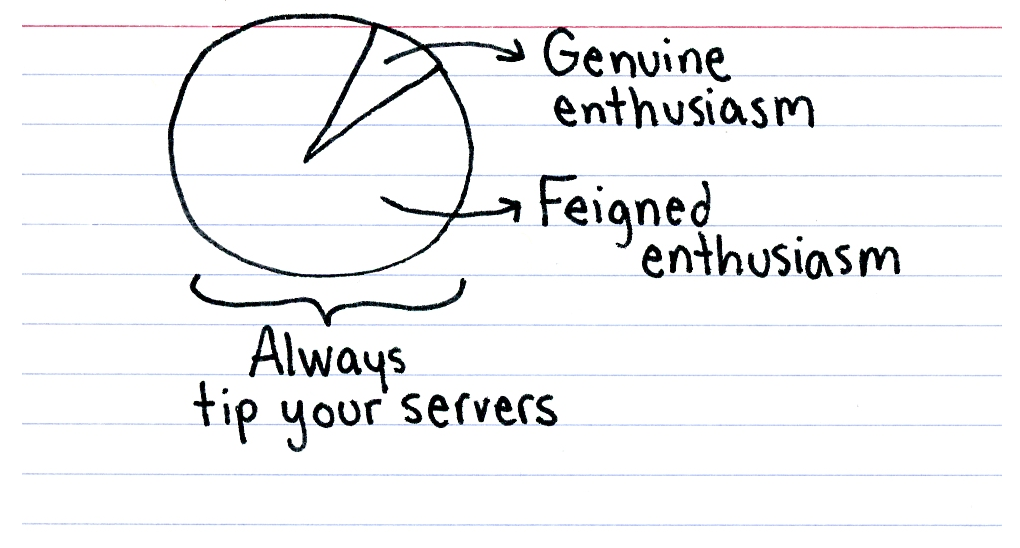
Long before I worked as a designer, I was a busboy. After that I was a dishwasher. After that I was a barista. Then I became a designer. This graphic from Indexed resonated with me, because, yeah, at a more basic level, don’t fuck with your servers.


Or, in simpler terms, don't be a dick…
Or, in simpler terms, don’t be a dick…

Credit for the piece goes to Jessica Hagy.

Disc Space

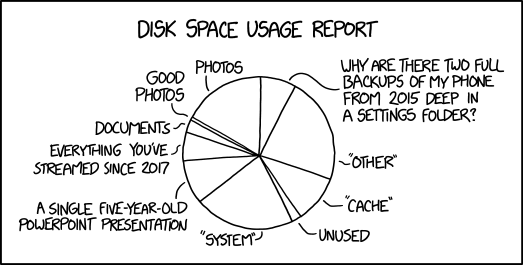
One of my current projects is consolidating and organising all my genealogy files spread across multiple devices and drives into one central location. So I’ve been spending quite a bit of time looking at file sizes and things. And that is why this piece from xkcd made me laugh.

So true.
So true.

Happy Friday, all.

Credit for the piece goes to Randall Munroe.

Pie Charts

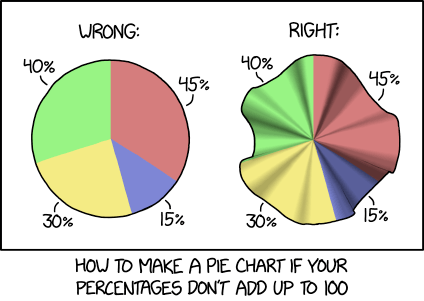
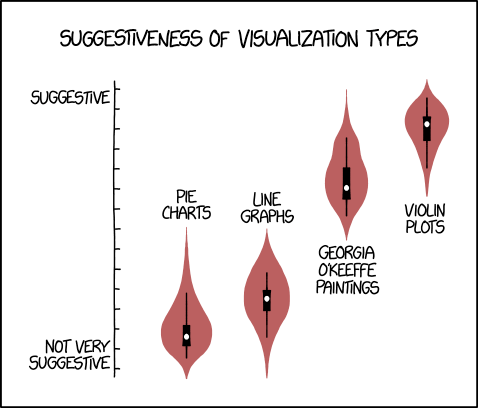
Today is my Friday, everyone, as I am going away on holiday for a little bit. (You can expect me back mid-next week.) So, enjoy this design tip from xkcd on my favourite form of data visualisation: the pie chart.

Pie charts are always 100% the wrong choice

Credit for the piece goes to Randall Munroe.

A Throwback to Prior Kenyan Elections

Kenya presently waits for the results of its presidential election, one that pitted incumbent Uhuru Kenyatta against Raila Odinga, a many ran but never won candidate. Now, if you will indulge me, the Kenyan elections have interested me since December 2007, which if you recall provoked sectarian violence to break out across the country.

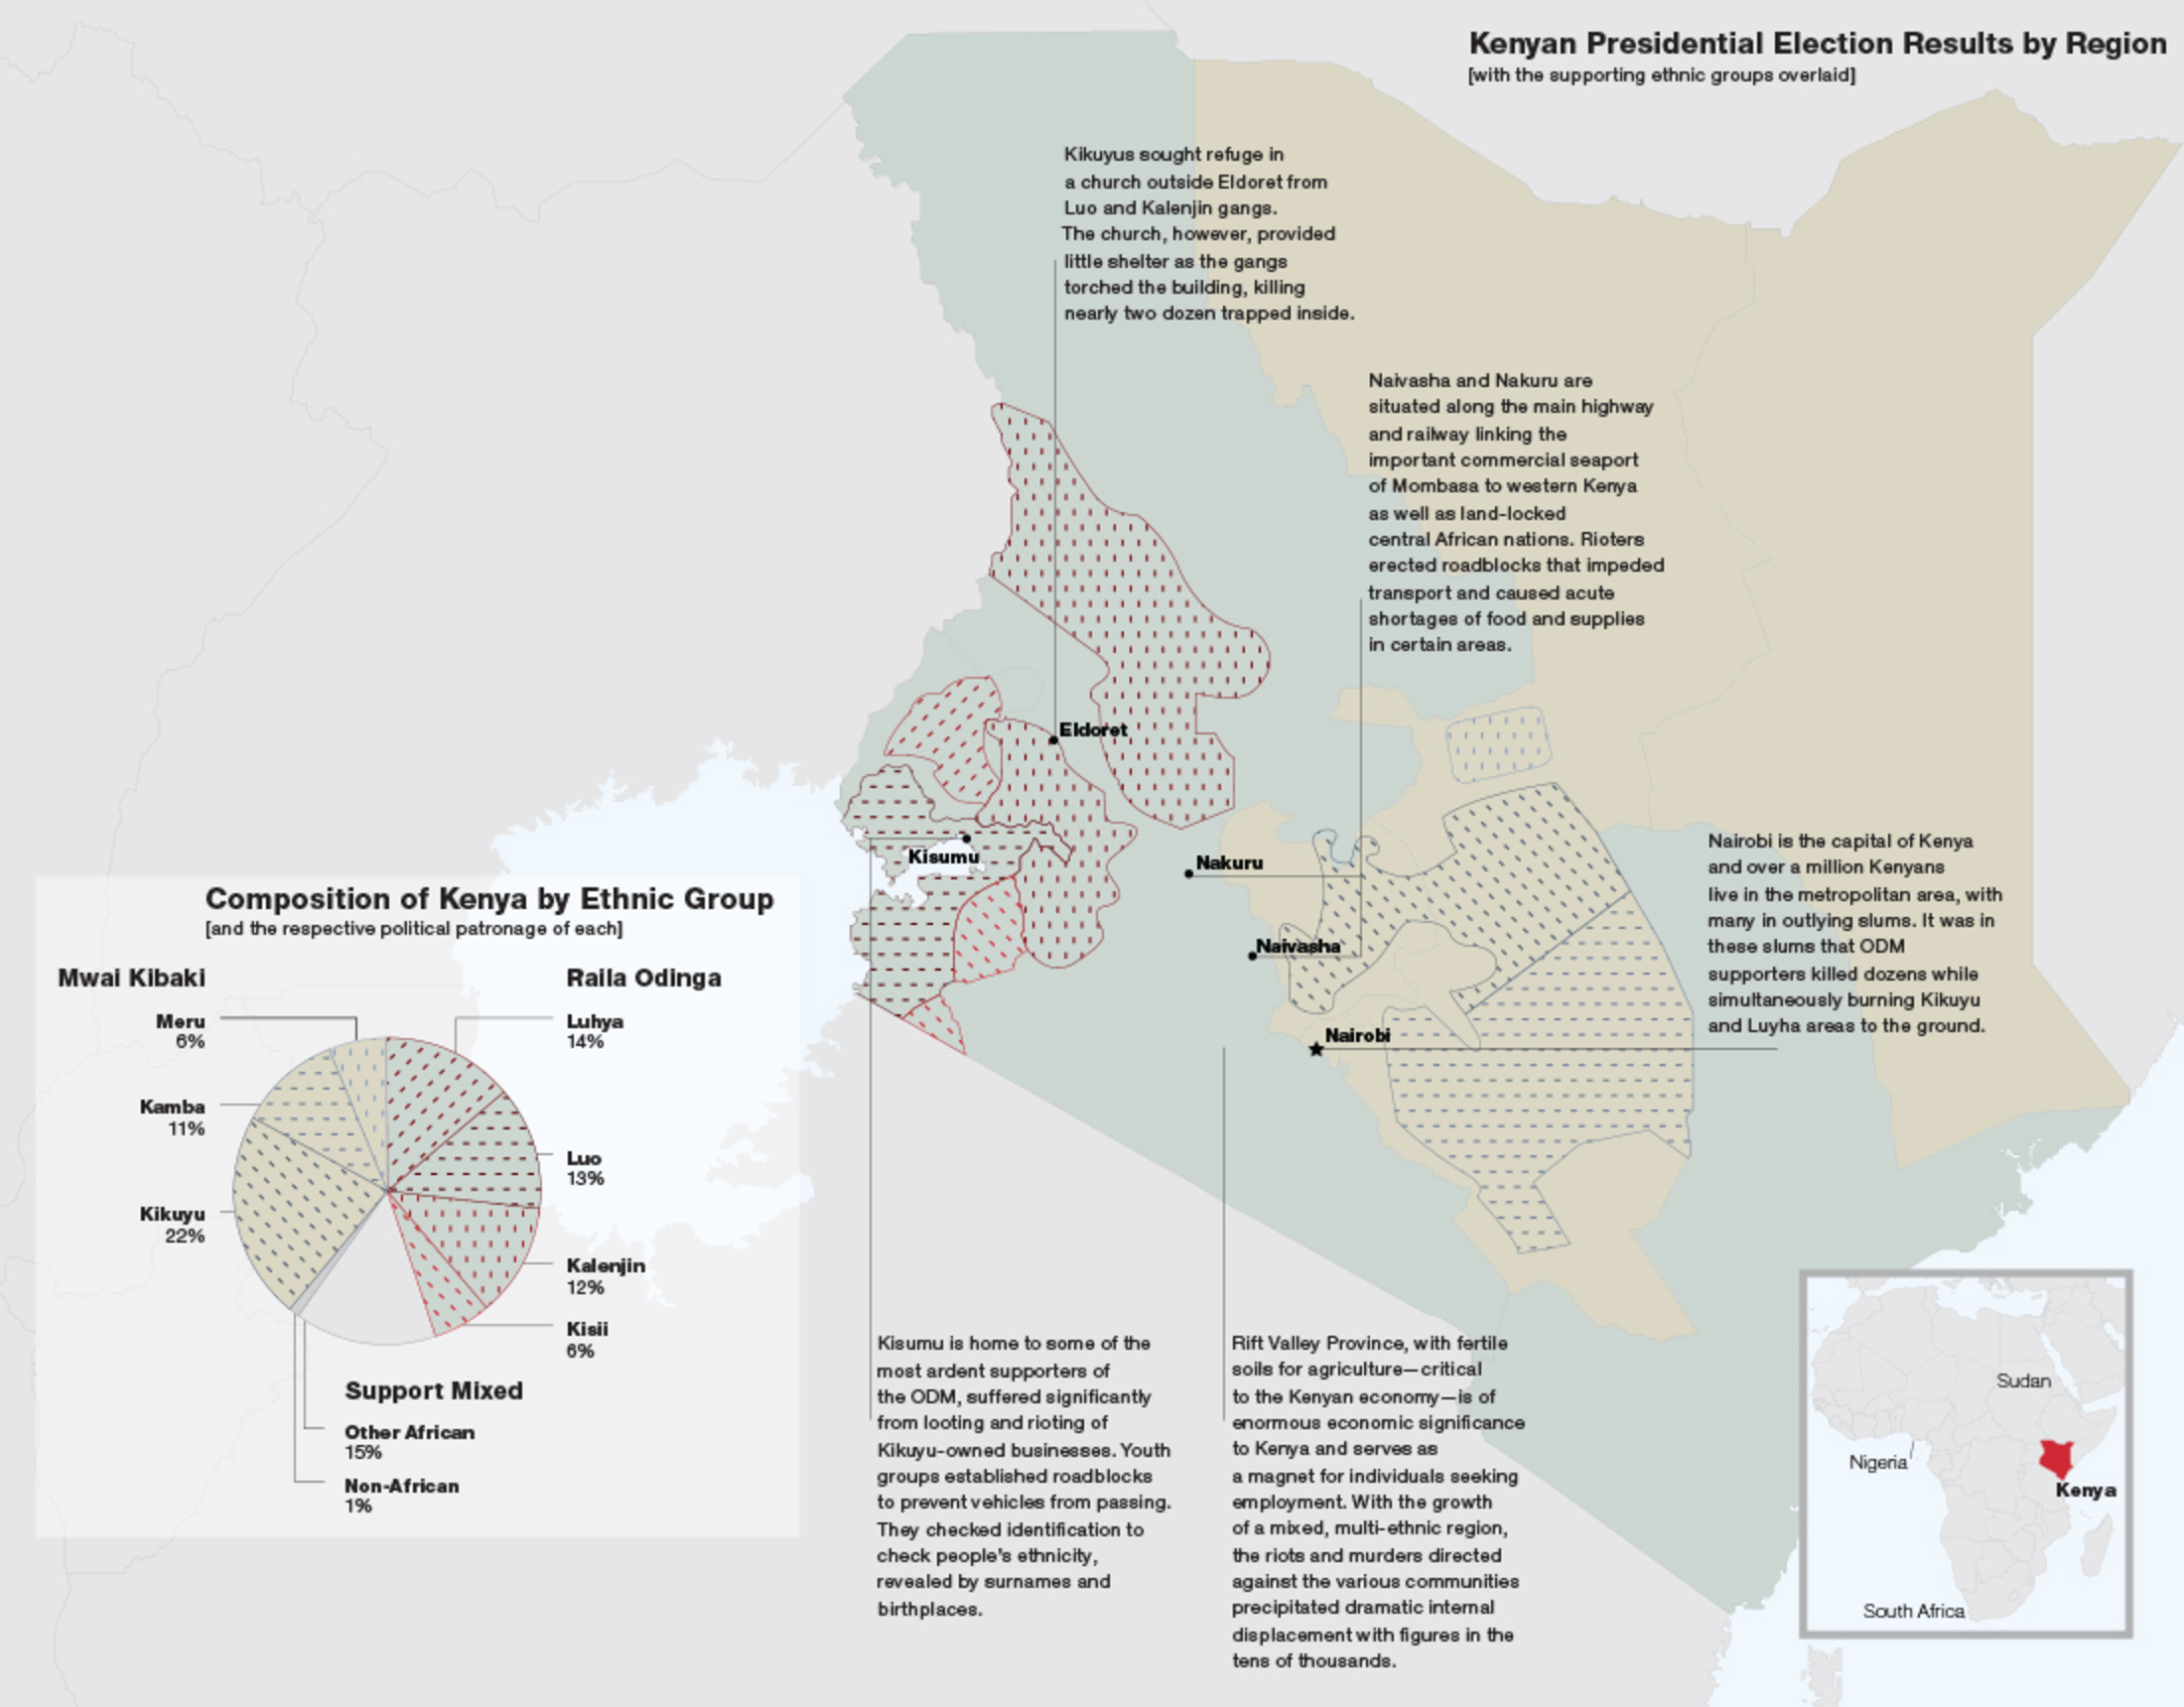
At the time I had just started working at my undergraduate thesis, a book using Fareed Zakaria’s Future of Freedom as the text (with a parallel narrative from Chinua Achebe’s Things Fall Apart) and I wanted to use specific case studies and data to add to the point of the book. Kenya with its election result data and horrific outcome allowed me to do just that. I juxtaposed awful images of that violence with quiet text and a full-page graphic of the results. I still find it one of the stronger spreads in the book, but as we await the results in Kenya, I am hoping that a ten-year anniversary piece will not be required.

The page of data visualisation

And yes, I have learned a lot since 2007. Including my deep-seated antipathy for pie charts.

Credit for the piece goes to a much less knowledgable me.

Traffic Accidents in Philadelphia

I’m working on a set of stories and in the course of that research I came across this article from Philly.com exploring traffic accident in Philadelphia.

Lots of red there…
Lots of red there…

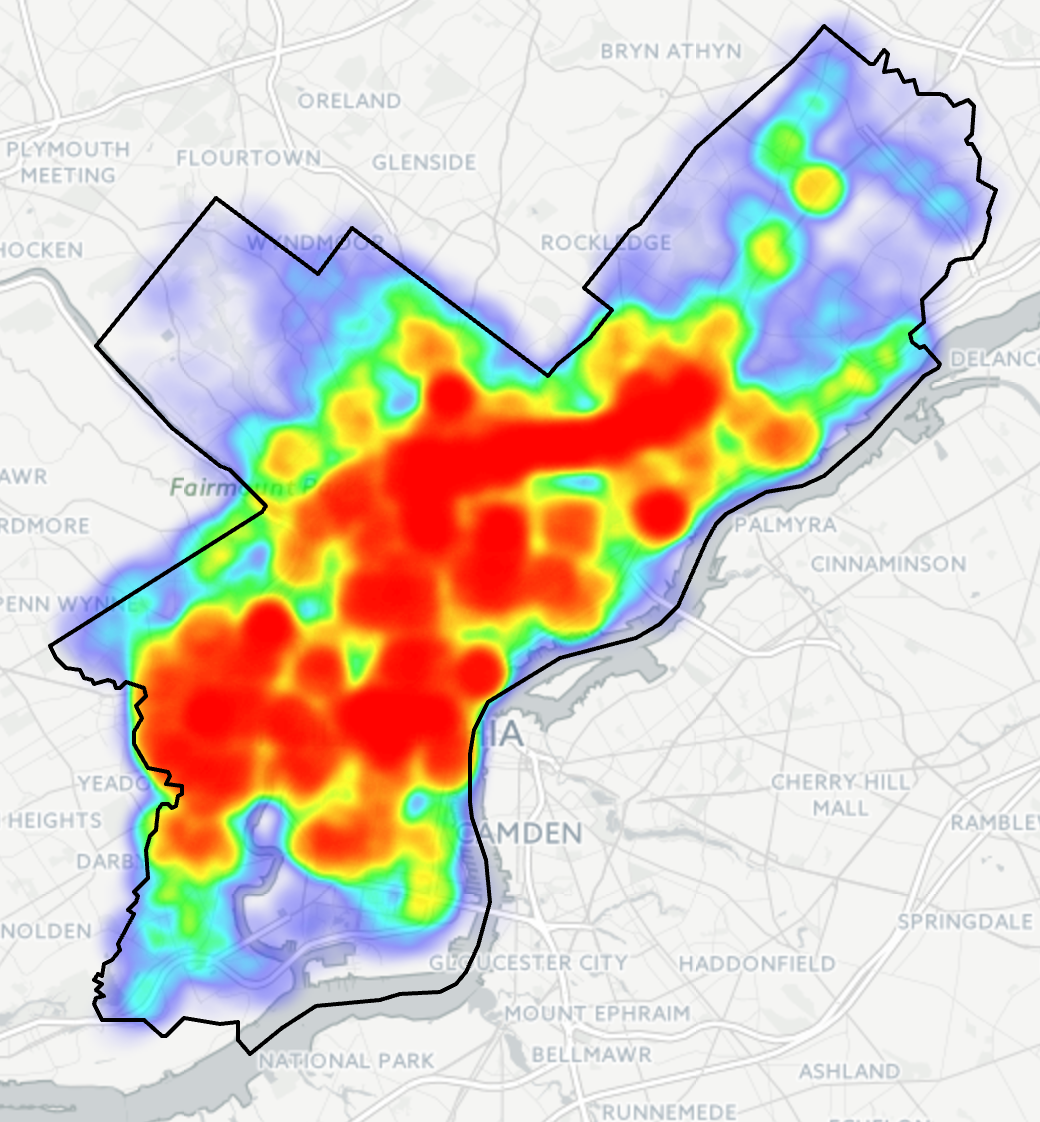
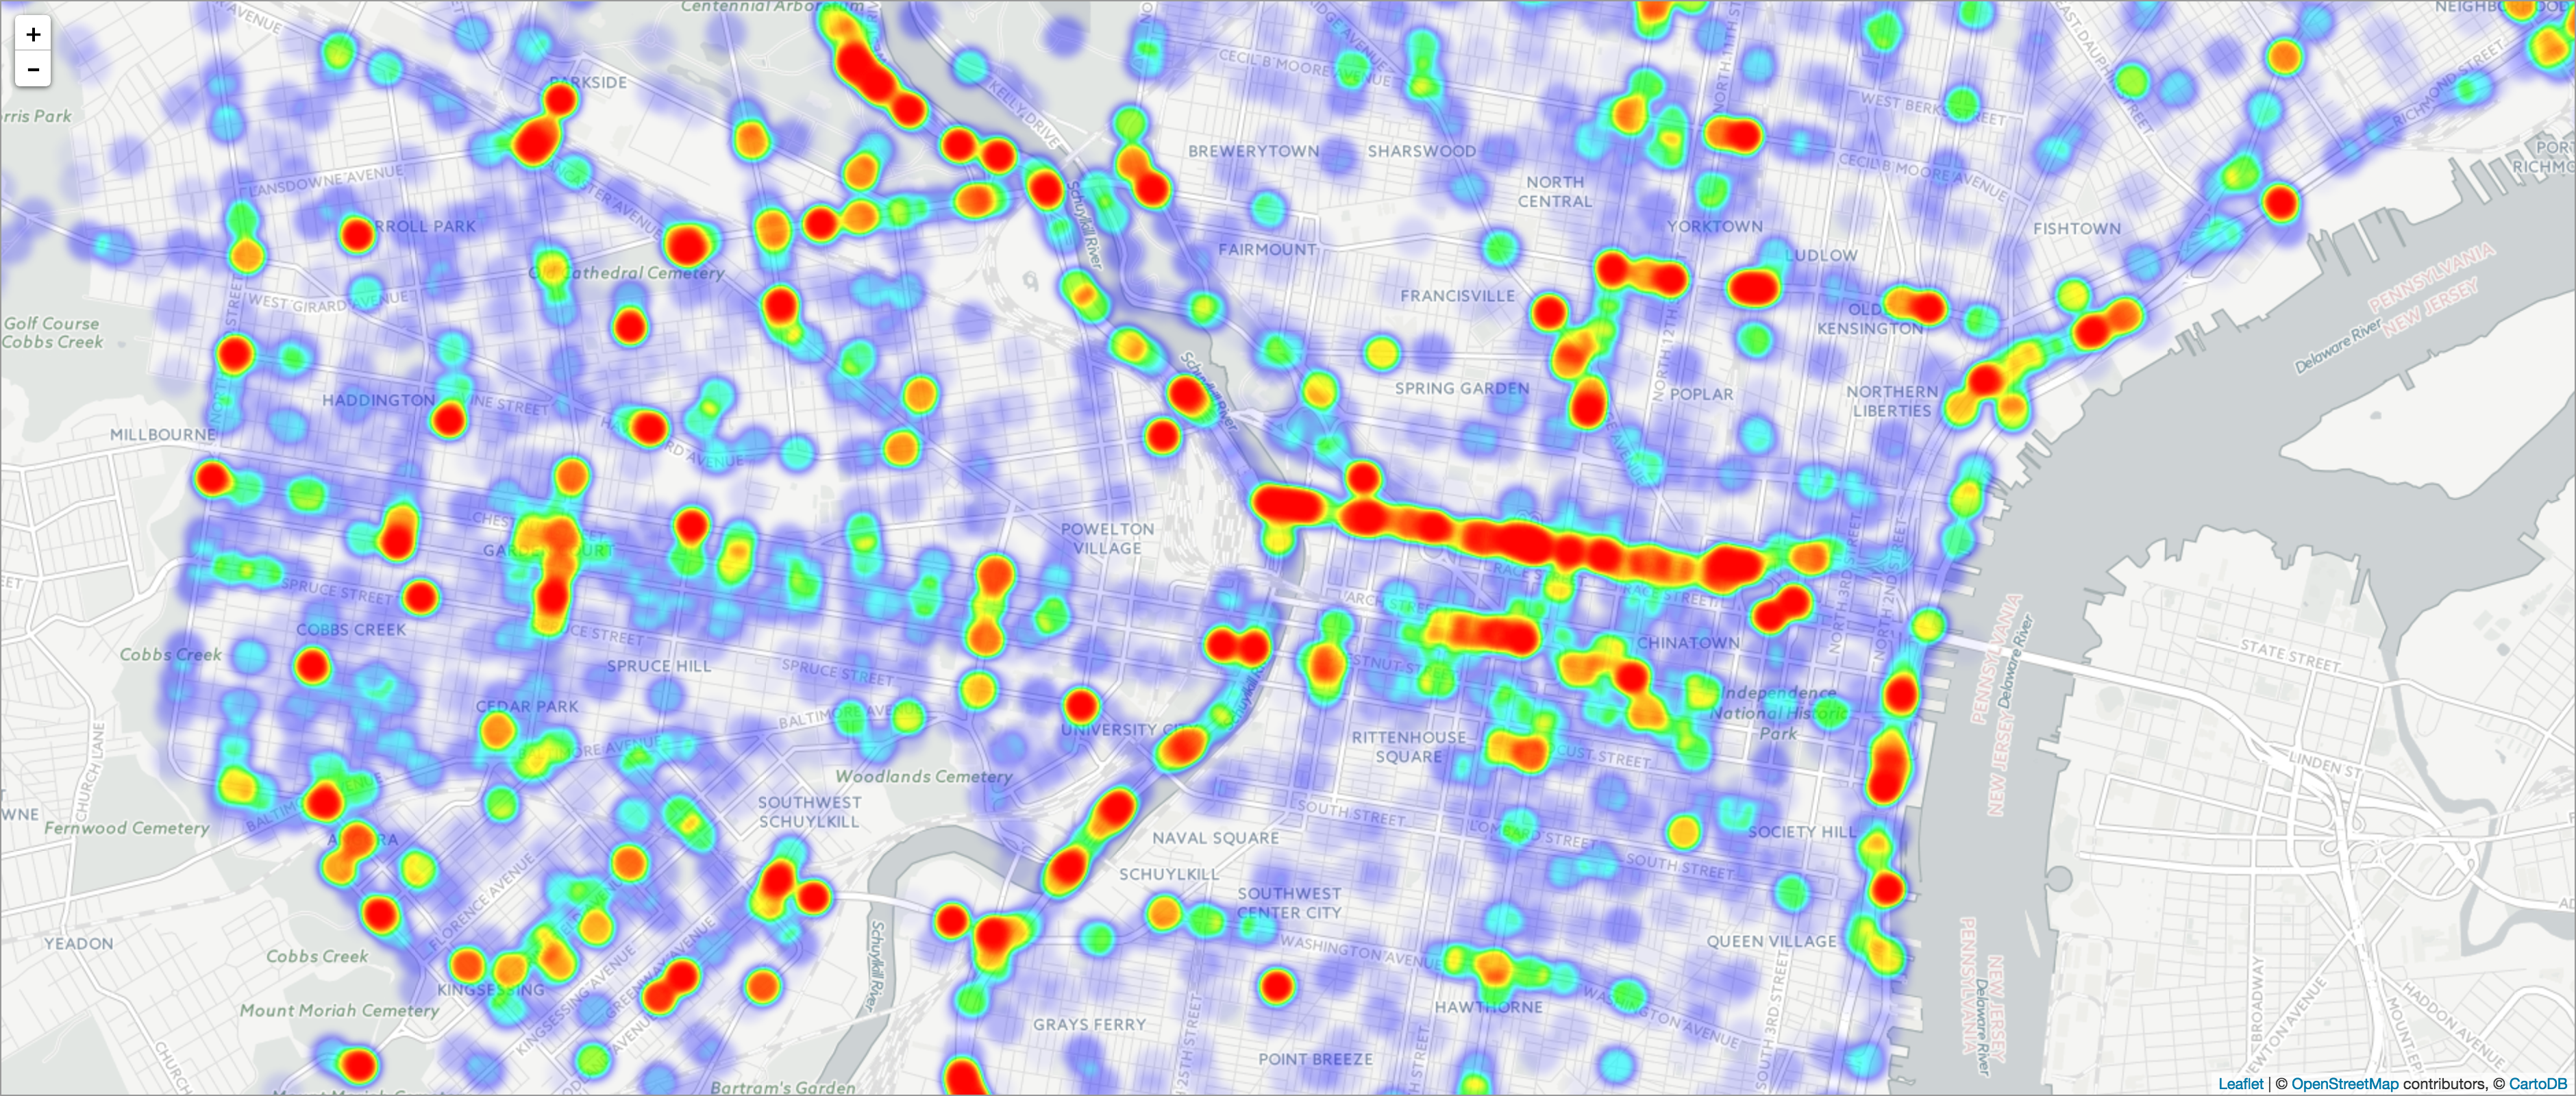
The big draw for the piece is the heat map for Philadelphia. Of course at this scale the map is pretty much meaningless. Consequently you need to zoom in for any significant insights. This view is of the downtown part of the city and the western neighbourhoods.

A more granular view


As you can see there are obvious stretches of red. As a new resident of the city, I can tell you that you can connect the dots along a few key routes: I-76, I-676, and I-95. That and a few arterial streets.

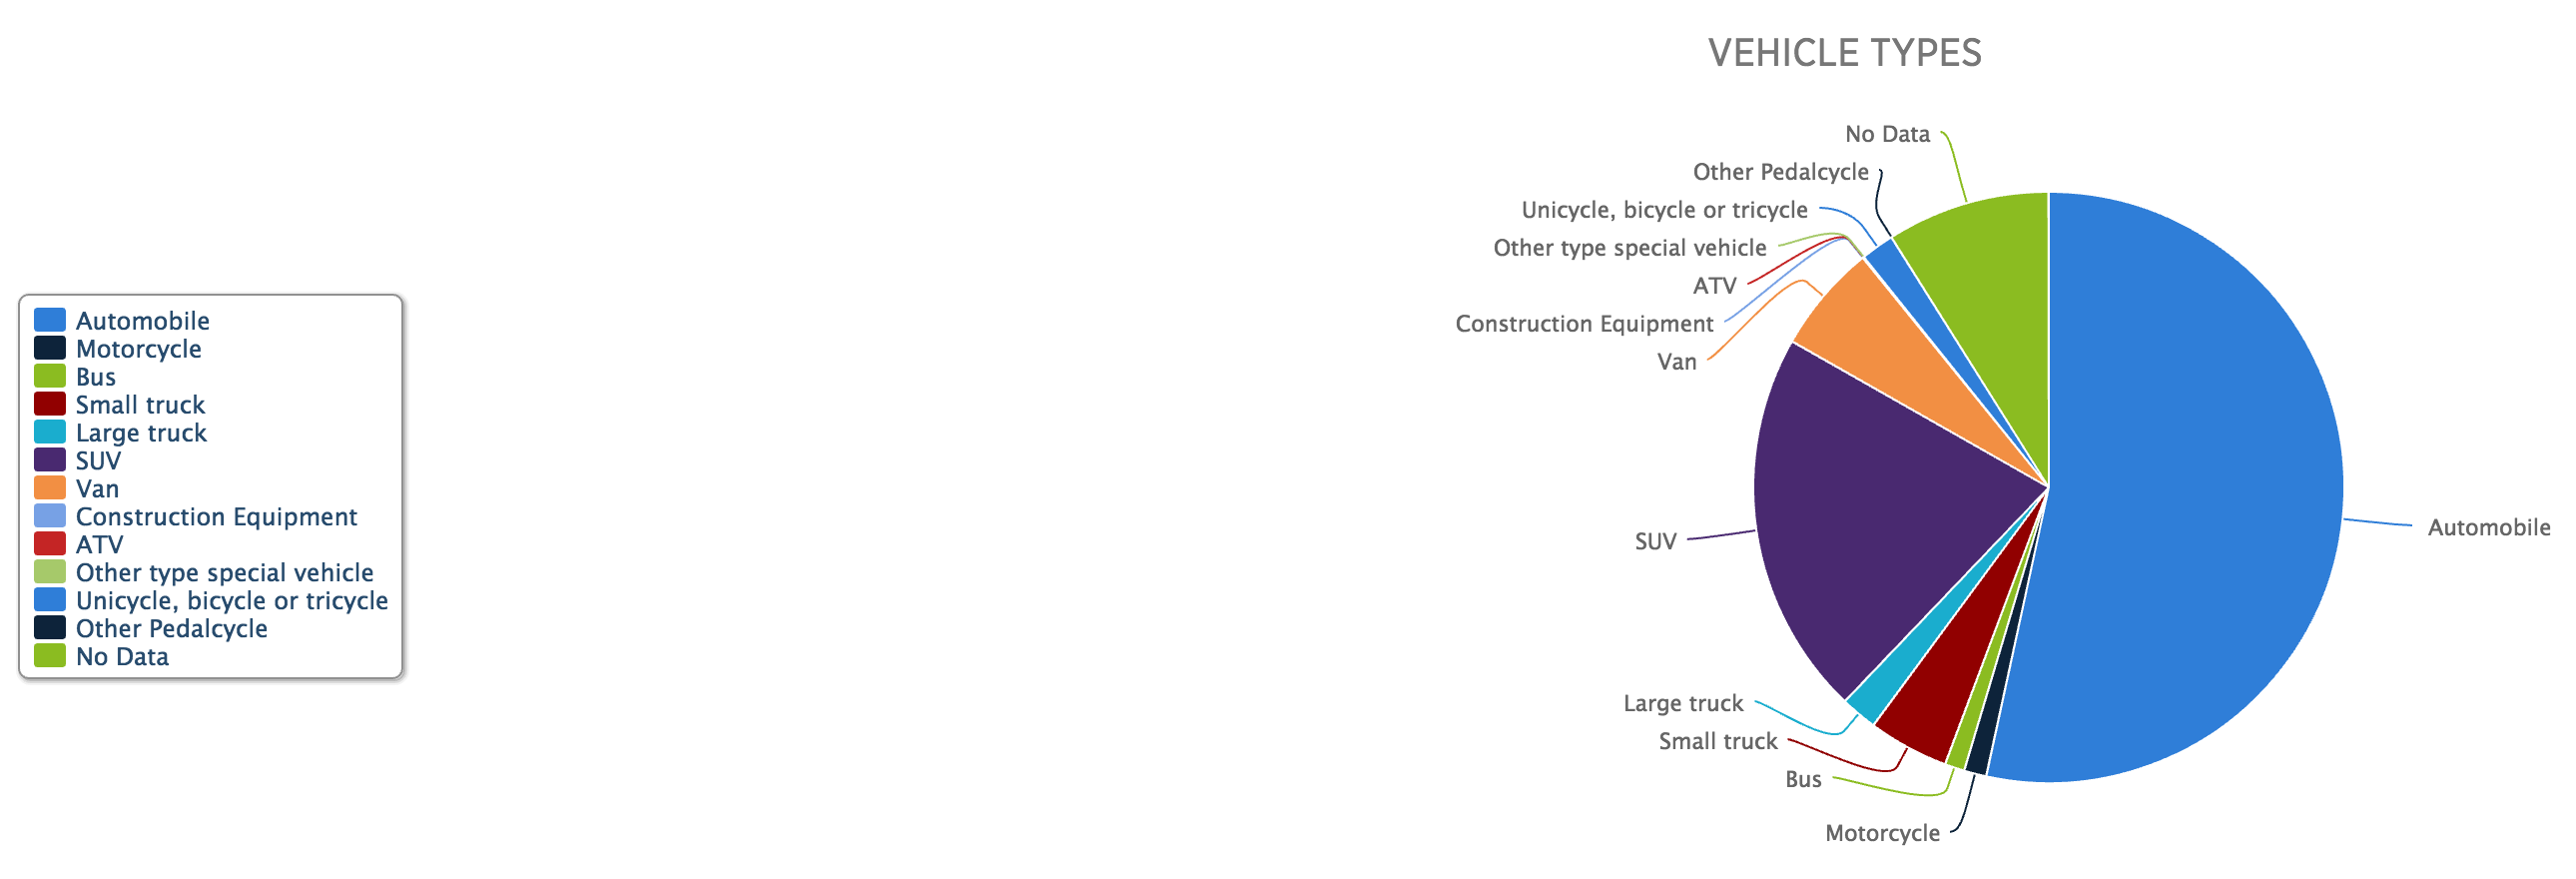
Now while I do not love the colour palette, the form of the visualisation works. The same cannot be said for other parts of the piece. Yes, there are too many factettes. But…pie charts.


This is the bad kind of pie

From a design standpoint, first is the layout. The legend needs to be closer to the actual chart. Two, well, we all know my dislike of pie charts, in particular those with lots of data points, which this piece has. But that gets me to point three. Note that there are so many pieces the pie chart loops round its palette and begins recycling colours. Automotives and unicycles are the same blue. Yep, unicycles. (Also bi- and tricycles, but c’mon, I just want to picture some an accident with a unicycle.)

If you are going to have so many data points in the pie chart, they should be encoded in different colours. Of course, with so many data points, it would be difficult to find so many distinguishable but also not garish colours. But when you get to that point, you might also be at the point where a pie chart is a bad form for the visualisation. If I had the time this morning I would create a quick bar chart to show how it would perform better, but I do not. Trust me, though, it would.

Credit for the piece goes to Michele Tranquilli.

The US Airline Industry

Yesterday Oscar Munoz, the CEO of United Airlines, testified to Congress about the airline industry. All of this just a few weeks after such a great week of press coverage. Of course, the last few weeks have also been a wee bit busy, so I was unable to post today’s piece. But with Munoz’s testimony it makes the perfect segue.

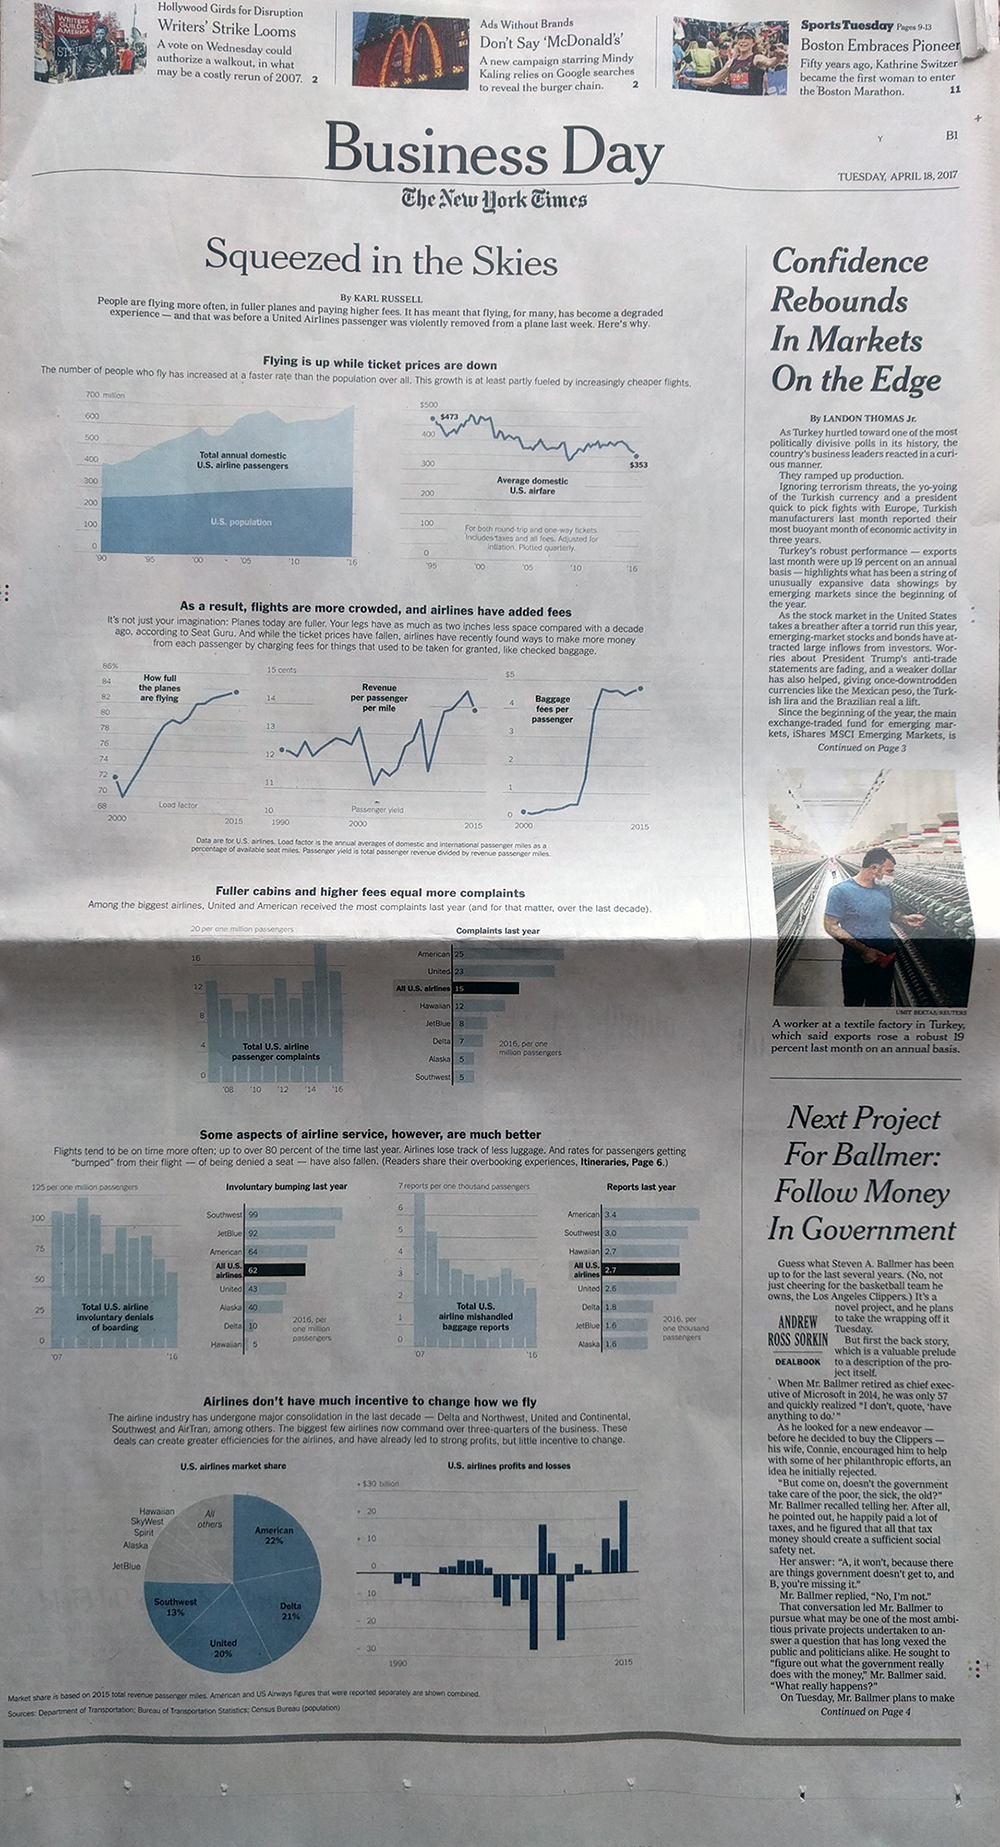
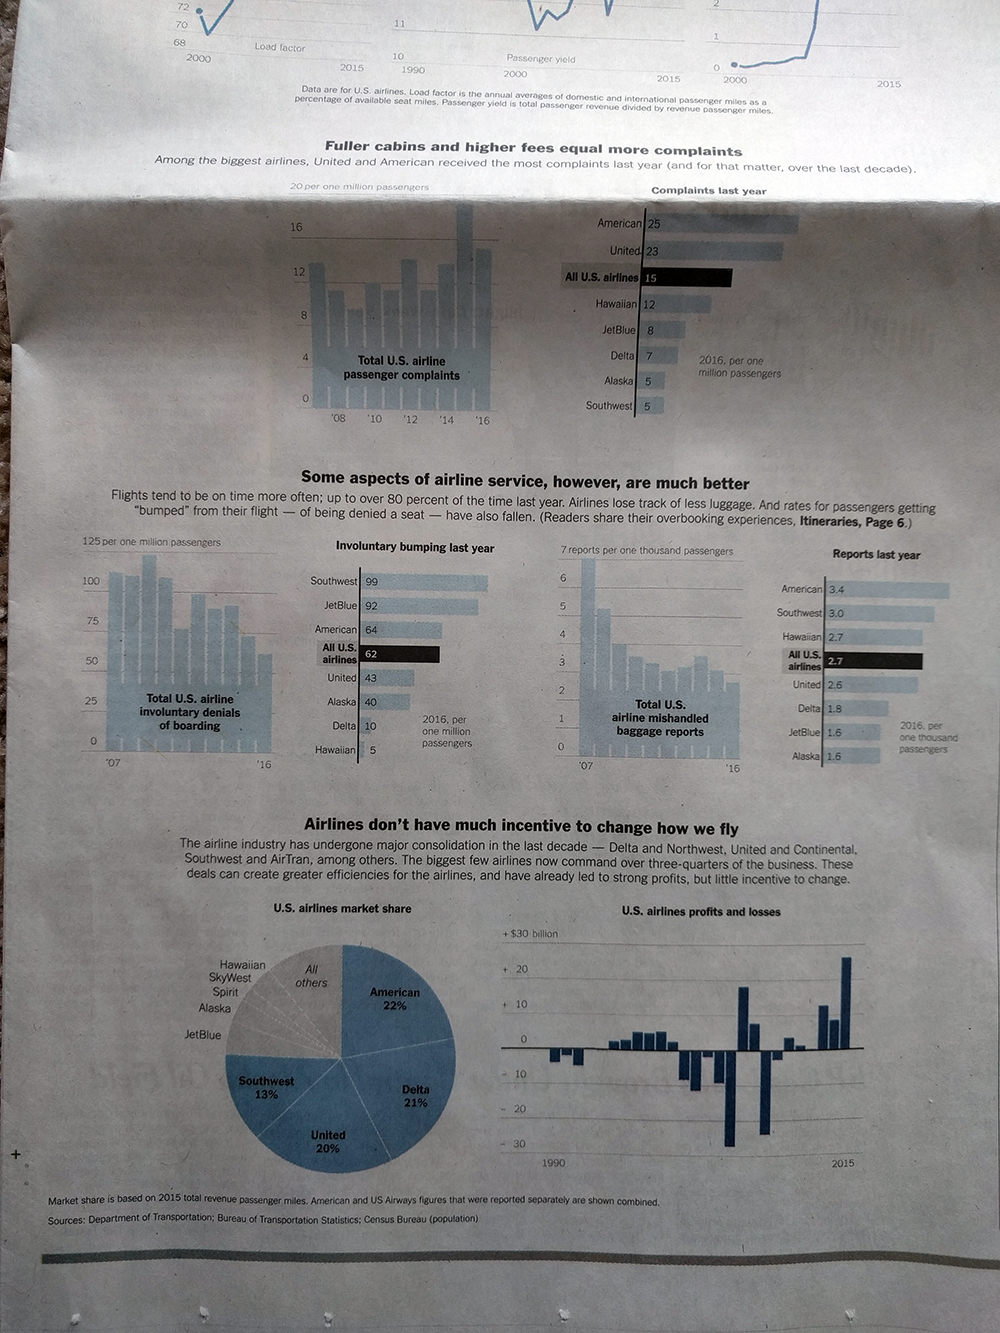
Today’s piece is a graphic article from the New York Times. It examines the state of the US airline industry. I use the term graphic article, because outside of headlines and subheads, it uses few words. Instead the point of the article is conveyed via charts. And what I found really nice is that, as the below photo shows, the article comprised most of the front page of the Business section.

The overall layout of the page

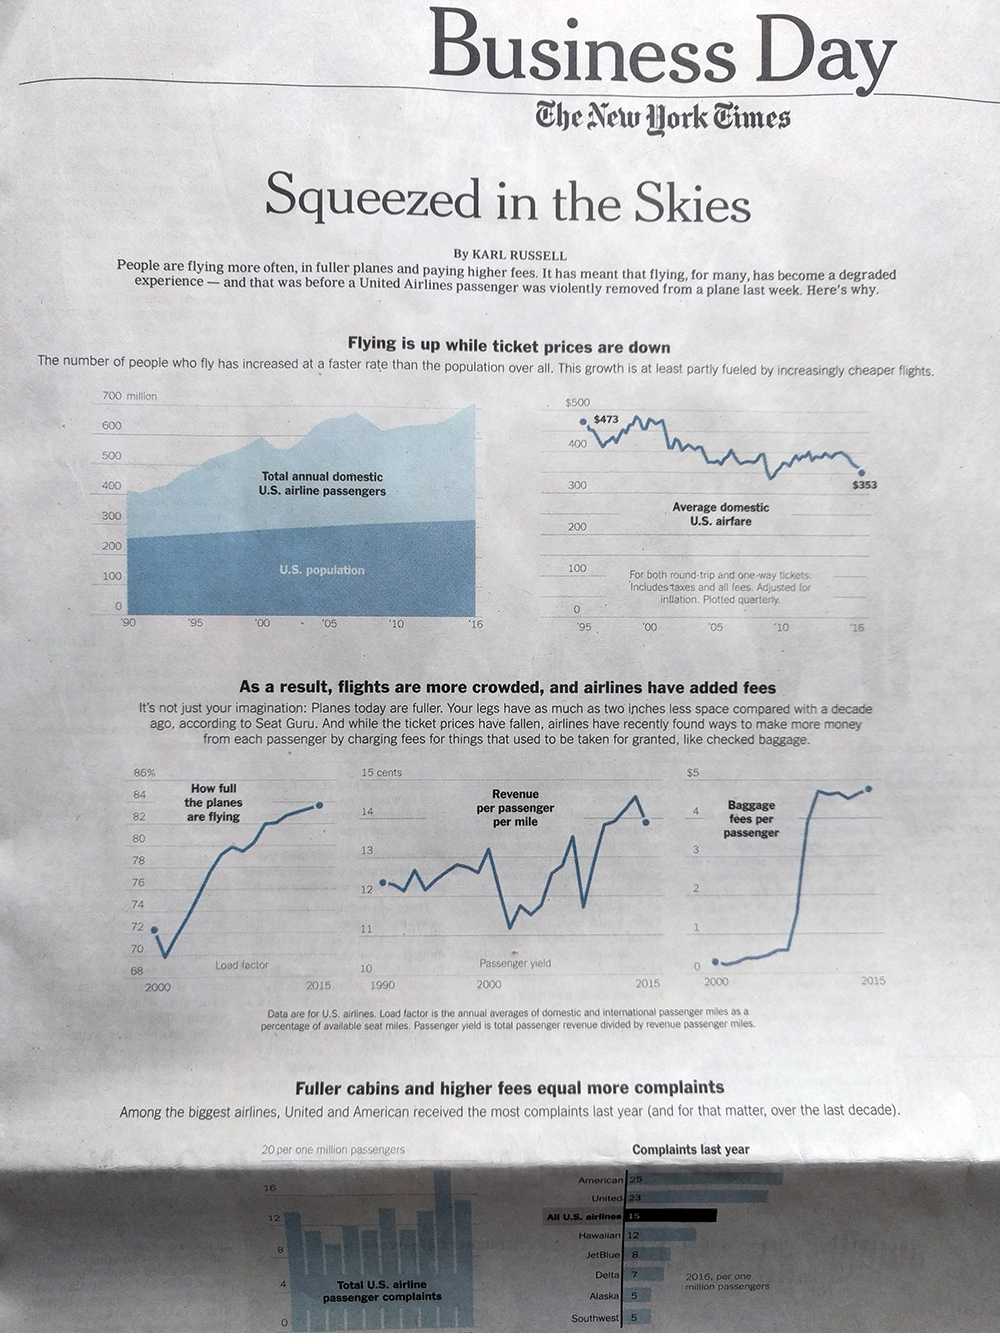
In terms of the structure, the piece did a nice job of giving breathing space around the various elements. This helps focus the reader’s attention on the charts and the data therein. Long headers and subheads break the vertical flow and create sentences or paragraphs that the charts prove.

The graphics above the fold

But then we get below the fold and low and behold we have a pie chart. I would have probably used a bar chart to show the market share. Especially with the top-three airlines so close. On the other hand, I can see the argument for the large, colour-filled visual. It does a nice job balancing the area charts at the opening and puts an emphatic period at the end of the piece.

And then below the fold

Overall, a solid piece and one that I am glad occupied a significant portion of the Business section front page.

Credit for the piece goes to Karl Russel.