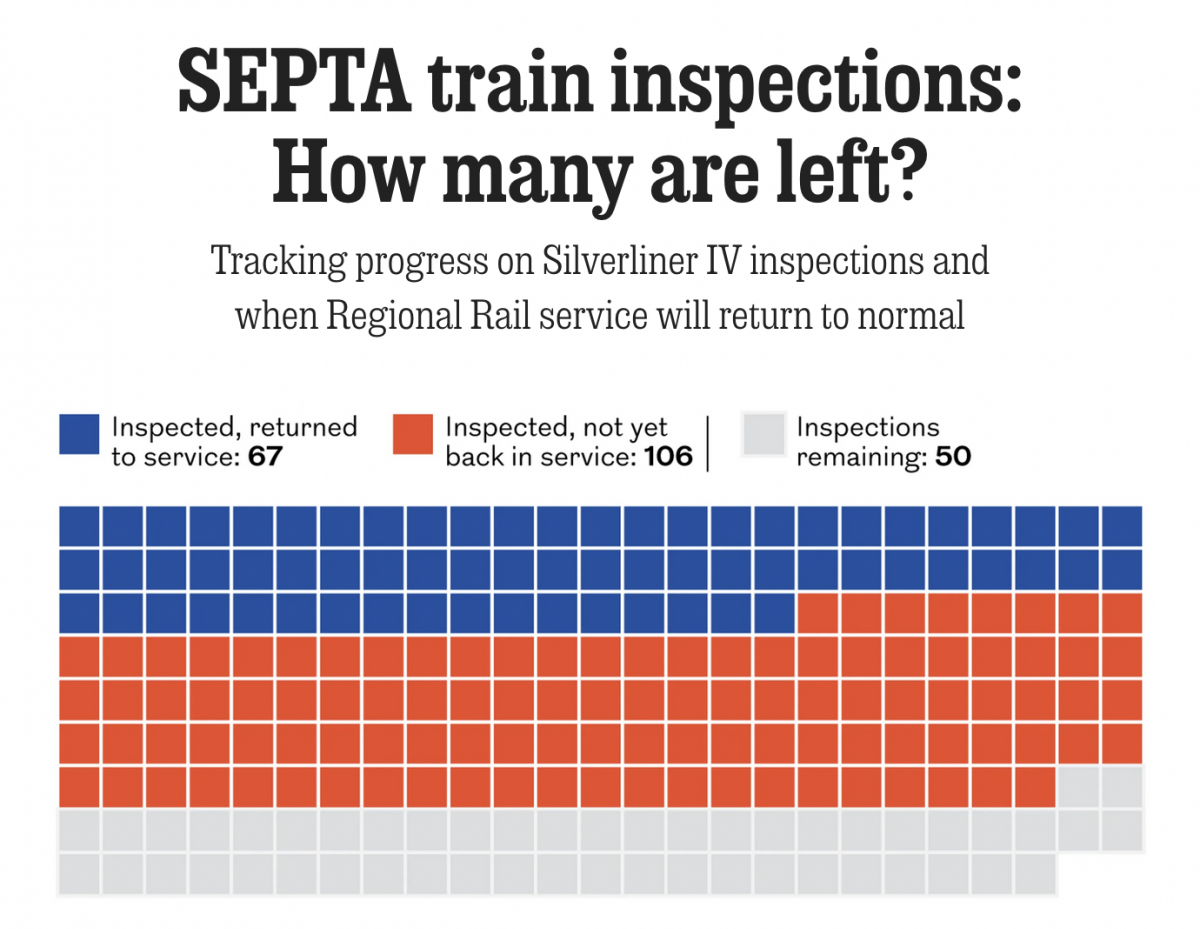
Tarnished Linings

Last month the National Transportation Safety Board (NTSB) ordered Philadelphia’s public transit system, SEPTA, to inspect the backbone of its commuter rail service, Regional Rail: all 225 Silverliner IV railcars. The Silverliner IV fleet, aged over 50 years, suffered a series of fires this summer and the NTSB investigators wanted them inspected by the end of October.

We are now into the second week of November and the job is not yet finished. Luckily, the NTSB extended the deadline to the middle of November—this Friday—and the Philadelphia Inquirer has quietly tracked the progress of the inspections with a series of graphics, the screenshot below being today’s. (The data being as of Friday, 7 November.)

I specifically took a screenshot from the top of the webpage, because I think this datagraphic series works particularly well. Directly beneath the article’s sub-head the reader sees the graphic answering the title’s question. The legend sits atop the graphic and incorporates the actual data labels for the specific number of cars in each category. This is instant gratification without the need for a superfluous file photo of a burned out railcar or commuter rail station. I have long advocated that data visualisation pieces can be the hero or headline image for articles and written works.

Does the legend need to incorporate the actual, specific number of railcars in that status? No, that bit is superfluous because graphics are meant to show, not tell, a visual story or pattern. If the precise number is required, a table suffices. (Or, in this case, three factettes in lieu of the graphic could do the trick.)

Colour-wise the designers opted to eschew the traditional green–red status board and the potential deficiencies for the colour-blind that such a pattern entails. Instead they used a blue–red pattern that not only works in the context of statuses but also calls to the brand colours of the transit agency.

Functionally, the datagraphic is static. And that is perfectly fine—not every online graphic needs to be interactive. Instead of, say, having a dropdown menu to select the data from whatever date the user wants, the article contains a series of posts of the static datagraphic of the day.

Overall, I really like this piece. I just wish we could have seen the inspections completed by the original deadline.

Credit for the piece goes to Erica Palan and Thomas Fitzgerald.


Fun fact no. 1: the datagraphic shows a total of 223 railcars instead of the 225 in the fleet. The editors did a good job calling attention to this and pointing out Septa had previously retired two railcars for unrelated aging issues.

Fun fact no. 2: the Commonwealth’s budget impasse of earlier this year saw Harrisburg moved nearly $400 million from Septa’s capital improvements fund to cover day-to-day operating costs with the vague “promise” the fund will be backfilled at a later date. That $400 million capital improvement fund would have been responsible for things like, say, replacing the Silverliner IVs with new railcars. So for those so inclined, you can blame Harrisburg Republicans for delaying the Silverliner IV’s replacement.


(I do have to say, seeing that gives me flashbacks to the days of posting all my COVID-19 status updates. I had not realised it at the time, but nearly two years of daily posts of deaths burned me out on the regular daily updates here.)

Bus Transit in Philadelphia

I have lived in Philadelphia for almost ten months now and that time can be split into two different residences. For the first, I took the El to and from Centre City. For the second, I walk to and from work. I look for living spaces near transit lines. In Chicago I took the El for eight years to get home. But to get to work, I often used the 143 express bus. Personally, I prefer trains and subways to busses—faster, dedicated right-of-way, Amtrak even has WiFi. But, busses are an integral part of a dense city’s transit network. You can cram dozens of people into one vehicle and remove several cars from the road. Here in Philadelphia, however, as the Inquirer reports, bus ridership is down over the last two years at the same time as ride-hailing apps are growing in usage.

For those interested in urban planning and transit, the article is well worth the read. But let’s look at one of the graphics for the article.

Lots of red in Centre City

The map uses narrow lines for bus routes and the designer wisely chose to alternate between only two shades of a colour: high and low values of either growth (green) or decline (red). But, and this is where it might be tricky given the map, I would probably dropdown all the greys in the map to be more of an even colour. And I would ditch the heavy black lines representing borders. They draw more attention and grab the eye first, well before the movement to the green and red lines.

And the piece did a good job with the Uber time wait map comparison as well. It uses the same colour pattern and map, small multiple style, and then you can see quite clearly the loss of the entire dark purple data bin. It is a simple, but very effective graphic. My favourite kind.

Still haven't used Uber yet. Unless you count the times I'm being put into one by a friend…
Still haven’t used Uber yet. Unless you count the times I’m being put into one by a friend…

Anyway, from the data side, I would be really curious to see the breakout for trolleys versus busses—yes, folks, Philly still has several trolley lines. If only because, by looking at the map, those routes seem to be in the green and growing category. So as I complain to everyone here in Philly, Philly, build more subways (and trolleys). But, as the article shows, don’t forget about the bus network either.

Credit for the piece goes to the Inquirer graphics department.

Septa’s Train and Trolley Service

Well, everyone, today you get two posts. The first and earlier (and planned) post is about polling in Pennsylvania. Relevant to those of you following the US election. But today’s post is about what trains are running in the city of Philadelphia.

If you haven’t heard, the city’s mass transit agency, SEPTA, and its primary union for workers within the city cannot come to an agreement on a contract. So…strike. And for those of you reading this from outside the Philly area, rest assured it’s just chaos right now. To put it into a wee bit of perspective, we have this graphic—actually an interactive map—of train routes in the city. And by train, Philadelphia has your standard suburban commuter heavy rail and subway lines and light rail lines, but we also make use of a number of trolley lines.

What's running and not
What’s running and not

What the map does not show are the city’s various bus routes, all of which that run within the city are suspended. There are bus routes and rail lines outside the city, most notably the commuter rail or the blue lines in the map, operated by a different union that is not on strike.

Credit for the piece goes to the Philly.com graphics department.

Septa’s Silverliner Service Shutdown

Two weeks ago Philadelphia regional rail commuters, a large group to which I belonged for a number of years, experienced a week from hell. On 2 July a yard inspector for Septa, the Philadelphia region’s transit agency, discovered a Silverliner V railcar tilting. For those not familiar with Septa, the Silverliner Vs have been in service for only three years and have been long touted as the future of the Philadelphia commuter rail service. After inspection Septa discovered the tilting railcar suffered from a fatigue crack on the equaliser beam, specifically where it was welded to connect to the wheel bearings. The beam forms part of the truck, which is what connects the railcar to the rails, and any failure at speed could have resulted in an accident, possibly a derailment. The transit agency then quickly inspected the remainder of its fleet of 120 Silverliner Vs. It found the same fatigue crack in a total of 115 cars. By 4 July, Septa pulled all 120 Silverliner Vs from service.

The equaliser beam connects the wheels to the passenger car

So what happened? At this point, we do not know. Septa continues tests to discover just what happened and just what can be done to repair the cars. Because, with a fleet of approximately 400 cars, the Silverliner Vs represent 1/3 of the fleet. And with fewer seats and fewer trains, commuters attempting to ride into the city, particularly from nearer-in suburbs, find trains bypassing stations because they quickly reach capacity.

The additional passenger railcars from other regional transit agencies will make little difference

Consequently, Septa has instituted a reduced service—a modification of the Saturday service—with additional service on subways and other high-speed lines. Additionally, Septa has agreed to lease additional trainsets, i.e. locomotives with passenger cars, from other regional transit agencies: Amtrak, New Jersey Transit (NJ Transit), and the Maryland Area Regional Commuter Train Service (MARC).