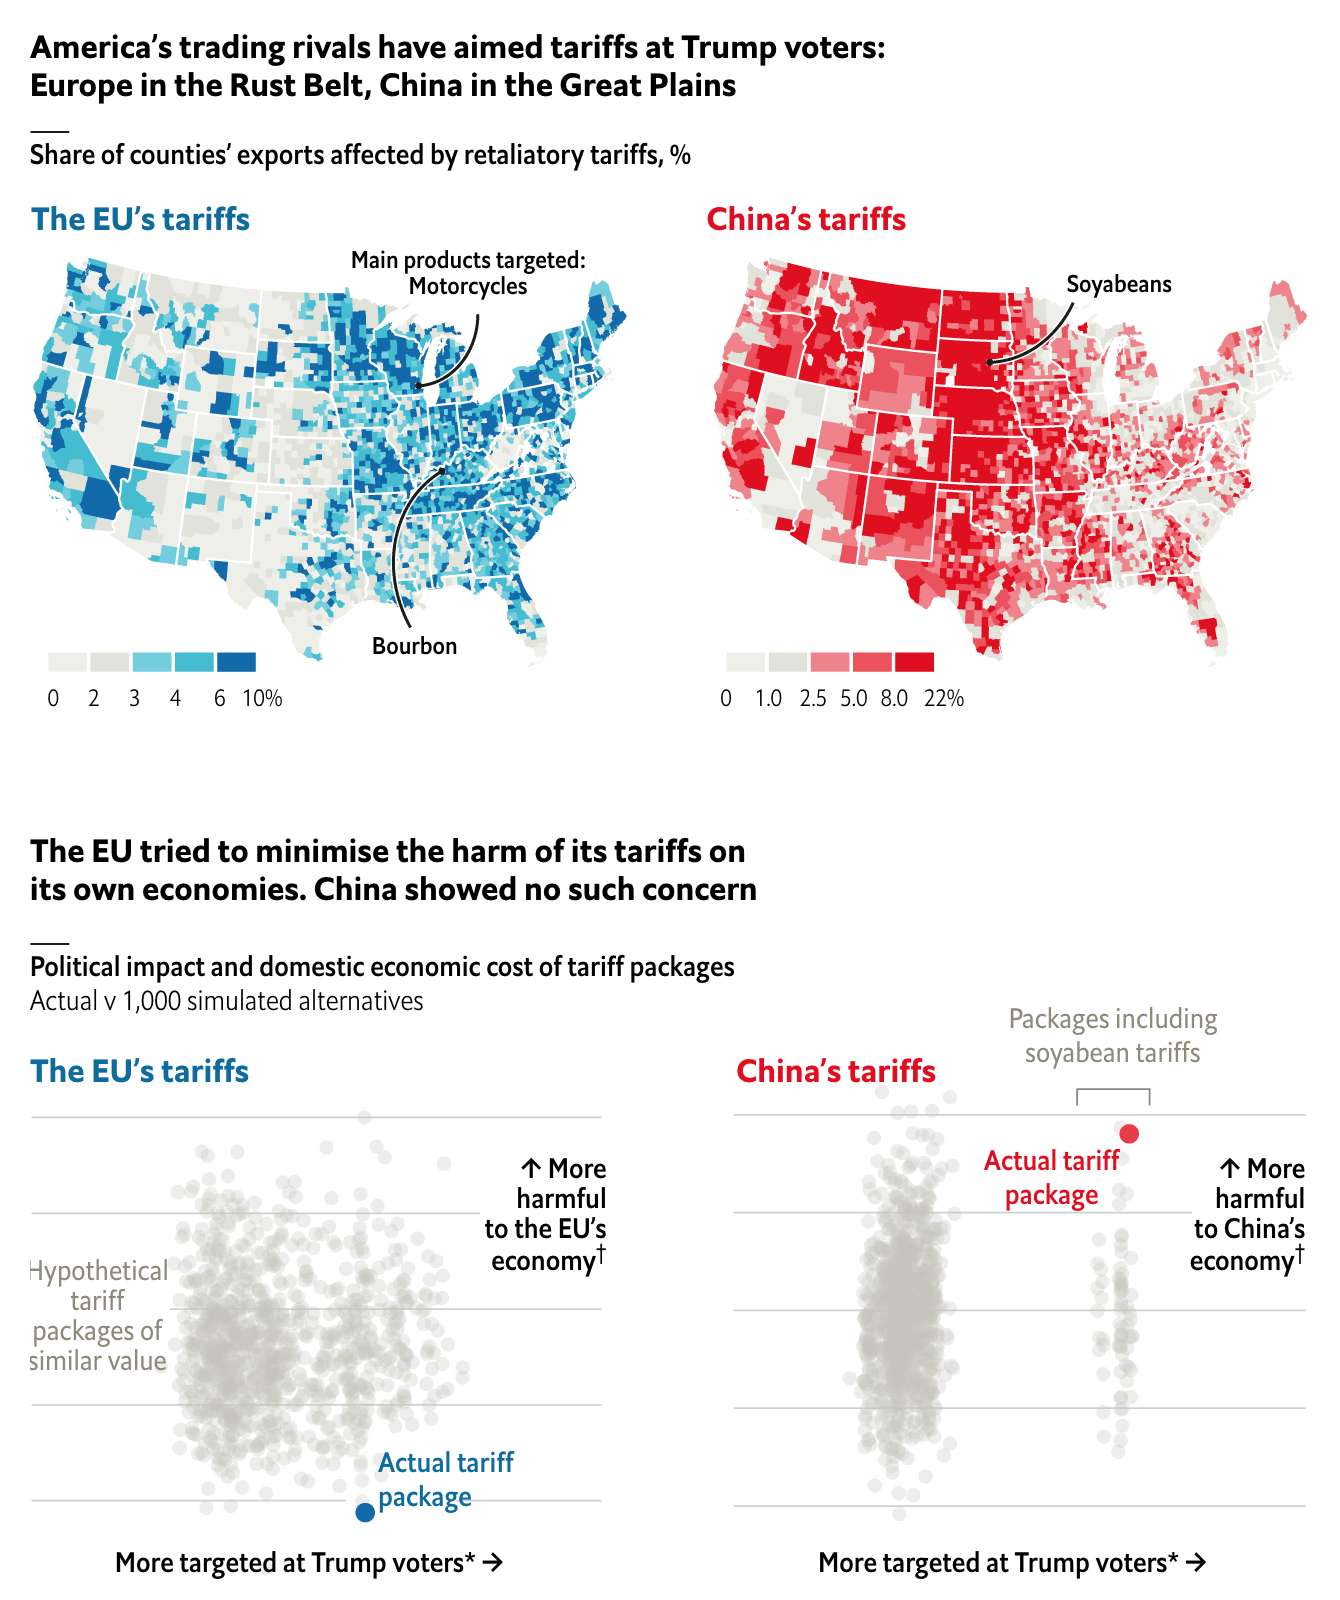
About a week and a half ago the Economist published an article about the retaliatory actions of the European Union and China against the tariffs imposed by the Trump administration. Of course last week we had a theme of sorts with lineages and ancestry. So this week, back to the fun stuff.
What makes today’s piece particularly relevant is that over the weekend, Trump announced he might increase the tariffs proposed, but not yet implemented, upon Chinese goods. So some economists looked at the retaliatory tariffs proposed by the EU and China.

Each targets Trump voters, albeit of different types. But China appears more willing to engage in a brutal fight. Its tariff proposal would not just harm Trump voters, but would also harm Chinese citizens. The EU’s plan appears tailored to maximise the pain on Trump voters, but minimise that felt by its own citizens.
A few minor points. I like how the designers chose to highlight high impact categories with colour. Lower impact shares are two shades of light grey. But after that, the scale changes. I wonder how the maps would compare if each had been set to the same scale. It looks doable as the bottom range of the maximum bin is 6% for the EU and 8% for China. (Their high limit is much higher at 22% compared to the EU’s 10%.)
That said, it does a good job of showing the different geographic footprints of the two retaliatory tariff packages. Tomorrow—barring breaking news—we will look at why that is important.
Credit for the piece goes to the Economist Data Team.

