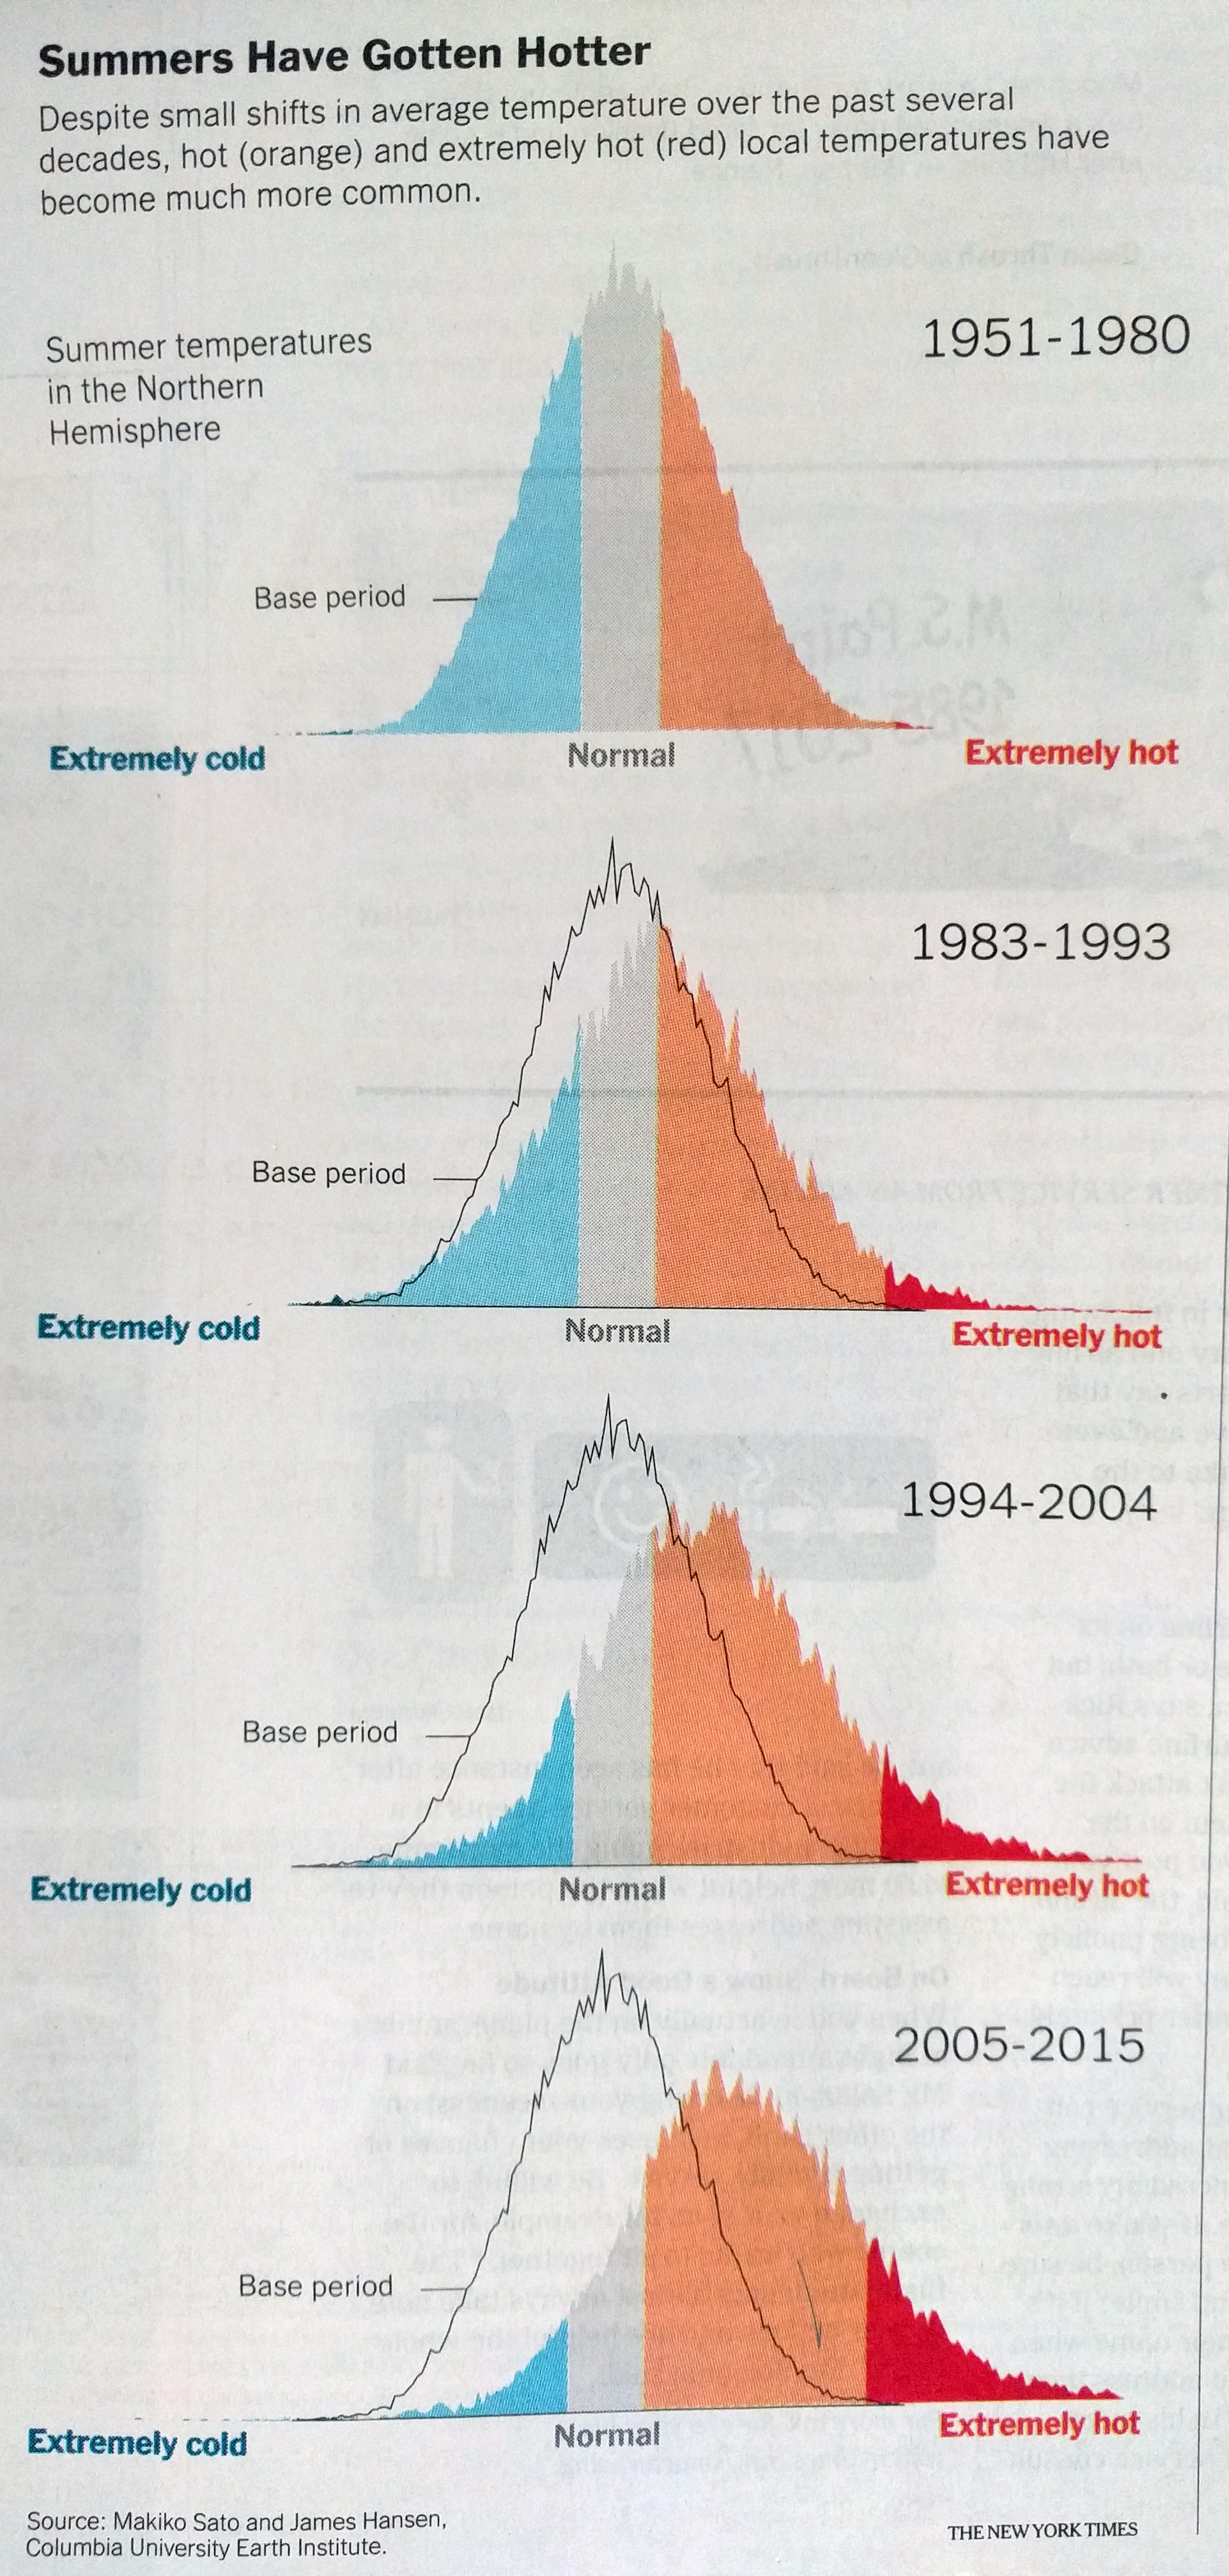
This past weekend, I came upon a neat little graphic in the New York Times supporting an article about the impact of climate change on temperatures. The article basically lays out the argument that summers are getting hotter. And as a cold-weather person, that is dreadful news.

But the good news is the graphic was well done. It uses the outline of the baseline data as a constant juxtaposition against the date interval examined. And the colour breaks remain in place to show that compared to what we consider “normal”, we are seeing a shift to the higher end of the spectrum.
Credit for the piece goes to the New York Times graphics department.

