French Politics, Elections, and Data Visualisations.

The US is not the only country with elections in 2012. Actually quite a few other places have had them, will have them, or are in the midst of having them. The latter includes France, which had the first round of its presidential election earlier this week.

To put it simply, France has a first round to narrow the whole field to just two candidates—lots of democracies outside the US have multiple party systems that mean more than just two parties—and then a second round between the last two. Nicholas Sarkozy was thought likely to win the first round and then lose the second, but he instead lost the first outright. He still isn’t expected to do well in two weeks’ time. But, the French media of course produce infographics just as US, Canadian, and British media do. Except unlike the last three, French infographics tend to be in French and I tend to not read them because, well, I cannot.

But pictures and colours make it easier. Socialists like red. Centre-right like blue.

From Le Figaro comes a map of the results. The island-looking thing on the right is Paris, beneath that Corsica, and then the bottom are the various overseas territories and departments that all vote.
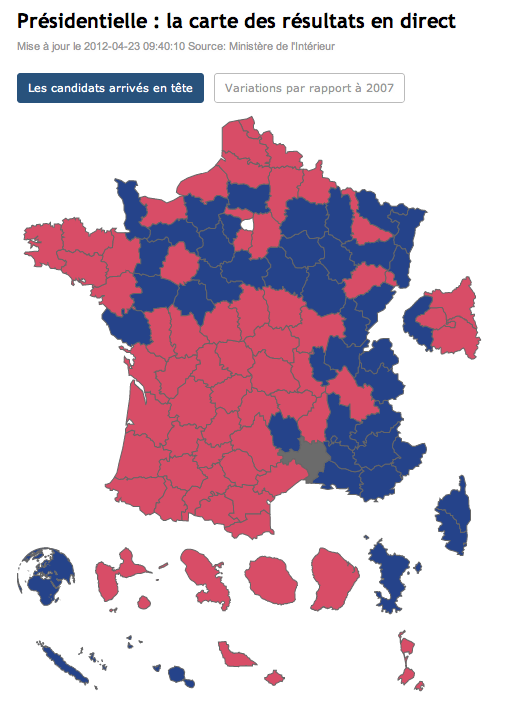
Election results by French department

The question with French presidential elections—and in fact any country that has run-off elections—is what happens to the voters of the losers? For whom will they vote in the second round? Le Figaro also has an interactive piece that allows the user to play out different scenarios based on how many voters will not show up and of those who do, how they split their vote. Again, it’s in French, so I had to assume some things when playing around with the controls and then know a few things about French politics.
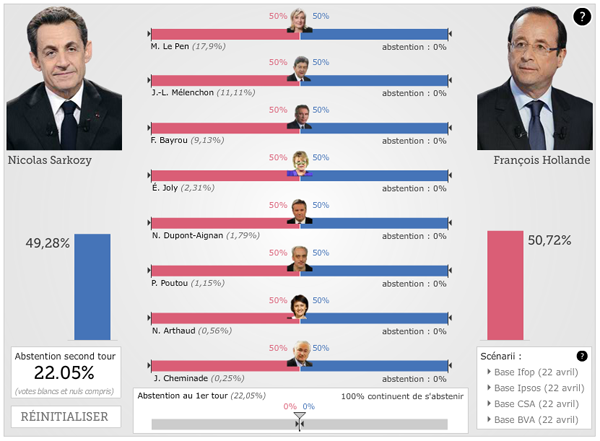
Scenario builder for Round 2

From Le Monde, another respected French media source that I have featured on more than one occasion, come some simpler visualisations of the results but with some nice features for comparison. The first is obviously a look at the 2007 results. (Anybody recall Segolene Royal? Her ex-husband/partner is Francois Hollande…the guy running for the Socialists this time round.)
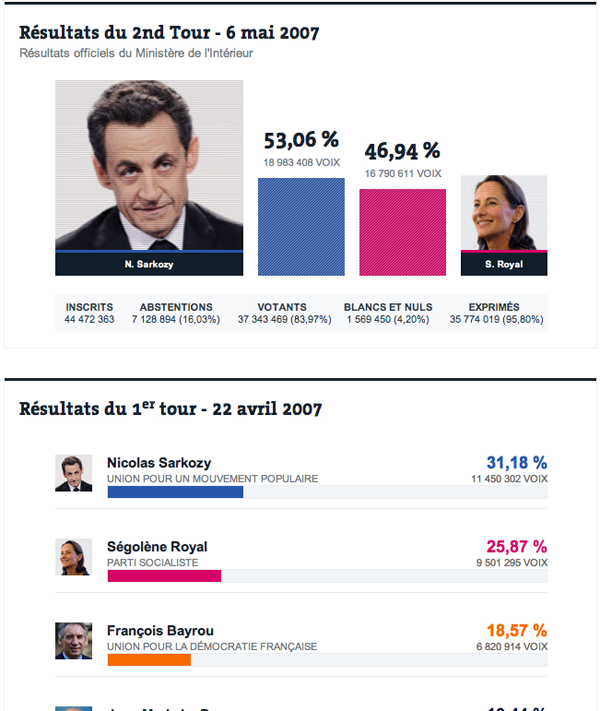
Election results of 2007

But another interesting view is that of the results strictly from 2012’s first round.
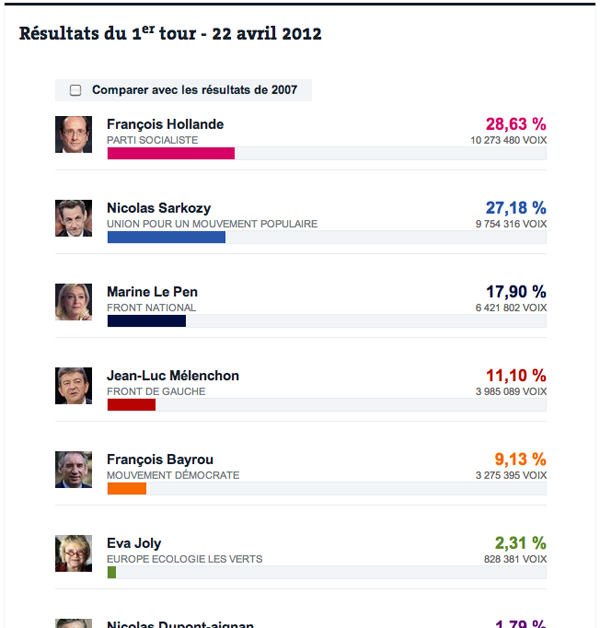
Election results 2012, Round 1

But with the added feature of comparing those results per party to their performance in 2007.
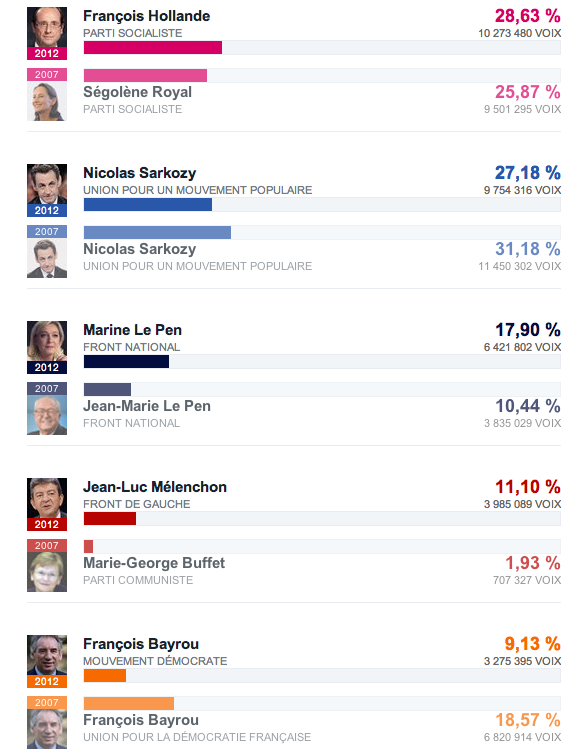
Round 1 comparison, 2012 to 2007

There are always interesting things going on in politics when it comes to data visualisation and infographics. We just have to look outside the US from time to time.

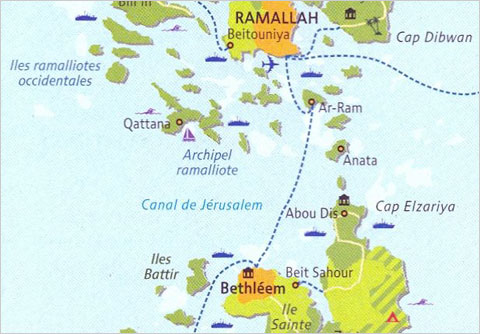
The West Bank Archipelago

This post is about an older work from Le Monde, the link to which I now forget. However, given all the talk these days about Israel and Palestine and 1967 borders, I figured it may well be advantageous to remind all that the borders likely will not be those of 1967, for the sheer fact that Israel has divided the West Bank between security zones and settlements. The end result is that the Palestinian areas of the West Bank now resemble more an archipelago nation better suited for the islands of Indonesia or the Caribbean rather than the desert of the Middle East.

This link takes you to a New York Times blog post about the land problem and includes the map, which one can see at a reduced scale down in the article.

Detail of the map
Detail of the map

Credit for the original goes to Julien Bousac of Le Monde.

Useful Africa

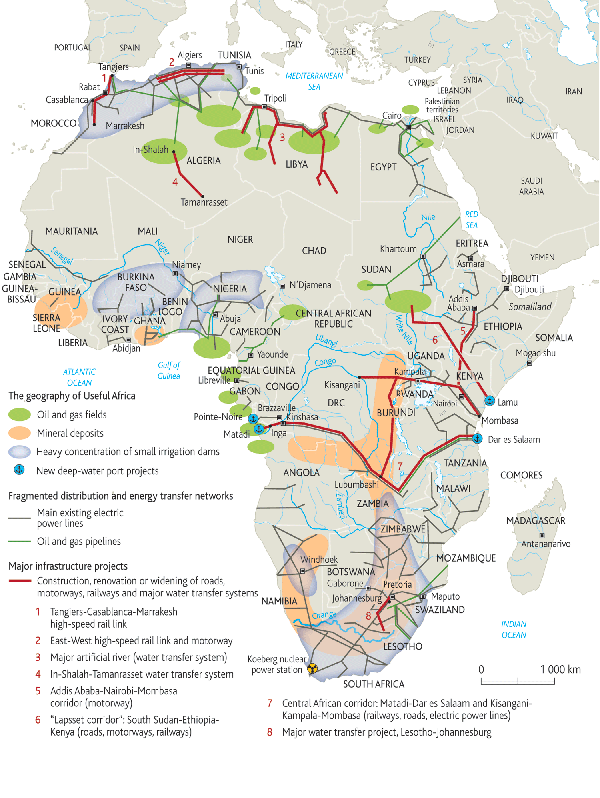
Another rather recent infographic from Le Monde’s Philippe Rekacewicz is this, called Useful Africa.

Useful Africa
Useful Africa

One of the key problems for African development is its lack of infrastructure. Here we see the proposed and under-construction projects that will hopefully raise Africa up from its current state. But the infrastructure is only as good as it is economically useful. Hence the connection between those same infrastructure projects and areas of mineral or hydrocarbon reserves.

This is an example of where a map is incredibly useful, as opposed to say a choropleth that shows which countries in Africa have the highest concentrations of oil reservers, of natural gas reserves, and of mineral reserves. The geography here is key to understanding the transport links between major population centres, ports and points of distributions, and the raw materials to be exported—if not processed and refined.

Maps Made by Hand (Or Simulations Thereof)

Le Monde is a French-language publication and so I never really bother with it, despite favourable reviews. However, they do have a small site with some content in the English language that I check from time to time. Frequently they have maps or other graphics of some interest, and this time upon visiting—done to see if they have anything on Libya given the lead taken by France and the UK—they had a few maps of the situation in North Africa.

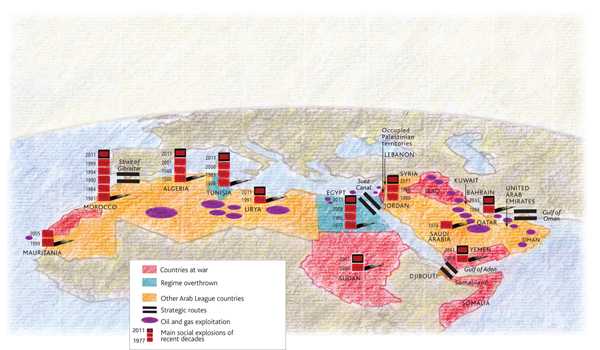
Political Situation in North Africa and the Middle East

By and large, nothing radical or ground-breaking in the maps. But, the designer, Philippe Rekacewicz, used a different cartographic perspective than I am at least accustomed to seeing for infographics. And then the aesthetic of the map is interesting, and quite different than what one typically sees. In a refreshingly interesting way. Now, whether he used a texture or filter in Photoshop to create the background map or whether he physically drew the map (and then overlaid the informational elements digitally), it matters little as the style works. I enjoy the idea of mixing the hand-made and data visualisation—though it needs to be well-executed.

He created a few sets of maps; each makes use of a slightly different palette. These certainly help create the visual distinction necessary between data sets. The pie charts are not particularly helpful, but they at least are kept simple: looking at only two parts of the whole. The comparison within each nation by bar charts of internet connectivity and higher-education learning works. It begins to work not so well as one tries to compare country to country. Though, the separation of the bars into ten-percentage point sub-bars begins to alleviate that issue. The main map, that highlights the political situation does a nice job of putting these countries into broader context. That is, who has oil and who has control over the key waterways in the region.

the three smaller maps

All in all, a refreshing set of maps that illustrate the fluid situation in North Africa and the Middle East.