Americans Can’t Kick the Auto Habit

After looking this week at the growth of the physical size of cities due to improvements in transport technologies, the increasing density of cities, and then the contribution of automobile (especially personal cars) to carbon dioxide emissions, today we look at a piece from the Transport Politic comparing US and French mass transit ridership to see whether the recent decline in US ridership is inevitable or a choice made by consumers and policymakers. Spoiler: it’s not inevitable.

The article makes use of a few graphics and an interactive component. The lead-in graphic is a nice line chart that runs with the spaghetti nature of the graphic: lots of line but only two are really highlighted.
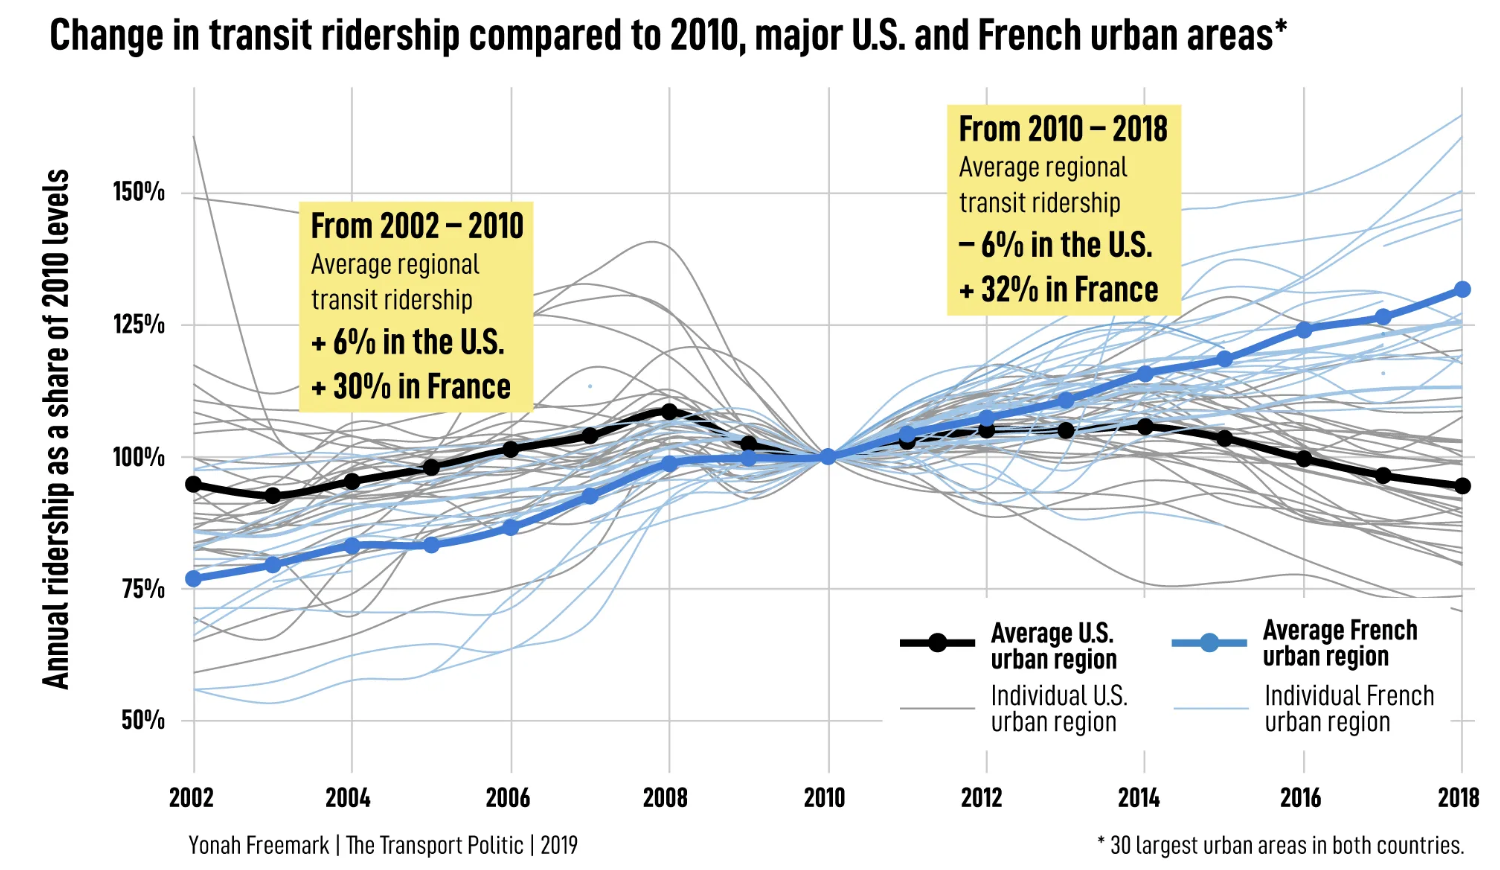
The French are definitely better than the US here.

Light grey lines and light blue lines encode the US and French cities under study. But only the lines representing the averages of both the US and France are darkly coloured and in a thicker stroke to stand out from the rest. Normally I would not prefer the minimum of the y-axis being 50%, but here the baseline is actually 100% so the chart really works well. And interestingly it shows that prior to the Great Recession, the United States was doing better than France in adoption of mass transit, relative to 2010 numbers.

But then when you directly compare 2010 to 2018 for various US and French cities, you get an even better chart. Also you see that French cities reclaim the lead in transit growth.
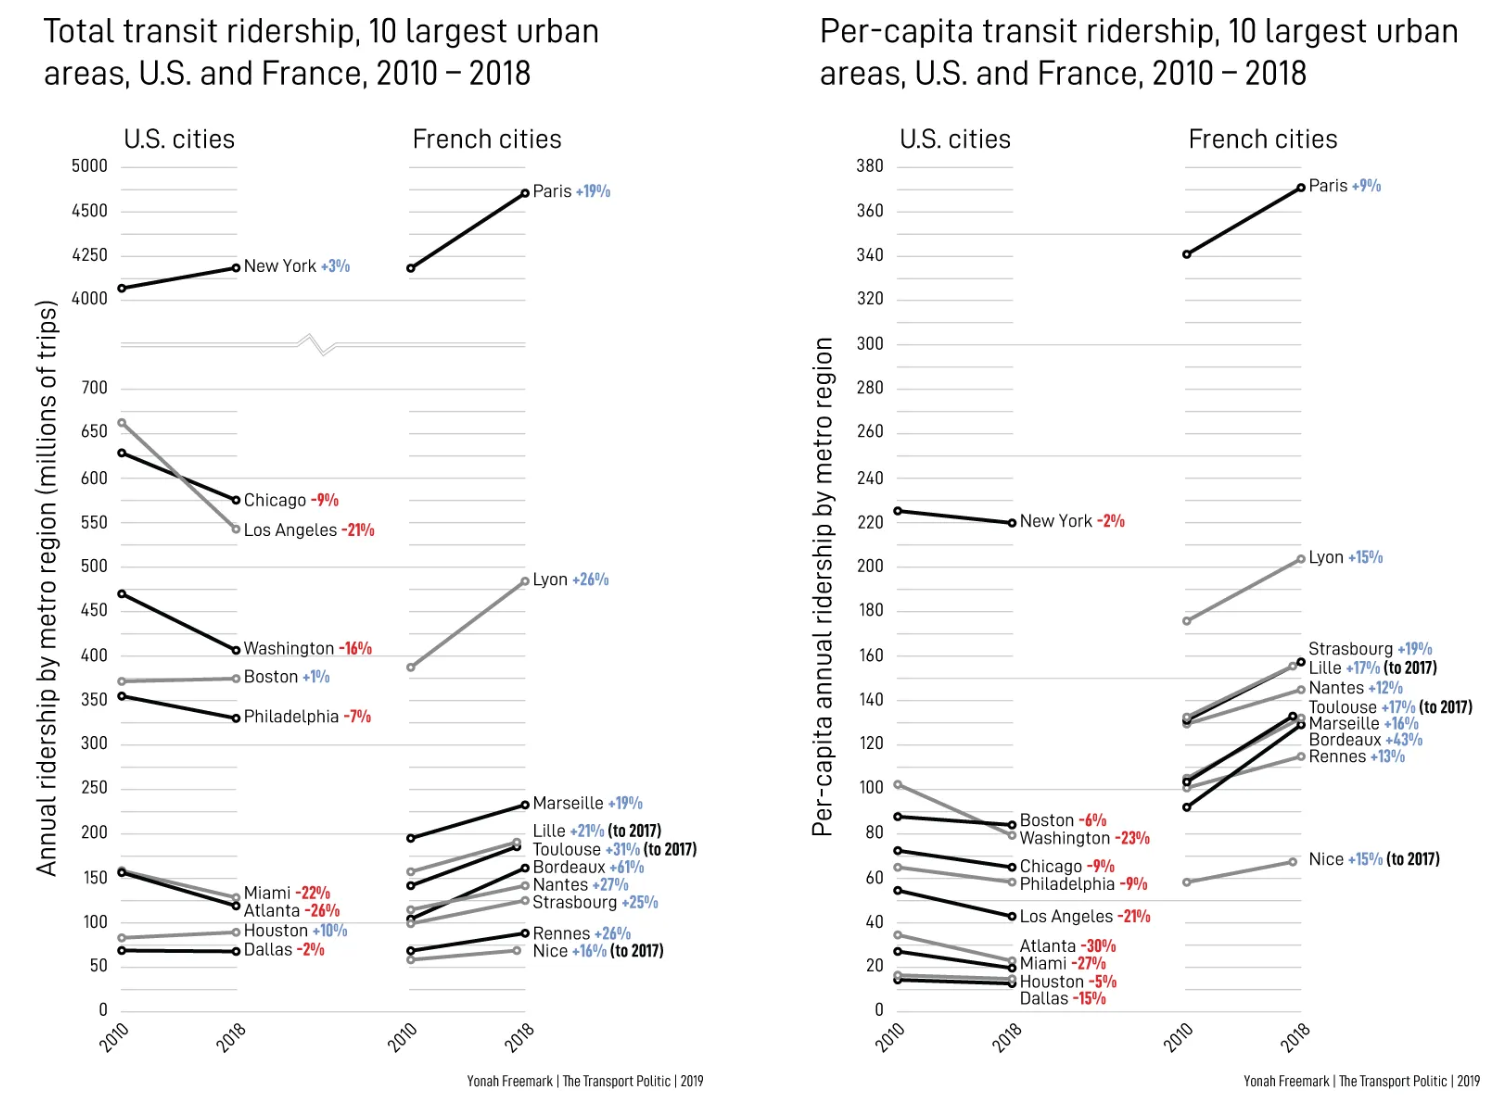
A lot of declines on this side of the pond.

These two static graphics, which can each be clicked to view larger, do a really great job of cutting through what some might call noise of the intervening years. I do like, much like yesterday’s post, the comparison of total or aggregate ridership to per capita numbers. It shows how even though New York’s total ridership has increased, the population has increased faster than the ridership numbers and so per capita ridership has declined. And of course as yesterday’s post examined, in the States the key to fighting climate change is reducing the number of people driving.

What I cannot quite figure out from the graphic is what the colouration of the lines mean. I thought that perhaps the black vs. grey lines meant the largest cities, but then LA would be black. Maybe for the steepest declines, but no, because both LA and Boston are grey. I also thought the grey lines might be used when black lines overlap to aid clarity, but then why is Boston in grey? Regardless, I like the choice of the overall form.

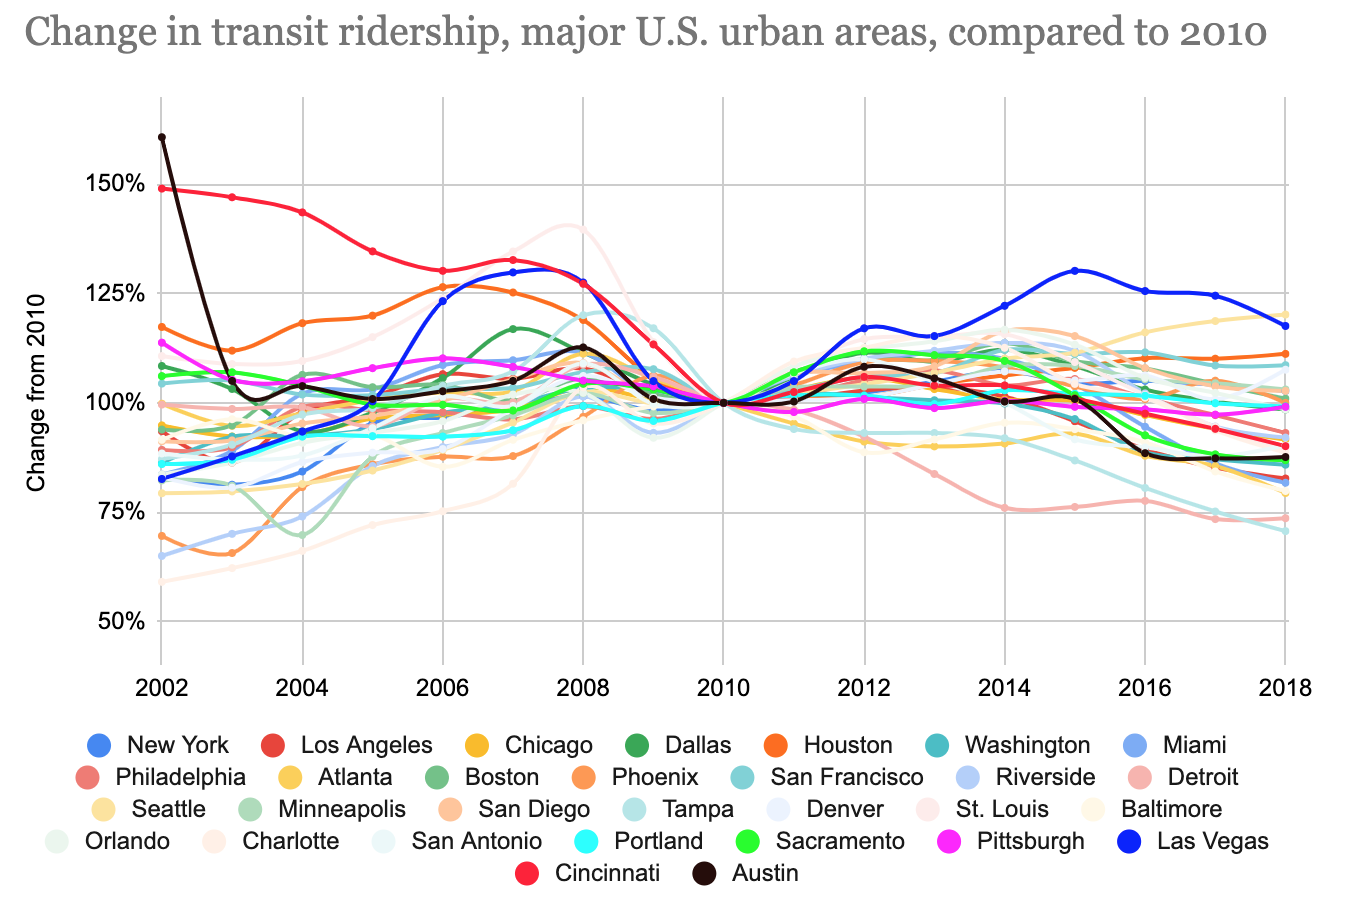
But where things go really downhill are the interactive charts.
Just what?
Just what?

Talk about unintelligible spaghetti charts. So the good. The designer kept the baseline at 100% and set the min and max around that. After that it’s a mess. Even if the colours all default to the rainbow, the ability to select and isolate a particular city would be incredibly valuable to the user. Unfortunately selecting a city does no such thing. All the other cities remain coloured, and sometimes layered atop the selected city.

I would have thrown the unselected cities into the greyscale and let the selected city rise to the top layer and remain in its colour. Let it be the focus of the user’s attention.

Or the designer could have kept to the idea in the first graphic and coloured American cities grey and French cities light blue and then let the user select one from among the set and compare that to the overall greyed/blued masses and the US and French averages.

Overall, it wasn’t a bad piece. But that final interactive bit was questionable. Unfortunately the piece started strong and ended weak, when the reverse would have been preferable.

Credit for the piece goes to Yonah Freemark.

Notre Dame Almost Did Collapse

Back in April the famed Notre Dame cathedral in Paris caught fire and its roof and spire spectacularly collapsed. At the time I looked at a few different pieces, including two from the New York Times, that explored the spread of the fire. Several months later the Times has just published a look into how the firefighters saved the cathedral from collapse.

The graphics are the same amazing illustrated models from before. Now with routes taken by firefighters and coloured areas indicating key equipment used in the fight to preserve what could be saved. But the real gem in the article are a series of graphics from the firefighters themselves.

Some pretty hot sketches here

Naturally the annotations are all in French. But this French firefighter and sketch artist detailed the progress of the battle during and in the days after the fire. It makes me wish I could read French to understand the five selected sketches the Times chose to use. And I love this line from the Times.

For all the high-tech gear available to big-city fire departments, investigators still see value in old-school tools.

If you are interested in the story of how the cathedral was saved, read the lengthy article. If you just want to see some really amazing and yet wholly practical sketches, scroll through the article until you get to these gems.

Credit for the overall piece goes to Elian Peltier, James Glanz, Mika Gröndahl, Weiyi Cai, Adam Nossiter, and Liz Alderman.

Credit for the sketches goes to Laurent Clerjeau.

The Fire at Notre Dame Cathedral

This was not what I was going to write about today, but the news of the fire that ravaged Notre Dame yesterday rightly dominated the news yesterday and this morning. However, while I found multiple articles dealing with photographic evidence of the damage, I did not see many that detailed the fire from an illustrative or diagrammatic standpoint.

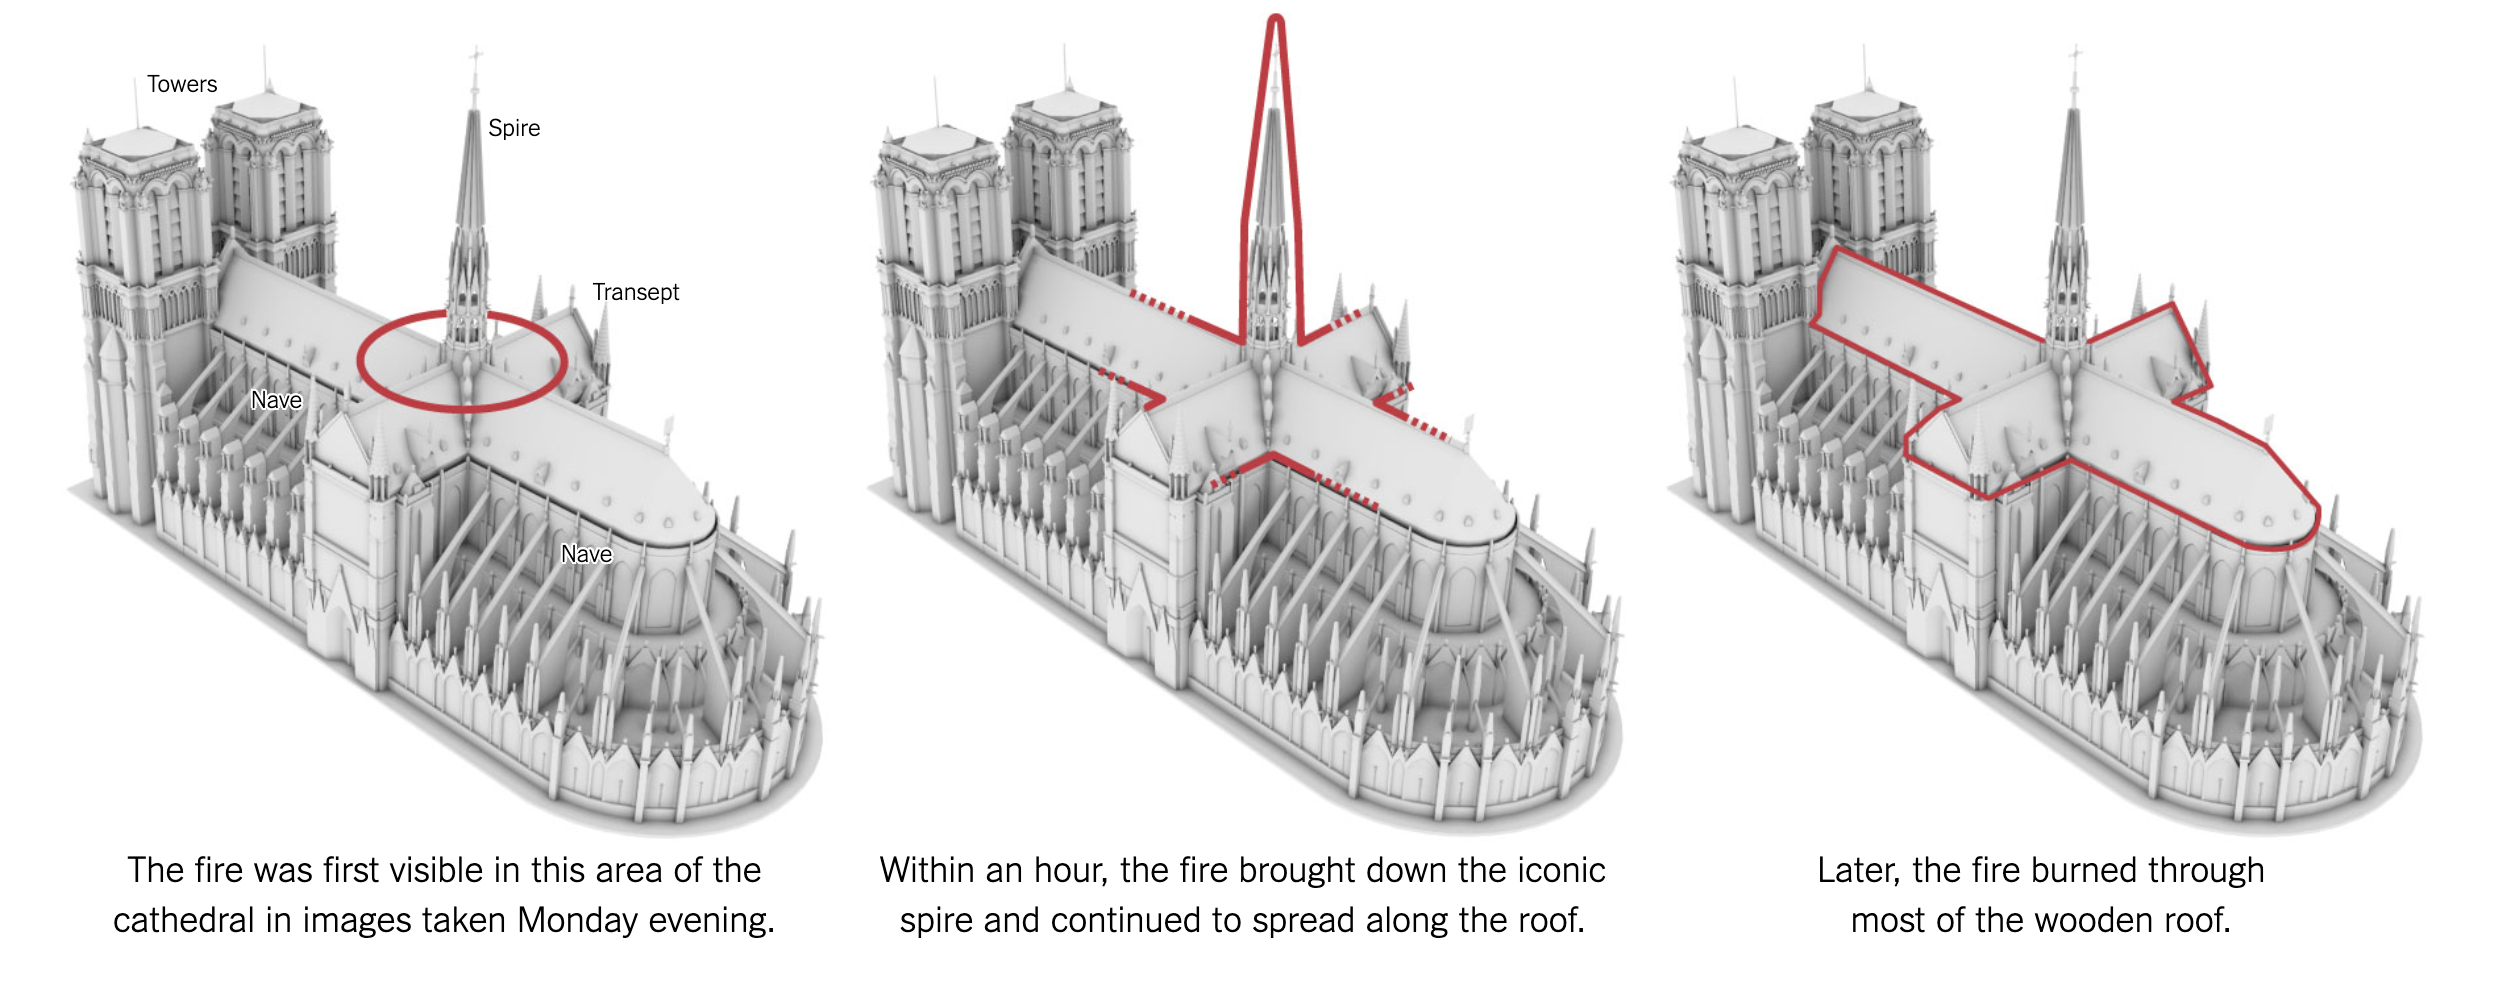
Thankfully, the New York Times did just that. They posted an article that deals specifically with the fire. It includes this set of small multiples that shows the progression along the roof and spire.

Unfortunately wood burns quickly

The article also includes a nice diagram explaining how the fire was focused on the cathedral’s attic. That explains some of the imagery from this morning that shows combustible materials like the pews and pulpit on the stone floor fully intact. And that provides hope the overall building can be saved, as French officials are indicating today.

Credit for the piece goes to Larry Buchanan, Weiyi Cai, James Glanz, Evan Grothjan, Allison Mccann, Yuliya Parshina-Kottas, Karthik Patanjali, Jugal K. Patel, Scott Reinhard, Bedel Saget, Anjali Singhvi, and Jeremy White.

Could Marine Le Pen Have Won?

Well not likely—it was going to be tough regardless.

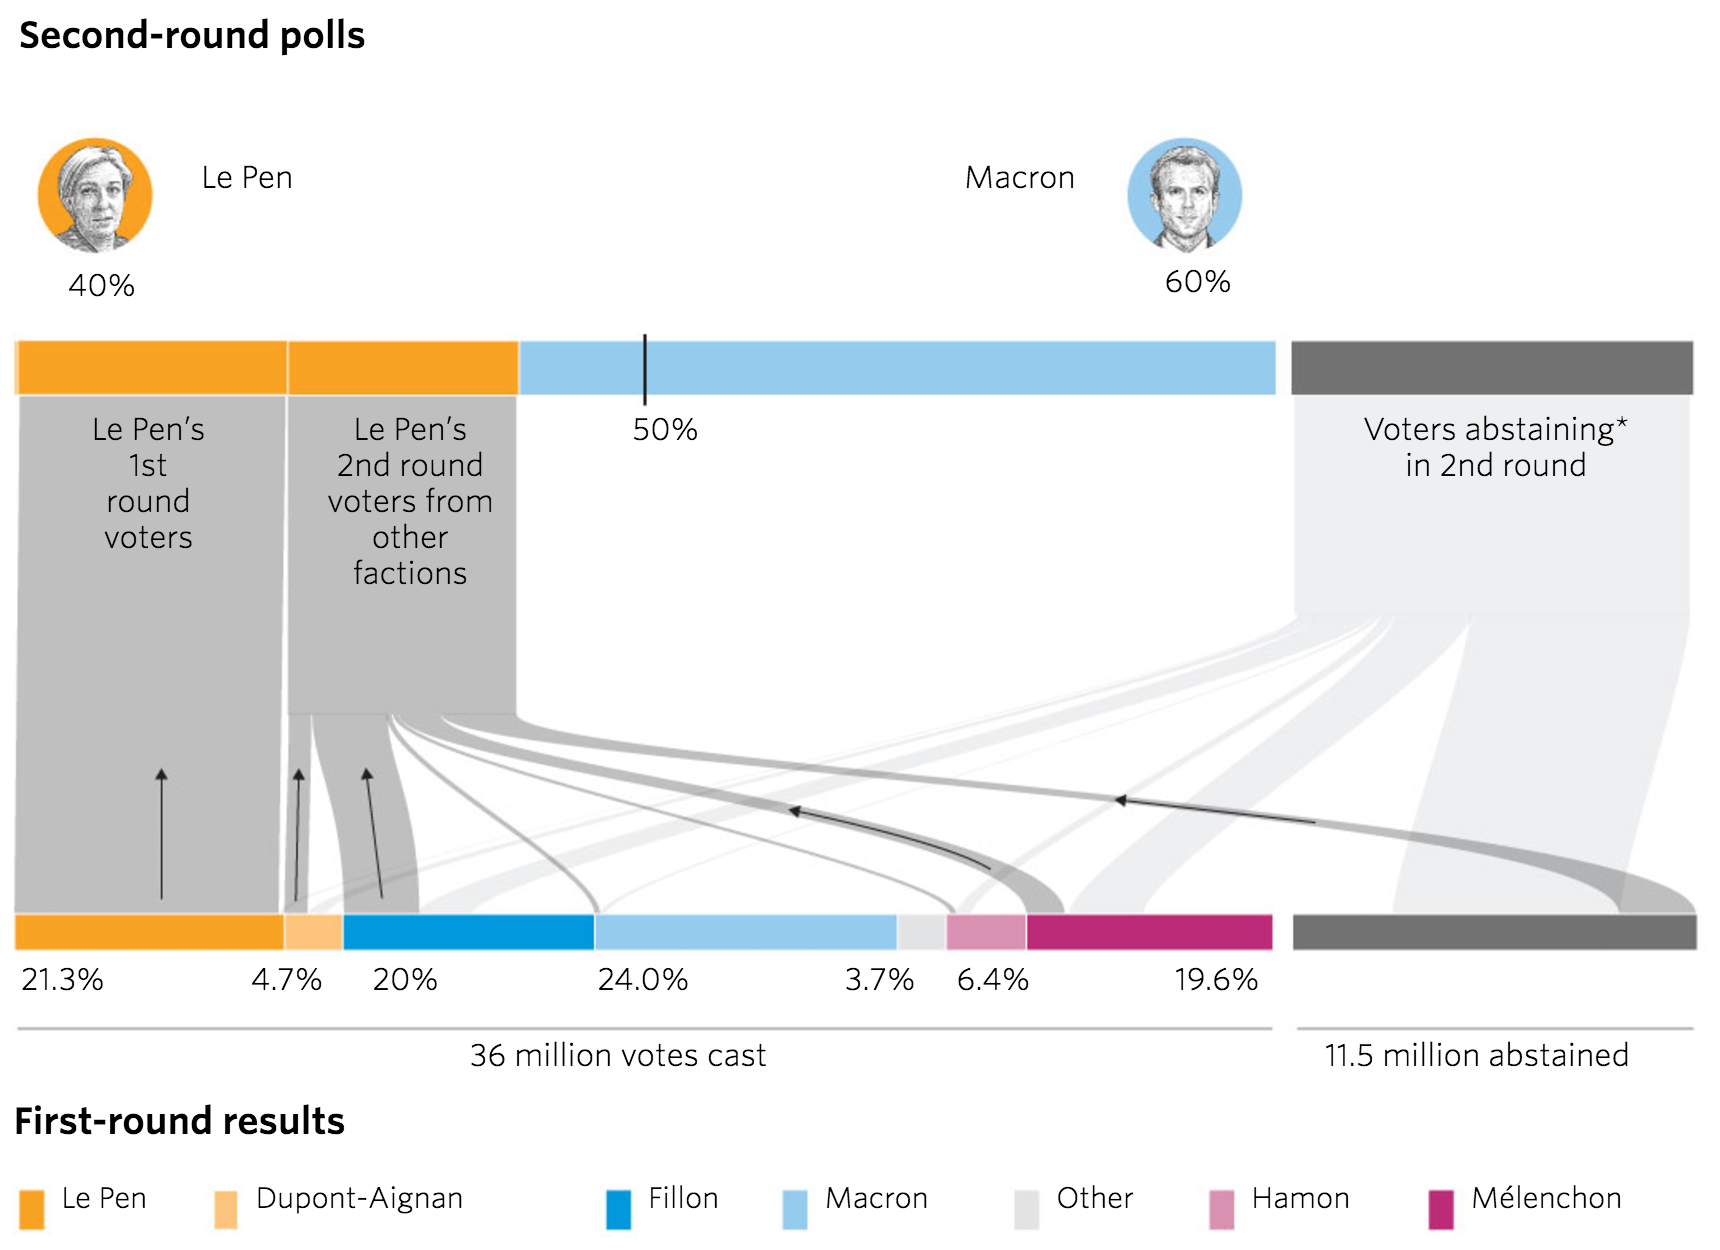
Today’s piece is also from the Wall Street Journal and it was posted Saturday, the day before the election. It used a Sankey diagram to explore the support that Le Pen would have needed to draw from every candidate in the first round to get over the 50% mark in the second round.

Turns out she didn't get the maths
Turns out she didn’t get the maths

If anything this chart is not the story. The story is that the final count I saw put Macron not on 60%, but on just over 66%.

Turns out she couldn’t.

Credit for the piece goes to Stacy Meichtry and Jovi Juan.

Vive la France

Emmanuel Macron won the French presidential election yesterday. So Guess what we have a graphic or two of this week? If you guessed Mongolian puppies, you were wrong.

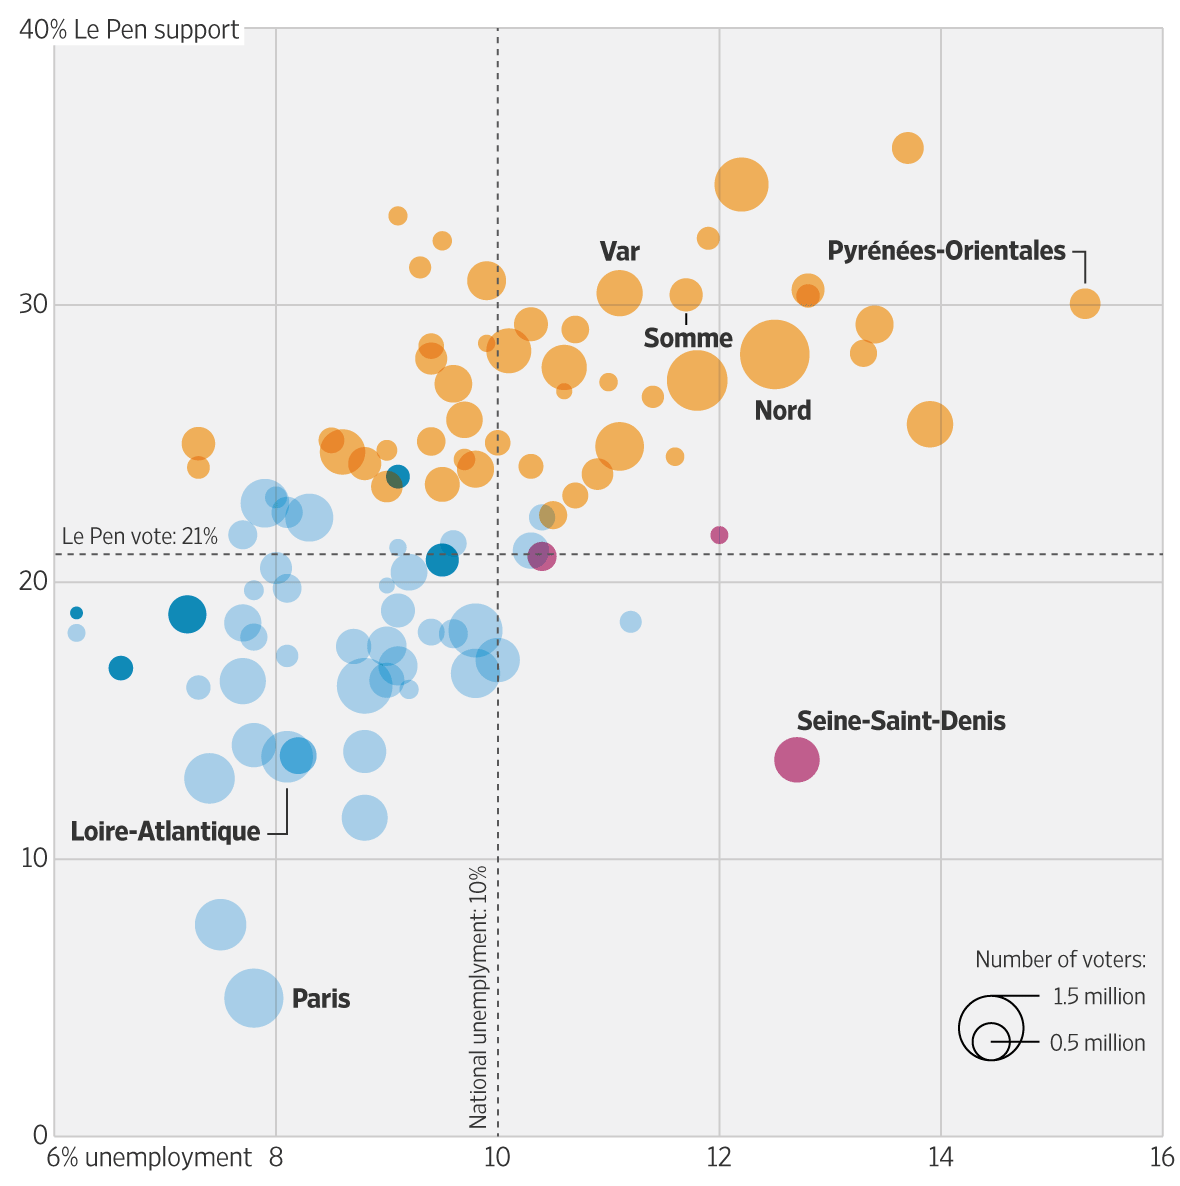
Thursday afternoon the Wall Street Journal—they seem to really be upping their game of late—published an article breaking down the connection between a Le Pen support in the first round and unemployment. For me, the key to the article was the following graphic, which plots those two variables by department. The departments that she won, generally speaking, suffer higher unemployment.

Unemployment and Len Pen support

Colour coding relates to the winner of the department. I am not certain that the size of the voters in the department matters as much. But the annotation of particular departments, qualified as being limited to the French mainland—see my problem back in April about when France is more than France—flows through the several graphics in the piece.

This is a piece from the Thursday running up to Sunday’s vote. Tomorrow we will look at a piece from the day before the vote that looked at another key component of Macron’s win.

Credit for the piece goes to Martin Burch and Renée Rigdon.

When France Is More Than France

Yesterday we looked at the result of, but today I want to talk about covering of the French presidential election. It dovetails nicely with a recent story here in the states about Hawaii.

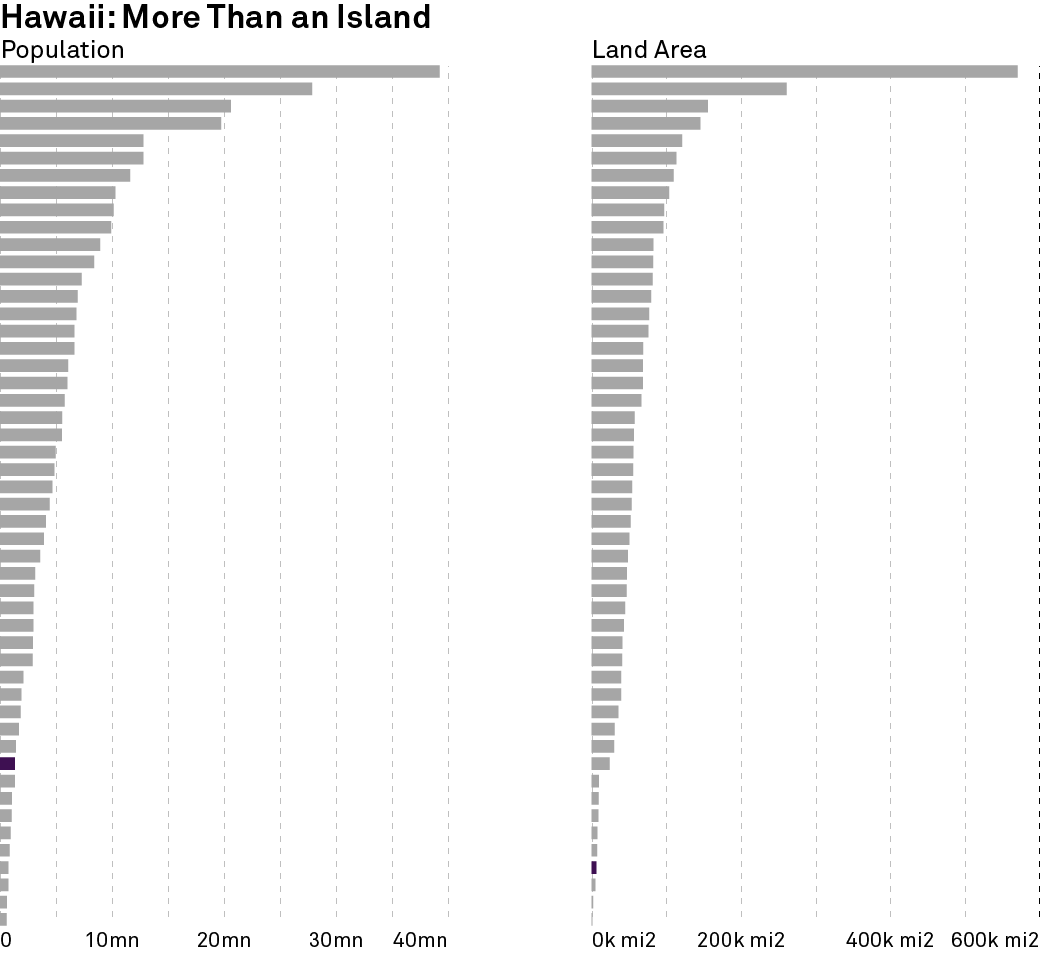
Last week Attorney General Jeff Sessions criticised a court ruling because it came from a judge “on some island in the Pacific”. That island, of course, is Oahu. Oahu is one of several islands that comprise the state of Hawaii, including the eponymous island. But it does not matter that the state is in the middle of the Pacific Ocean, it is one of the fifty states of the union. And in terms of population, it isn’t even the smallest state. Should we not care about court decisions in Wyoming because so few people live there? No, because it is one of the fifty states.

Where Hawaii falls within the 50 states

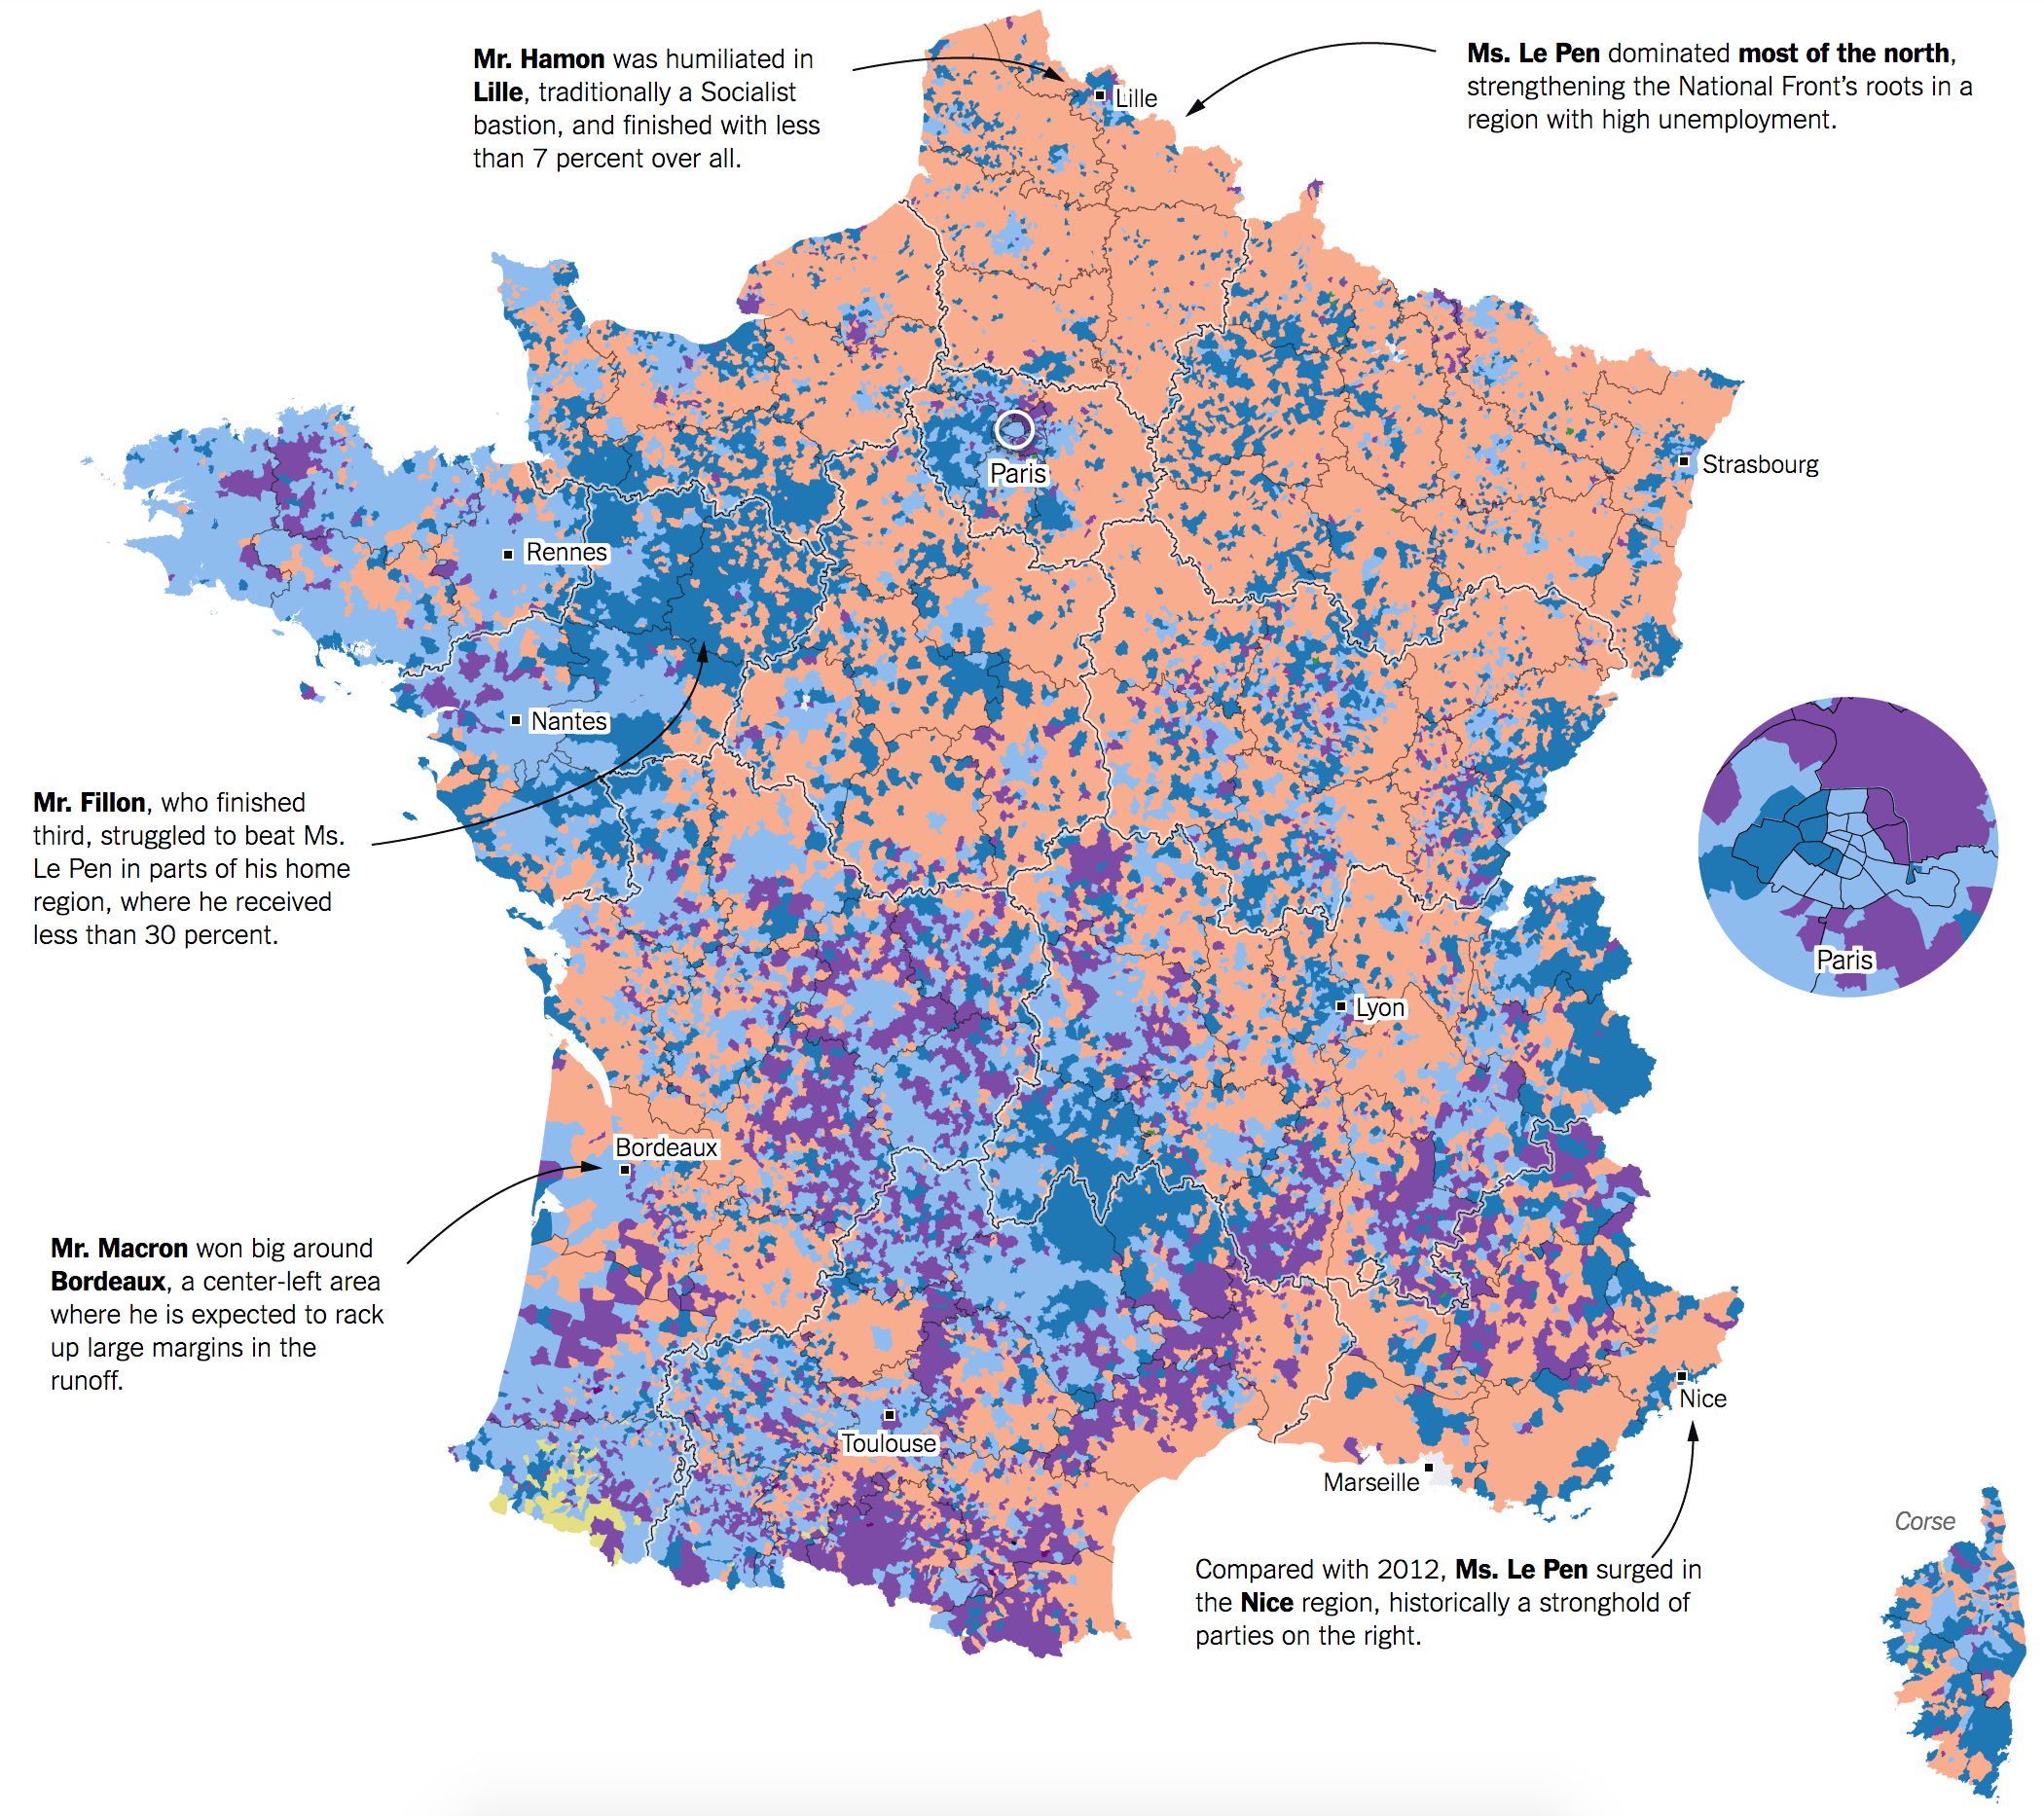
Now you are likely asking, what does that have to do with the French presidential election? Well, it has to do with choropleth maps of French results. Well, most likely you were not looking at a map of the French Republic. Take this map from the New York Times.

Here be France
Here be France

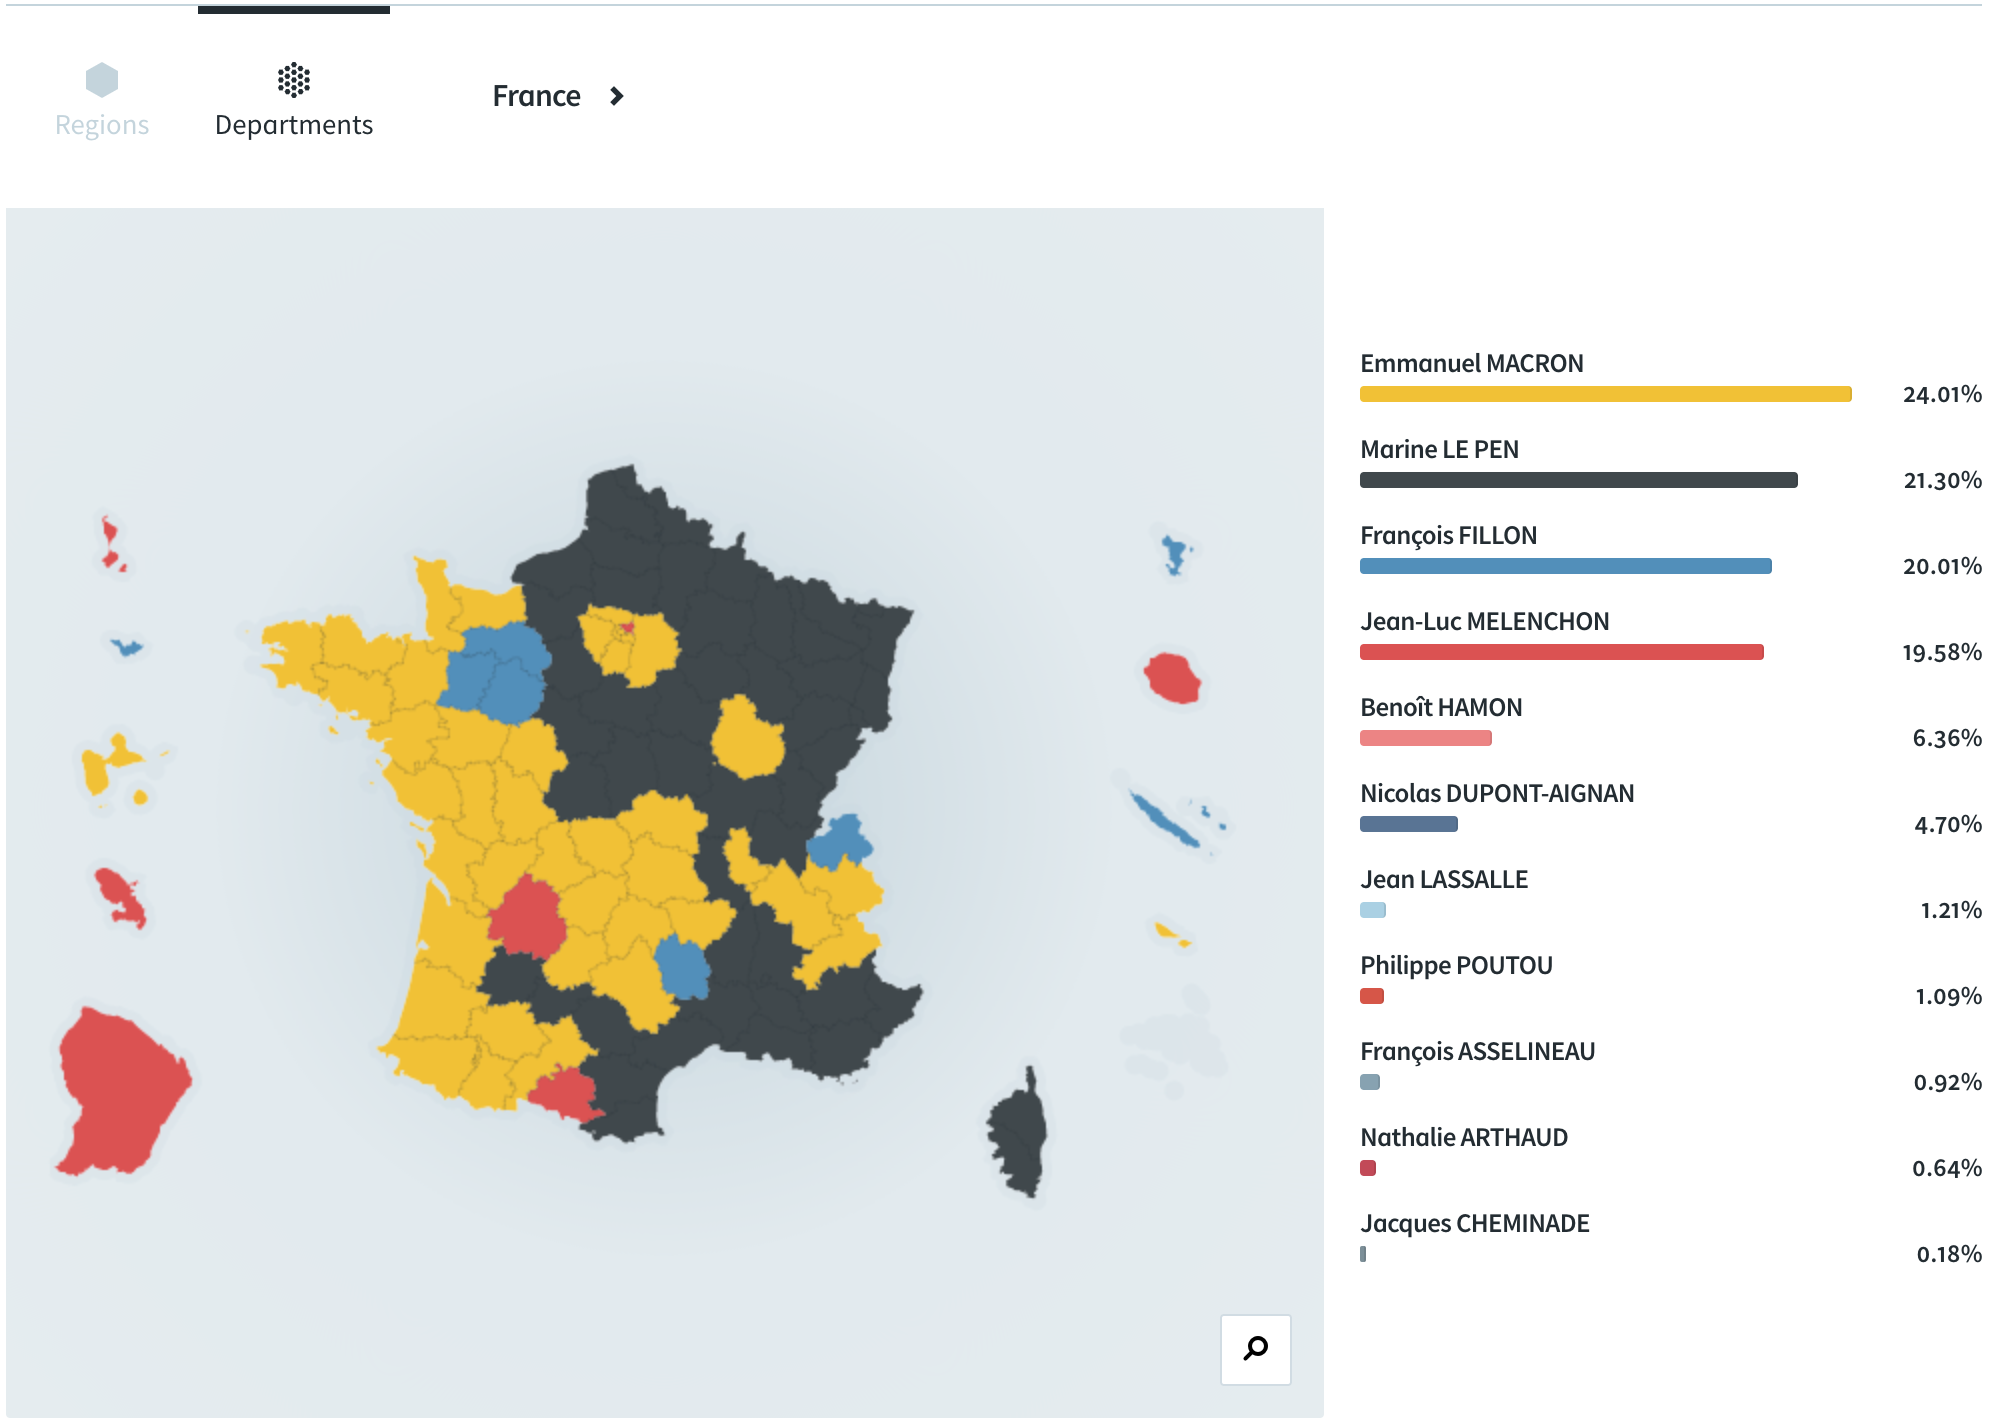
It looks like France, but it’s only a part of France. Instead, we have France 24 presenting the map correctly. The thing missing? All those little geographies around the border.

The real France
The real France

You may recall that France at one point had an empire. At home, France was organised into state-like entities called departments. By contrast, the United Kingdom had an empire with its home territories organised into counties. Then in the 20th century, both empires began to dissolve. In the UK that meant independence for most places, but others transitioned from colonies to crown dependencies, e.g. Gibraltar and until 1997 Hong Kong. But technically, they are not part of the United Kingdom. (Don’t get me started on the Isle of Man, Jersey, and Guernsey.)

In France, there were some conflicts—here’s looking at you French Indochina/Vietnam—and some independence. But for those that did gain independence, the territories took a different track from the crown dependences in the UK. France integrated them into the French Republic and made them full-on departments. (It is a little bit more complicated than that, but for now we’ll keep it simple.) So now, if you visit Canada and take a day trip to St. Pierre and Miquelon, you are stepping on France. This is also different from Puerto Rico and the United States, where Puerto Rico is not fully part of the United States.

And so what does this mean for electoral purposes? Well, as you have probably figured out, this all means that French elections are geographically broader than those of the UK or the US. Gibraltar does not vote for Parliament and so you will not see it on the June election maps. In 2016, notice how you did not see Puerto Rico in the US presidential election maps. But because of how France integrated its former colonies as departments, Cayenne, French Guiana gets as much of a say on the French president as does Paris.

So remember, next time you look at a map of France on Europe, it’s like looking at a map of the United States without Alaska and Hawaii. Because France too exists on an island in the Pacific. It’s called New Caledonia.

Marine Le Pen’s Chances

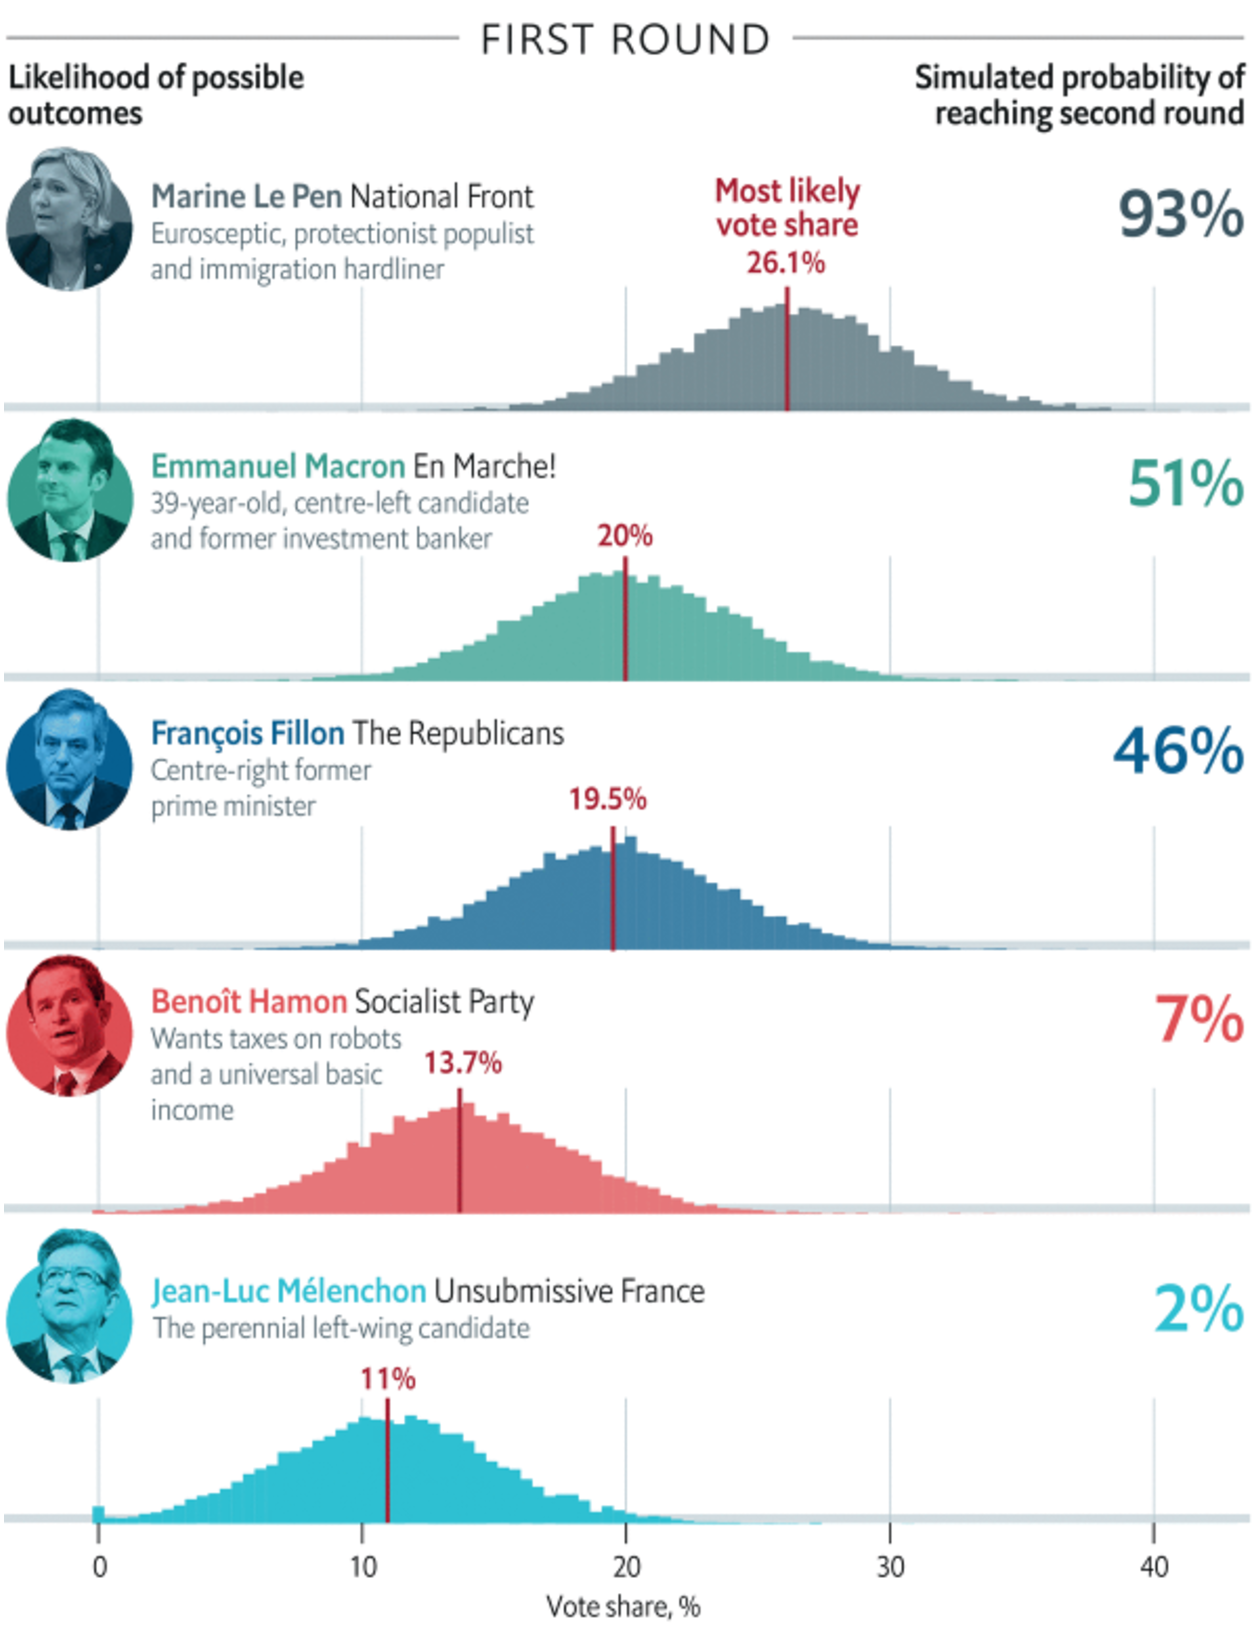
Last Friday the Economist published this article about the odds of Marine Le Pen, the leader of France’s National Front party, winning the French presidential election in April. You may recall I focused on other things last Friday. So today we have this graphic.

Without a majority of the vote, the top two vote earners move to a second round

But this morning news broke about new allegations over fraudulent claims by Le Pen and the National Front. This, after claims of fraud against Fançois Fillon and some unhelpful remarks about Algeria from Emmanuel Macron, could be enough to make the French presidential election a complete toss up.

But for now we just wait to see if the rise of populist nationalism continues.

Credit for the piece goes to the Economist’s graphics department.

Timeline of Recent French Terrorism Attacks

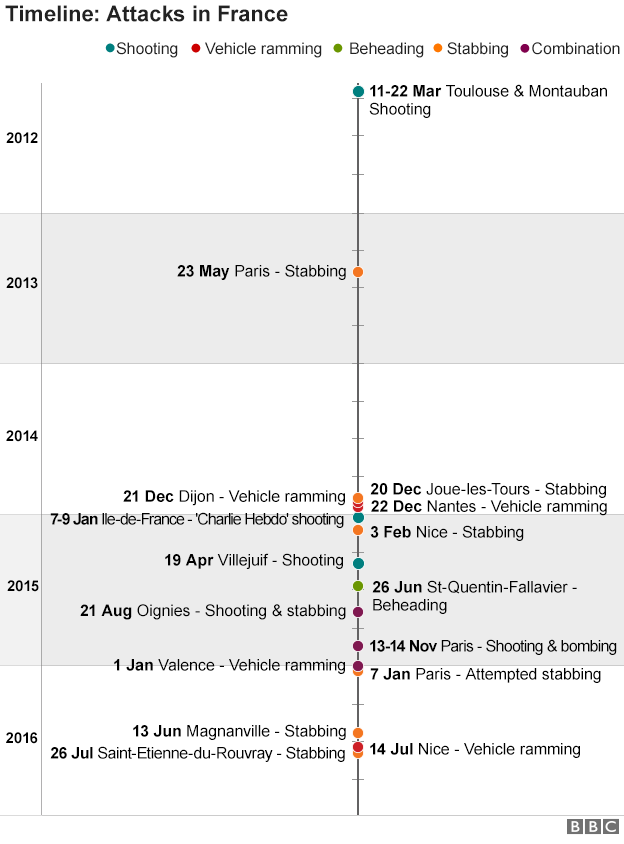
Yesterday the French Catholic community of Rouen was attacked by an alleged IS terror group. In the aftermath the BBC put together a graphic published inside a broader piece. The graphic documented the recent history of terror attacks in France.

When you read or scroll through the overall piece, a bit more symmetry could be added by aligning dates to the central column. That would make the dates more easily comparable. Though it should be noted the important point is made by the rapid clustering of events in the most recent time period.

And for a personal quibble, I believe that timelines are more effective when the most recent date is at the top. Presume the timeline starts in the 1950s during the middle of the Algerian War fought between France and Algeria, which at the time was an integral part of France. Would we want to read all those incidents from the 1950s and 60s? Likely no. Instead, we could scroll down the entirety of the piece. Here, however, we start in the relative calm of 2012, 2013, and early 2014.

Timeline of terror attacks in France

Credit for the piece goes to the BBC graphics department.

The Perception vs Reality of Islam in Europe

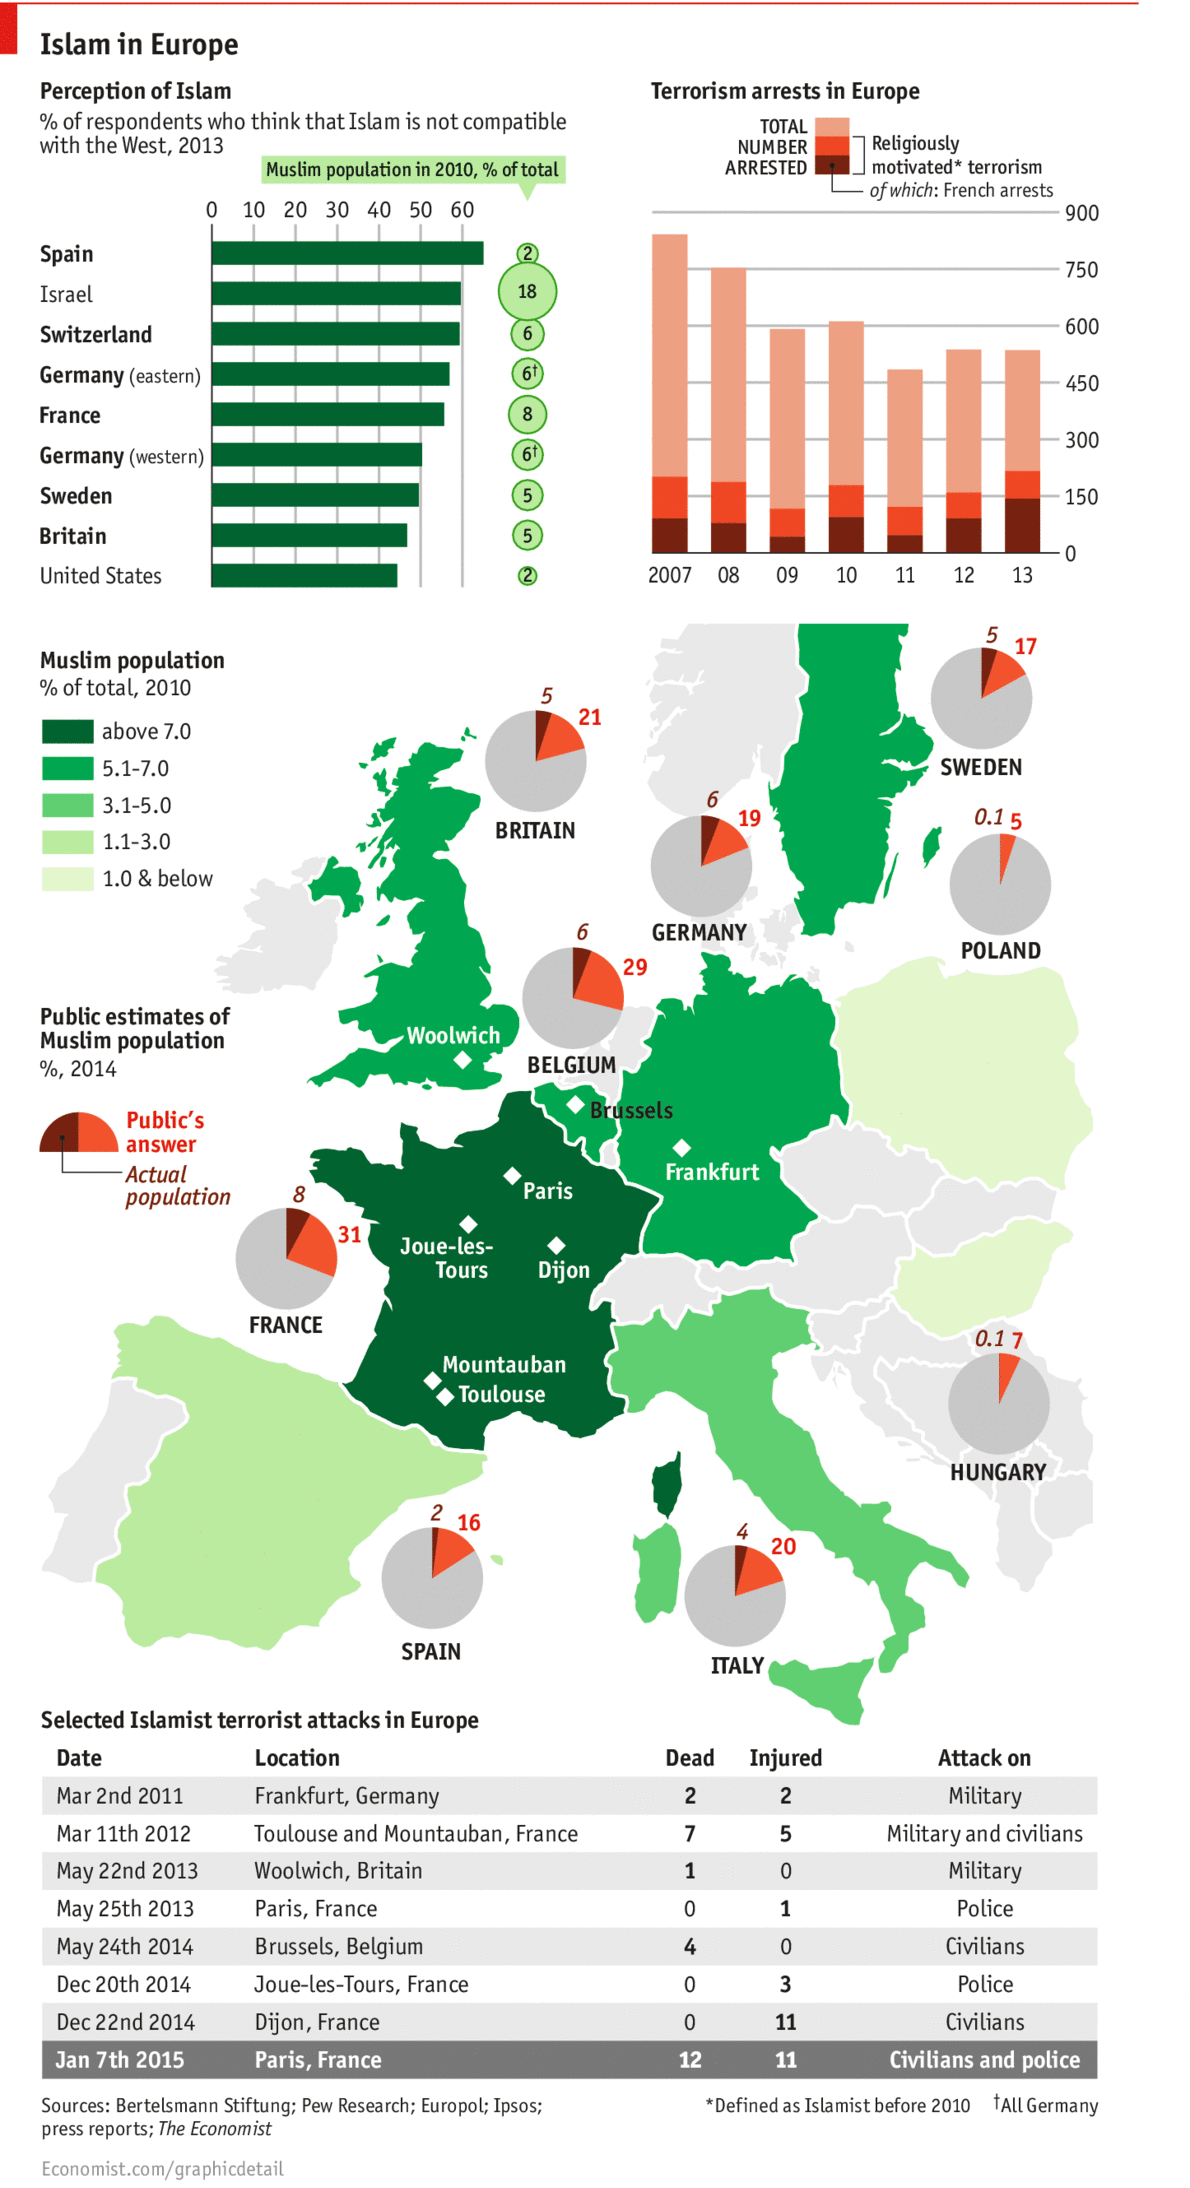
Last week’s terror attacks in Paris highlight the tension in Europe between secular Europe and those believing in Islamist values. The Economist looked at some of the available data and noted the gap between Europe’s perception of Islam and its reality. A quick figure called out for France, French respondents thought 31% of the French population to be Muslim. The reality is a mere 8%.

Perception vs reality

Credit for the piece goes to the Economist Data Team.

French Politics, Elections, and Data Visualisations.

The US is not the only country with elections in 2012. Actually quite a few other places have had them, will have them, or are in the midst of having them. The latter includes France, which had the first round of its presidential election earlier this week.

To put it simply, France has a first round to narrow the whole field to just two candidates—lots of democracies outside the US have multiple party systems that mean more than just two parties—and then a second round between the last two. Nicholas Sarkozy was thought likely to win the first round and then lose the second, but he instead lost the first outright. He still isn’t expected to do well in two weeks’ time. But, the French media of course produce infographics just as US, Canadian, and British media do. Except unlike the last three, French infographics tend to be in French and I tend to not read them because, well, I cannot.

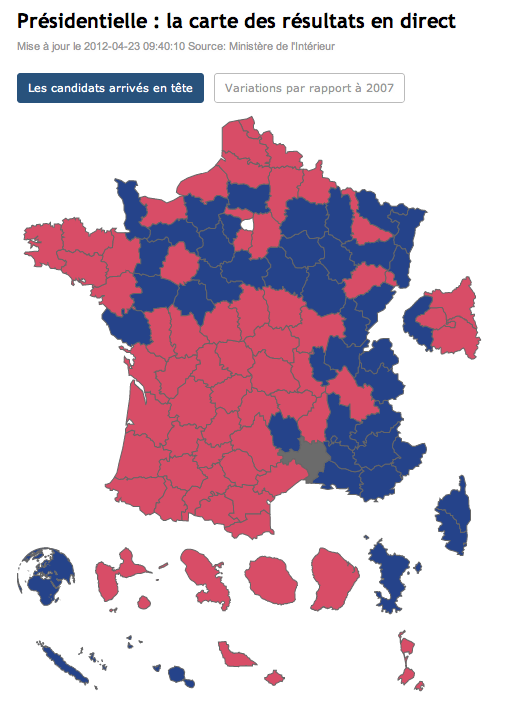
But pictures and colours make it easier. Socialists like red. Centre-right like blue.

From Le Figaro comes a map of the results. The island-looking thing on the right is Paris, beneath that Corsica, and then the bottom are the various overseas territories and departments that all vote.

Election results by French department

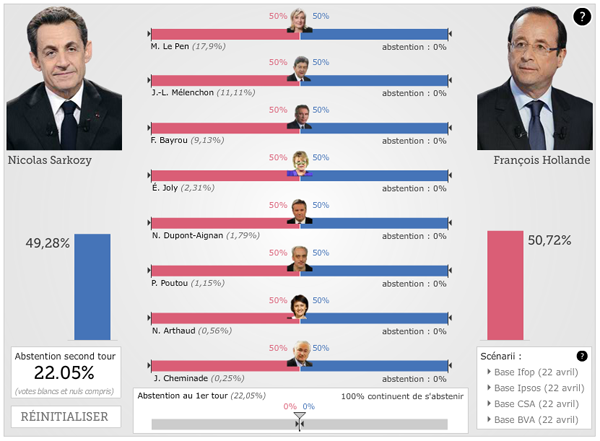
The question with French presidential elections—and in fact any country that has run-off elections—is what happens to the voters of the losers? For whom will they vote in the second round? Le Figaro also has an interactive piece that allows the user to play out different scenarios based on how many voters will not show up and of those who do, how they split their vote. Again, it’s in French, so I had to assume some things when playing around with the controls and then know a few things about French politics.

Scenario builder for Round 2

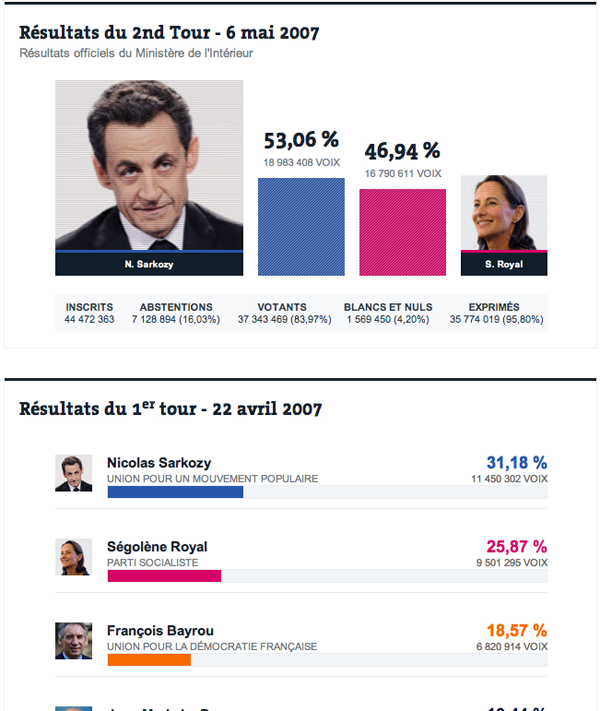
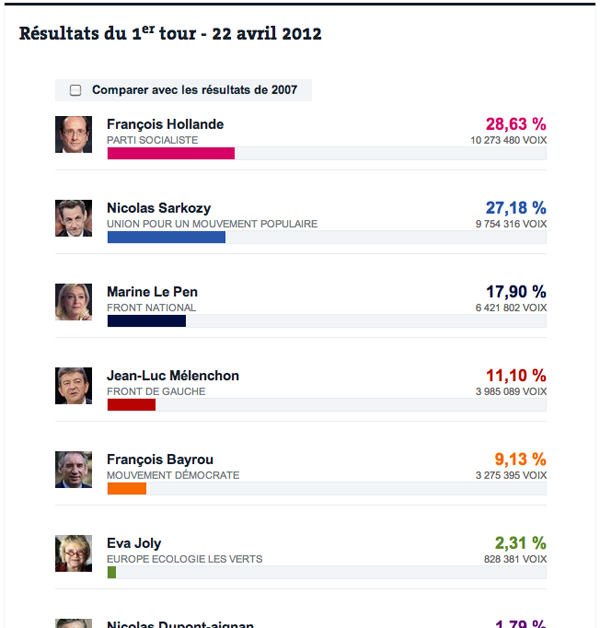
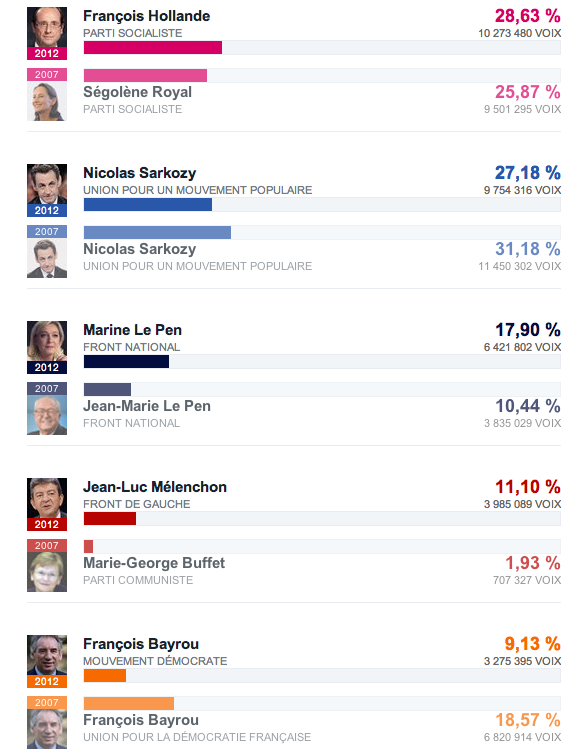
From Le Monde, another respected French media source that I have featured on more than one occasion, come some simpler visualisations of the results but with some nice features for comparison. The first is obviously a look at the 2007 results. (Anybody recall Segolene Royal? Her ex-husband/partner is Francois Hollande…the guy running for the Socialists this time round.)

Election results of 2007

But another interesting view is that of the results strictly from 2012’s first round.

Election results 2012, Round 1

But with the added feature of comparing those results per party to their performance in 2007.

Round 1 comparison, 2012 to 2007

There are always interesting things going on in politics when it comes to data visualisation and infographics. We just have to look outside the US from time to time.