There Goes the Shore

The National Oceanic and Atmospheric Administration (NOAA) released its 2022 report, Sea Level Rise Technical Report, that details projected changes to sea level over the next 30 years. Spoiler alert: it’s not good news for the coasts. In essence the sea level rise we’ve seen over the past 100 years, about a foot on average, we will witness in just thirty years to 2050.

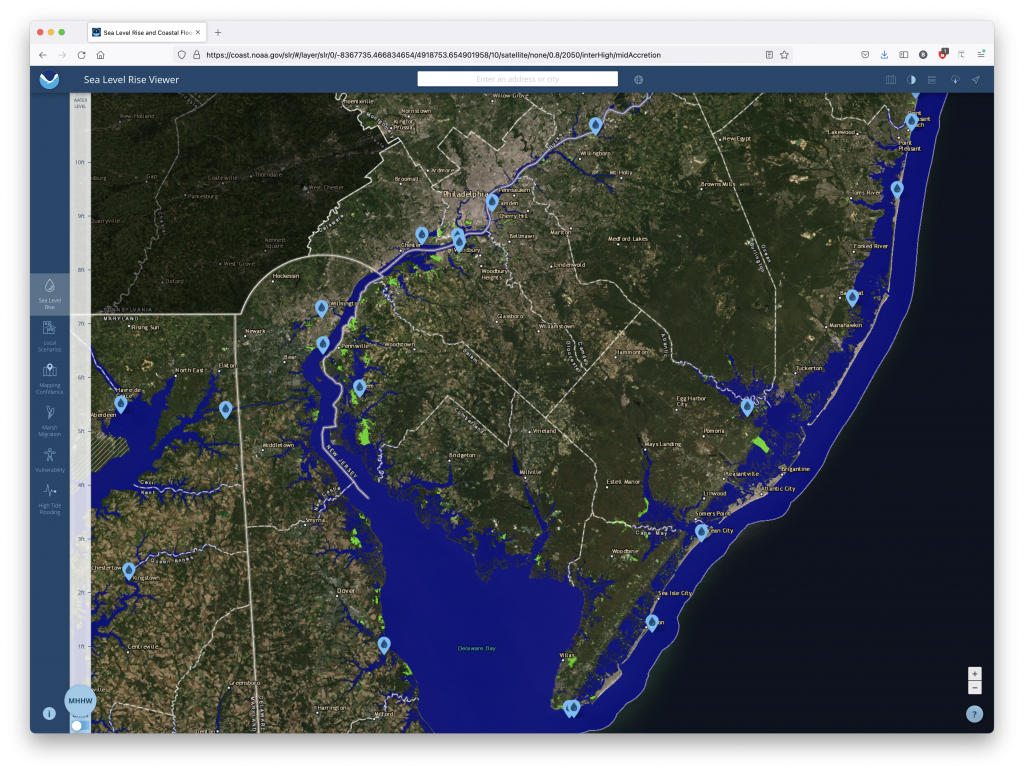
Now I’ve spent a good chunk of my life “down the shore” as we say in the Philadelphia dialect and those shore towns will all have a special place in my life. But that looks more to be like a cherished memory fading into time. I took a screenshot of the Philadelphia region and South Jersey in particular.
Not just the Shore, but also the Beaches

To be fair, that big blob of blue is Delaware Bay. That’s already the inlet to the Atlantic. But the parts that ought to disturb people are just how much blue snakes into New Jersey and Delaware, how much/little space there is between those very small ribbons of land land off the Jersey coast.

You can also see little blue dots. When the user clicks on those, the application presents the user with a small interactive popup that models sea level rise on a representative photograph. In this case, the dot nearest to my heart is that of the Avalon Dunes, with which I’m very familiar. As the sea level rises, more and more of the street behind protected by the dunes disappears.

My only real issue with the application is how long it takes to load and refresh the images every single time you adjust the zoom or change your focus. I had a number of additional screenshots I wanted to take, but frankly the application was taking too long to load the data. That could be down to a million things, true, but it frustrated me nonetheless.

Regardless of my frustration, I do highly recommend you check out the application, especially if you have any connection to the coast.

Credit for the piece goes to NOAA.

How Accurate Is Punxsutawney Phil?

For those unfamiliar with Groundhog Day—the event, not the film, because as it happens your author has never seen the film—since 1887 in the town of Punxsutawney, Pennsylvania (60 miles east-northeast of Pittsburgh) a groundhog named Phil has risen from his slumber, climbed out of his burrow, and went to see if he could see his shadow. Phil prognosticates upon the continuance of winter—whether we receive six more weeks of winter or an early spring—based upon the appearance of his shadow.

But as any meteorological fan will tell you, a groundhog’s shadow does not exactly compete with the latest computer modelling running on servers and supercomputers. And so we are left with the all important question: how accurate is Phil?

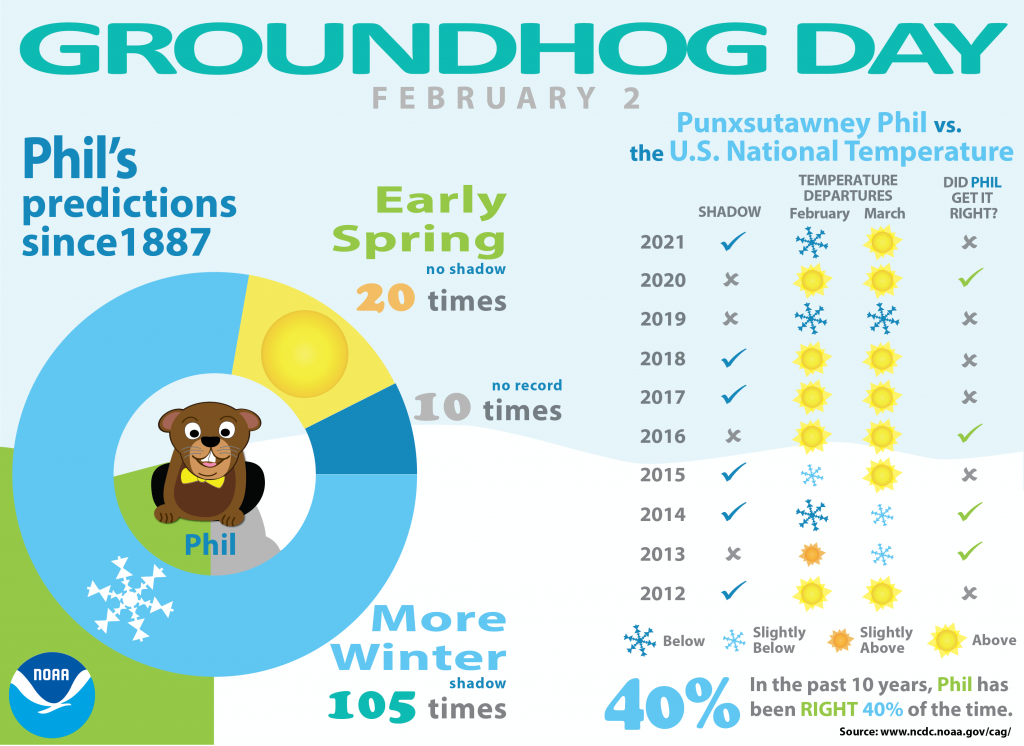
Thankfully the National Oceanic and Atmospheric Administration (NOAA) published an article several years ago that they continue to update. And their latest update includes 2021 data.

Not exactly an accurate depiction of Phil.

I am loathe to be super critical of this piece, because, again, relying upon a groundhog for long-term weather forecasting is…for the birds (the best I could do). But critiques of information design is largely what this blog is for.

Conceptually, dividing up the piece between a long-term, i.e. since 1887, and a shorter-term, i.e. since 2012, makes sense. The long-term focuses more on how Phil split out his forecasts—clearly Phil likes winter. I dislike the use of the dark blue here for the years for which we have no forecast data. I would have opted for a neutral colour, say grey, or something that is visibly less impactful than the two light colours (blue and yellow) that represent winter and spring.

Whilst I don’t love the icons used in the pie chart, they do make sense because the designers repeat them within the table. If they’re selling the icon use, I’ll buy it. That said, I wonder if using those icons more purposefully could have been more impactful? What would have happened if they had used a timeline and each year was represented by an icon of a snowflake or a sun? What about if we simply had icons grouped in blocks of ten or twenty?

The table I actually enjoy. I would tweak some of the design elements, for example the green check marks almost fade into the light blue sky. A darker green would have worked well there. But, conceptually this makes a lot of sense. Run each prognostication and compare it with temperature deviation for February and March (as a proxy for “winter” or “spring”) and then assess whether Phil was correct.

I would like to know more about what a slightly above or below measurement means compared to above or below. And I would like to know more about the impact of climate change upon these measurements. For example, was Phil’s accuracy higher in the first half of the 20th century? The end of the 19th?

Finally, the overall article makes a point about how difficult it would be for a single groundhog in western Pennsylvania to determine weather for the entire United States let alone its various regions. But what about Pennsylvania? Northern Appalachia? I would be curious about a more regionally-specific analysis of Phil’s prognostication prowess.

Credit for the piece goes to the NOAA graphics department.

It’s Warm Out Here Isn’t It?

I could have covered the pieces on Gorsuch or the budget—and we will get to those—but I wanted to cover some data released by the World Meteorological Organisation that puts 2016 as the warmest year on record.

But that’s cool, climate change is a hoax.

January was warm
January was warm

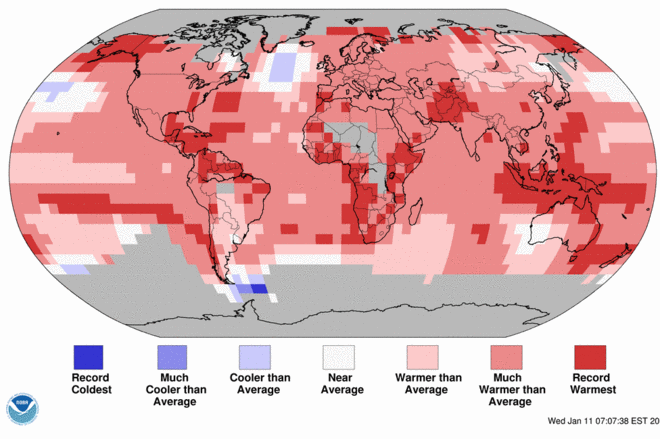
The graphic comes from a BBC article covering the news, and is a reuse of work from the National Oceanian and Atmospheric Administration. It portrays how much this past January deviated from long-term averages. Because, and I am probably preaching to the choir, remember that day-to-day highs, lows, and precipitation are weather. Longer term trends, patterns, and averages are evidence of climate.

Just so happens that today is also supposed to be the warmest day of the week here in Philadelphia.

Credit for the piece goes to NOAA.