Comparing the US Healthcare System to the World

Spoiler, we don’t look so great.

In this piece from the Guardian, we have one of my favourite types of charts. But, the piece begins with a chart I wonder about. We have a timeline of countries creating universal healthcare coverage, according to the WHO definition—of which there are only 32 countries. But we then plot their 2016 population regardless of when the country established the system. It honestly took me a few minutes to figure out what the chart was trying to communicate.
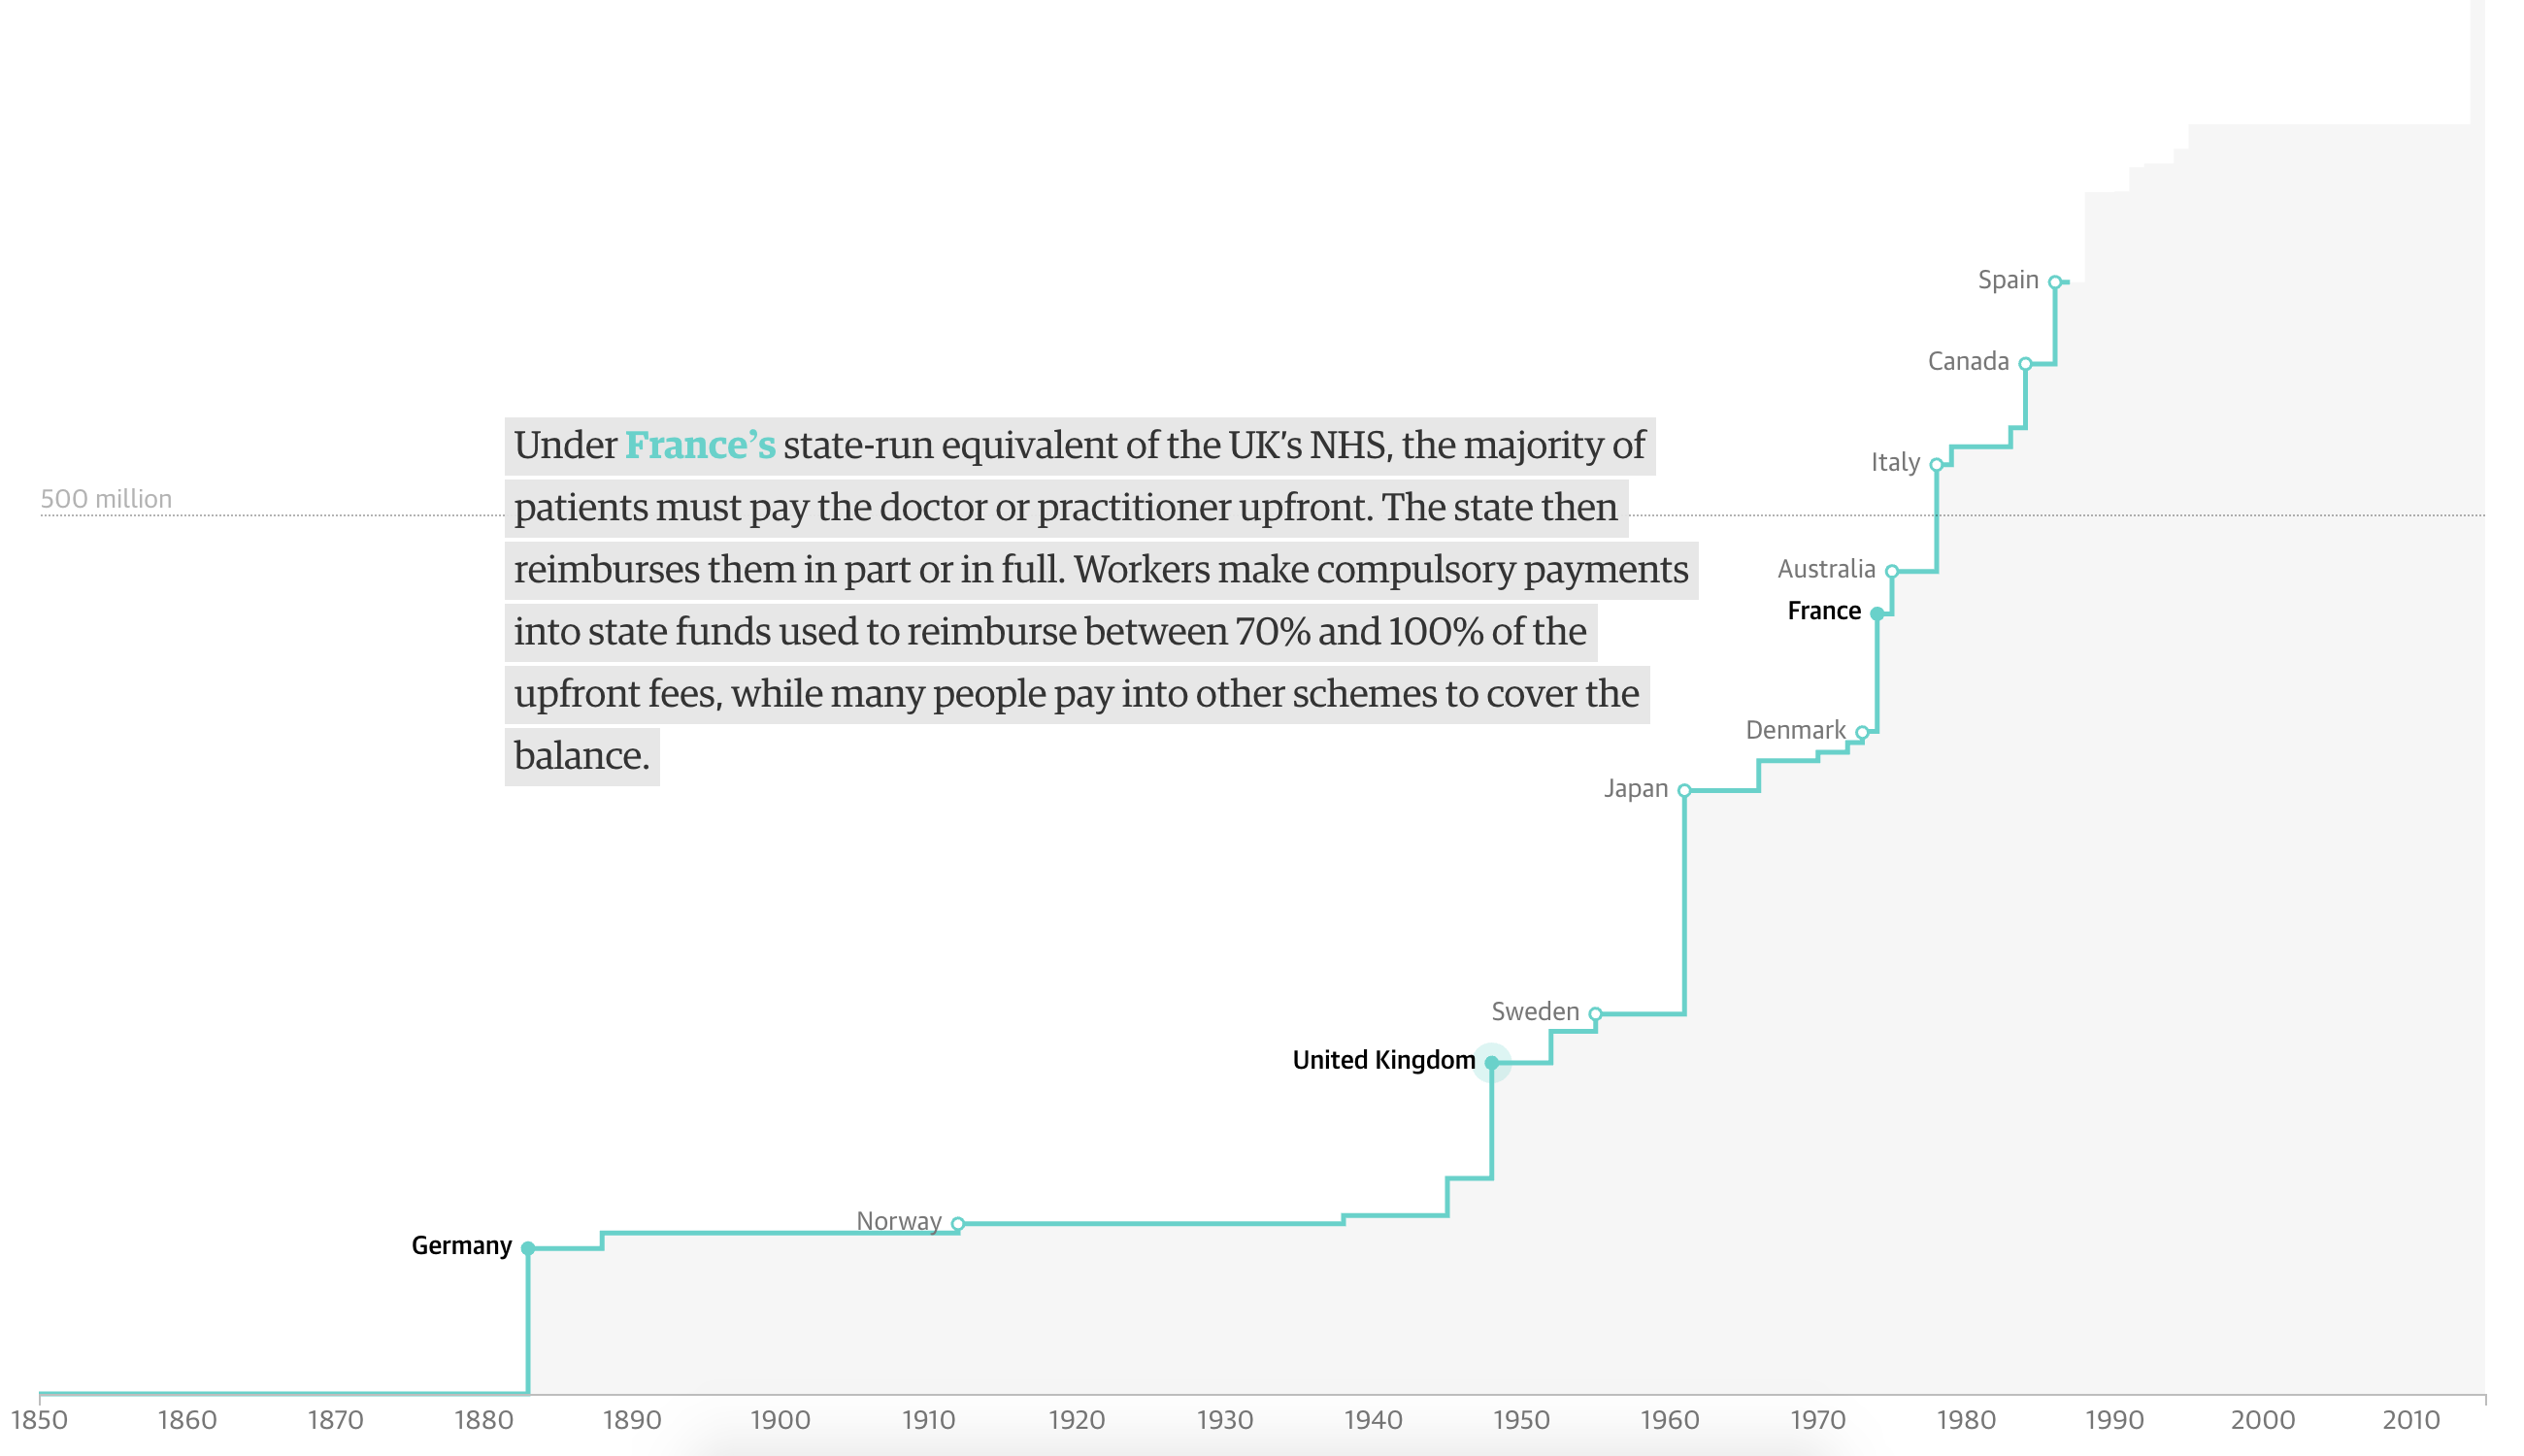
This is the only graphic I'm not sure of in the entire piece.
This is the only graphic I’m not sure of in the entire piece.

However, we do get one of my favourite charts: the scatter plot over time. And in it we look at the correlation between spending on healthcare compared to life expectancy. And, as I revealed in the spoiler, for all the money we spend on healthcare—it is not leading to longer lives as it broadly does throughout the world. And care as you might want to blame Obamacare, the data makes clear this problem began in the 1980s.
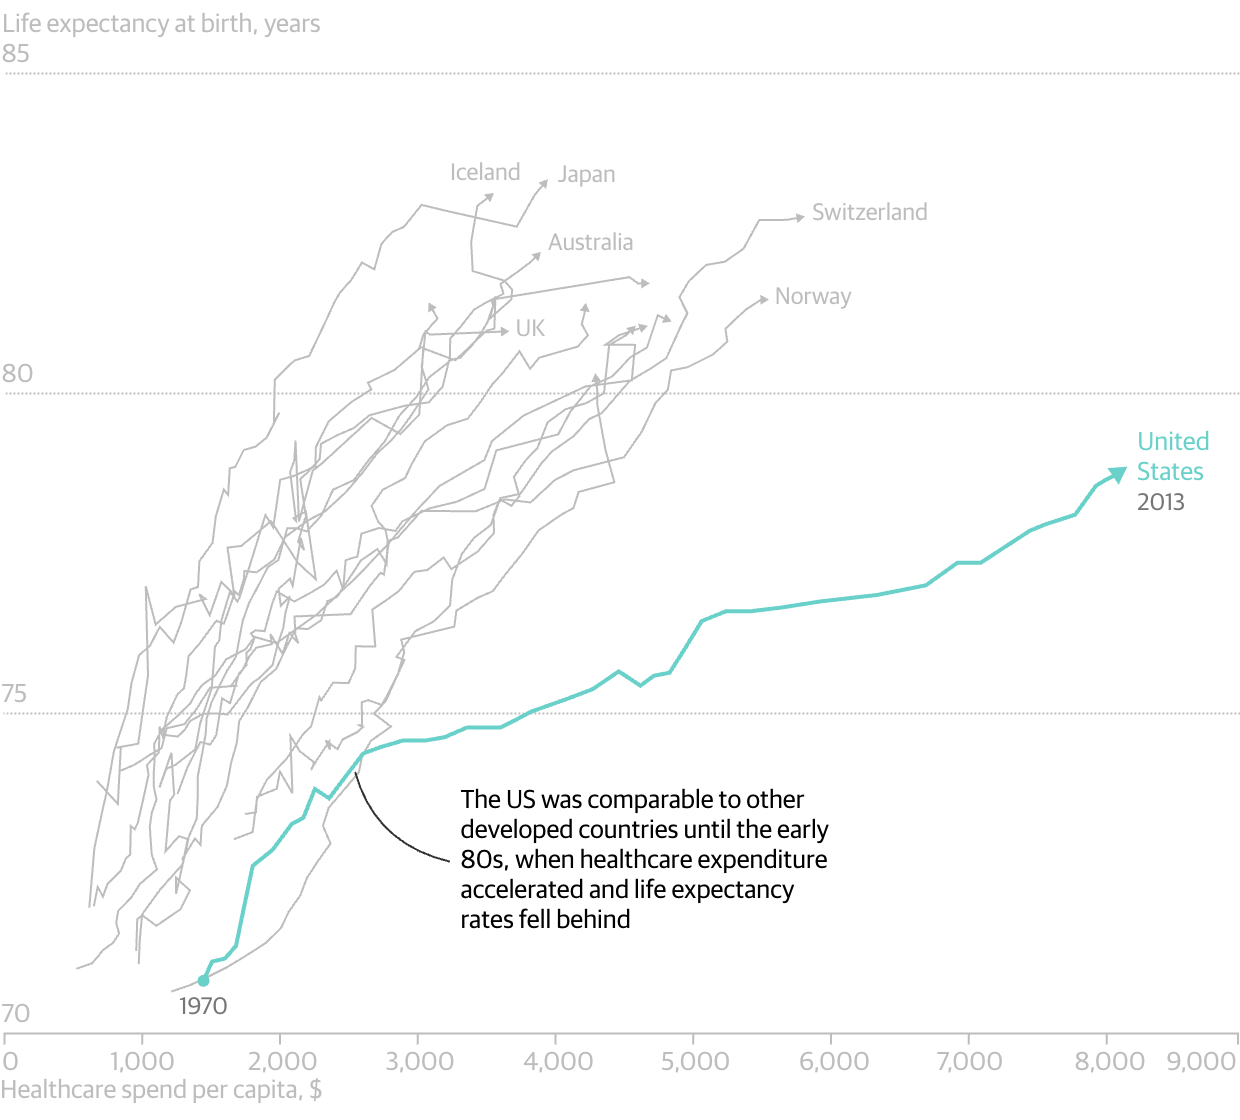
Someone's getting cheated out of a lot of money. Oh wait, that's us…
Someone’s getting cheated out of a lot of money. Oh wait, that’s us…

And of course Obamacare is why the Guardian published this piece since this is the week of the Vote-a-rama that we expect to see Thursday night. The Republicans will basically be holding an open floor to vote on anything and everything that can get some measure of repeal and/or replace 50 votes. And to wrap the piece, the Guardian concludes with a simple line chart showing the number of uninsured out to 2026. To nobody’s surprise, all the plans put forward leave tens of millions uncovered.
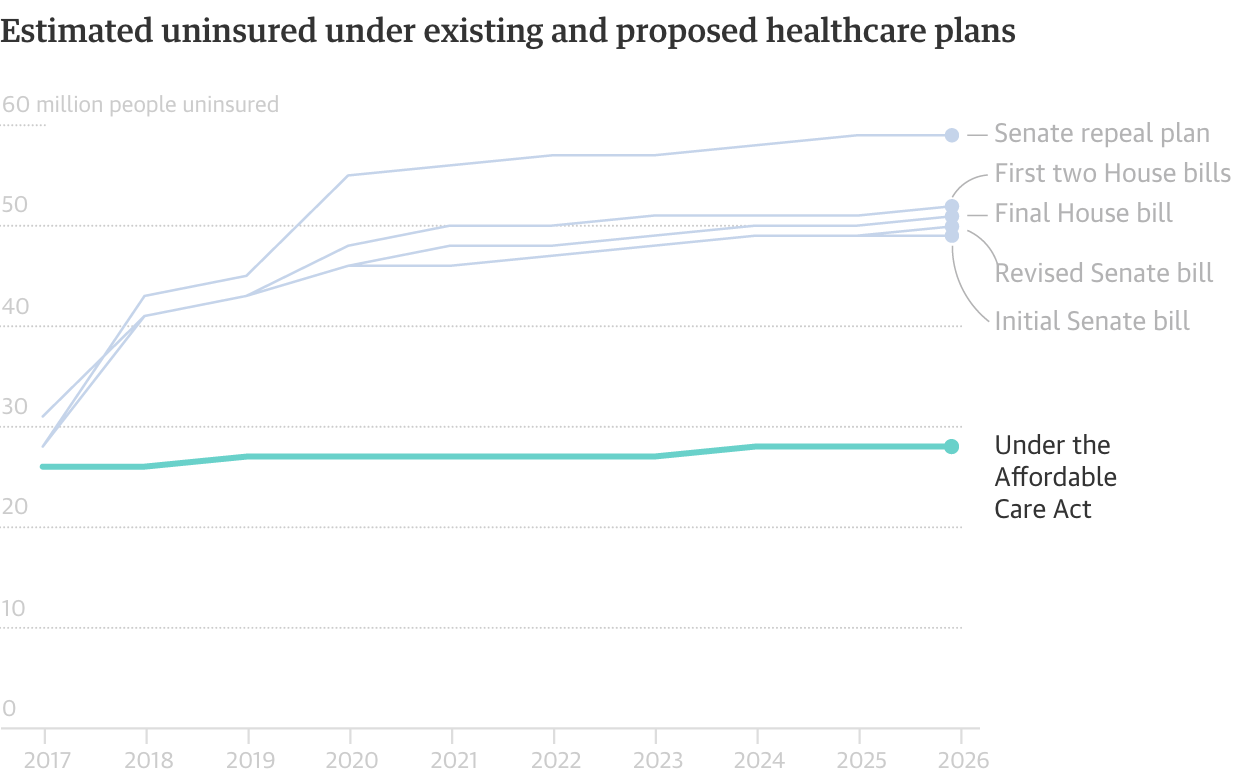
When all the options look bad, why not work with what you have?

It is a fantastic piece that is well worth the read, especially because it compares the systems used by a number of countries. (That is largely the text bit that we do not cover here at Coffeespoons.) I found the piece very informative.


Credit for the piece goes to the Guardian graphics department.

Here We Go Again

Well as of last night, we are having yet another vote on AHCA, better known as Trumpcare. I will not get into the details of the changes, but basically it can be summed up as waivers for Obamacare regulations. And as of last night, $8 billion over five years to cover those at high-risk. What about after five years? What if, as experts say, that sum is insufficient and it runs out before five years are up?

This is still a bad bill.

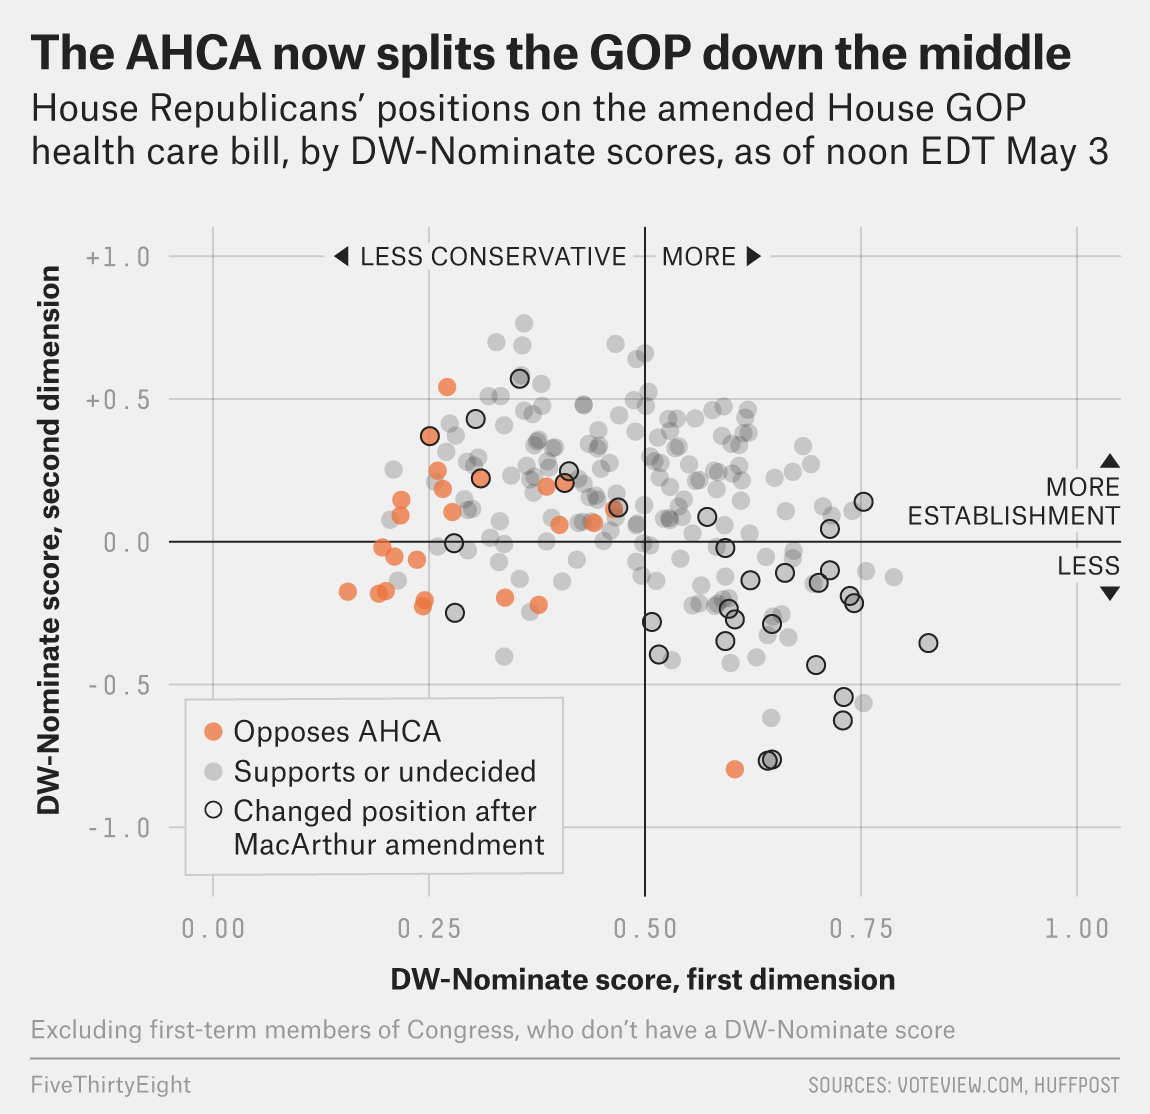
But thankfully we have FiveThirtyEight who looked at support before the Upton amendment—the $8 billion bit—and found that the bill could still fail because of a lack of moderate support.

Round and round we go

The basic premise is this: In order to get the conservative Freedom Caucus, which scuppered the bill a few weeks ago, on side Ryan et al. had to make the bill more conservative. They likely had to make it cover fewer people at a higher cost. I say likely because Ryan is not sending this to the Congressional Budget Office (CBO) to score the bill, something typically done to see how much it costs and whether it might work. Problem is, by making the bill more conservative, they push away moderate Republicans. Yes, Virginia, they do exist.

Today’s question is whether an $8 billion throw-in will buy in enough moderate votes.

It’s going to be a long day.

Credit for the piece goes to Harry Enten.

Those Who Will Lose Subsidies for Trumpcare

As much as I like trains…we need to get back to Trumpcare. As you probably know, it will cover fewer people than Obamacare. Just how many fewer people? Somewhere in the ten to twenty million range. The poor, the elderly, and the sick are those who will be worse off. Because the poor, the elderly, and the sick are the ones who clearly do not need healthcare. Higher-income young people, your subsidies are about to go up.

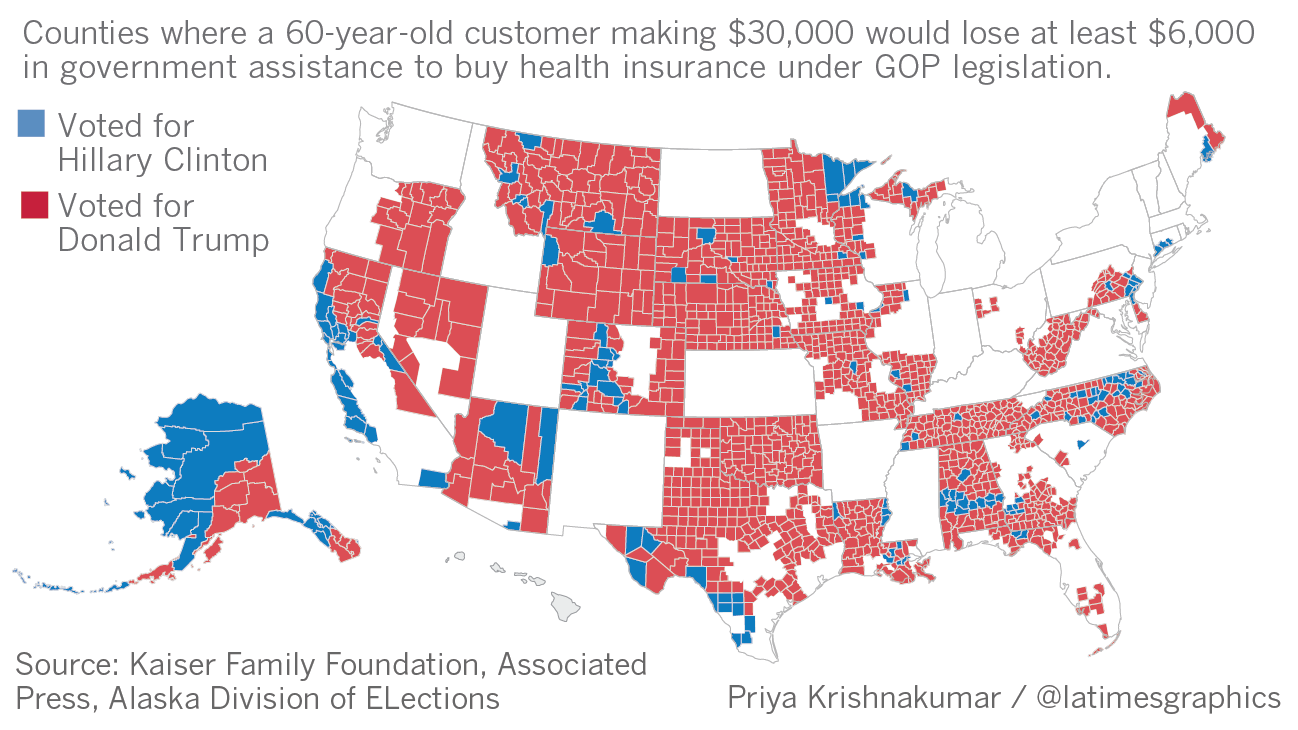
But I digress, the Los Angeles Times looked at county electoral and tax data to see just where the pain falls geographically, and more importantly where it falls politically. So they took a look specifically at the bracket that will be hurt the most: the poor and elderly, 60 and earning $30,000.

Trump won the vast majority of counties that will be hardest hit

Well, it looks like all those people who voted against the idea of Obamacare just voted themselves to get even less assistance. Trumpcare’s going to be great, guys. Unless you’re old. Or poor. Or sick.

Credit for the piece goes to Priya Krishnakumar.

How Trumpcare Differs from Obamacare

We are going to have a busy week this week. From the CBO release on Trumpcare costs and coverage to the elections in the Netherlands. Oh, and it might snow a wee bit here in Philadelphia and the East Coast. So let’s dive straight into today’s post, an article all the way from the West Coast and the LA Times.

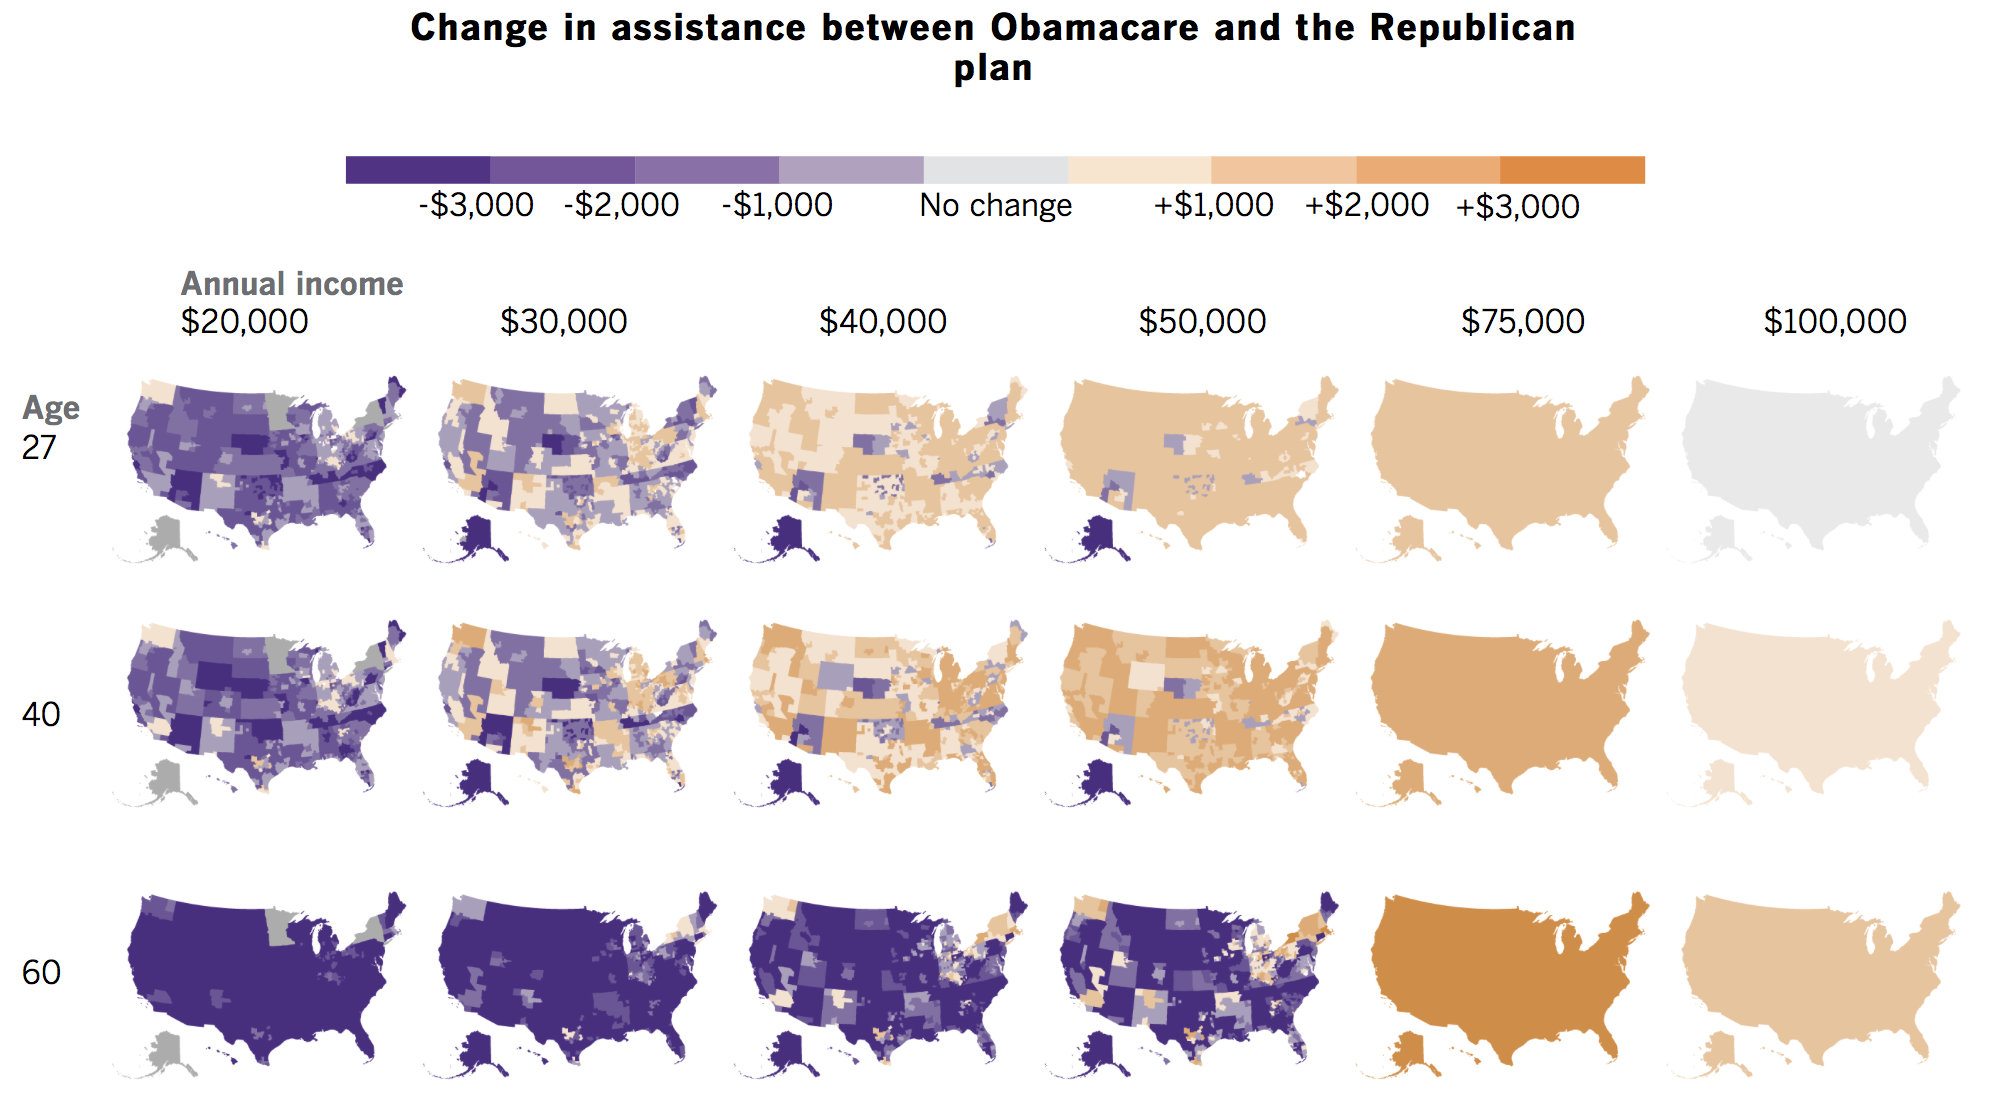
It looks at a comparison between Trumpcare and Obamacare.

How the changes affect the young, middle-aged, and the elderly by income level

The clearest takeaway is that they are using some pretty good colours here. Because purple.

But in all seriousness, the takeaway from this graphic is that Trumpcare as proposed will cost more for the poor and the elderly. And it will cost especially more for those who live in rural and more isolated areas. And that basically comes down to the fact that Trumpcare will not factor in the local cost of insurance, which generally costs more in non-urban areas.

But for the fullest understanding of the differences, you should read the full piece as it offers a point-by-point comparison.

Credit for the piece goes to Noam N. Levey and Kyle Kim.