Thomas the Tank Engine, Meet Señor Jose AVE

This comes from an older article in the Philadelphia Inquirer, but it is new to me. Anyway, it looks at a proposal for high-speed rail in the United States, specifically along the Northeast Corridor, the Washington to Boston route that includes Baltimore, Wilmington, Philadelphia, and New York. Anyway, go figure that we still have trains that run at a snail’s pace, even Acela has a low average-speed.
Comparing Routes and Modes of Travel

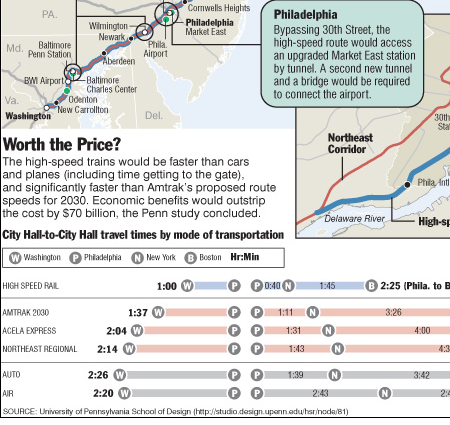
A proposal from a group out of Penn makes for an interesting debate, specifically in Philly a real high-speed route would require boring underneath most of Philadelphia to bypass 30th Street. Perhaps revitalising Market East—depending on how exactly the route would interact with the commuter tunnel currently in place.

The graphics are simple, basically an annotated map. But the variations in stroke weight and colour help bring contrast to the routes when looking at the entire proposal whereas the proposed route in Philadelphia has little overlap and could have made due with a single stroke. Another interesting piece is beneath in the comparison between travel times from Washington to Philadelphia, from Philly to New York, and New York to Boston. Without looking at cost—thought the article’s second page or graphics does that—we can clearly see that a dedicated high-speed rail system would make it even easier to travel between cities for short holidays or even day trips. Let alone business trips.

Clerks. And Not the Death Star Discussing Type.

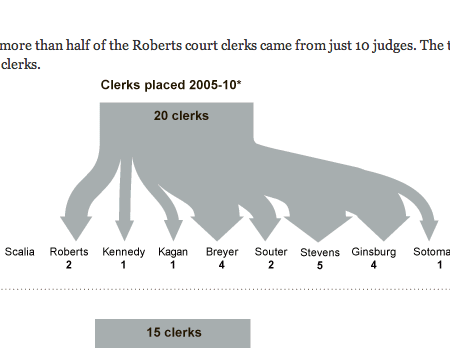
The New York Times has a story about the clerks supporting the Supreme Court justices. And how, surprisingly, the Supreme Court is polarised. Truly surprising considering how unpolarised—or would it be depolarised—the remaining two branches of government are these days. Sarcasm aside, the staff at the Times put together a diagram to explain the polarity.

Where all the clerks go

My only real concern, however, is the potential for an audience disconnect. While you and I may know who John Marshall and William Brennan are, would the rest of the infographic’s readers? Does that mean not to include the justices? Personally, I always believe that design should lift and educate people and that designers should always avoid ‘dumbing things down’ for their audiences. Maybe not having the information in the diagram helps, and it will spur casual readers to do their own research. Or perhaps the targeted audience are those who have a grasp of the history of the Supreme Court.

Show Me Some Love

(Based on a news story, this is sort of a non-designy post. More of a ranty post. So I beg your leave for a couple of words or two.)

I love Philadelphia. I wish I could say I was born and raised there, but I was born in the Lehigh Valley and raised in Chester County. But, I went there a lot. And then eventually went to university there. Like any city, it has its pros and cons. One of the cons, for me, was its creative economy. Or seeming lack thereof. (Hence the whole Chicago thing). With New York only a few miles up the road, most people head there. But there are still creative people living in Philly. And if they are anything like the whole youngish, 21st centuryish generation, they are probably blogging.

So seriously, Philly, what is with the blogging tax? Yeah, I know it is only on those blogs generating income (principally through ads). But I mean you already have the wage tax. How much more do you need to stifle innovation?

If Kites Could Fly to the Future, What Would They Find?

If only Benjamin could see this…

The Control Room
The Control Room

These are photographs from a small series published by CNET that focuses on a power grid control room. As one can imagine, managing the flow of electrical energy across somewhere the size of New England could be a bit…complicated. And so one can see from some kind of network map (perhaps?) on the main display. At the very least I can make no sense of it.

Voltage Map (right) and Monitor of Neighbouring Power Grid (left)
Voltage Map (center) and Monitor of Neighbouring Power Grid (left)

On the other hand, I only wonder what would happen if Homer were sitting behind a bank of those monitors?

Photographs by Martin LaMonica, CNET

It’s Hard to be a Saint in Hell

Perhaps the 21st century version of the Pentagon papers, the ‘War Logs’, as they are being called, consist of some 90,000 classified documents centring on the Afghanistan War. While they do not paint a necessarily different picture from what is known publicly, the War Logs do provide interesting glimpses into the war, a war that, like any other, is a messy and ugly business despite the polish of design, propaganda, and the media.  To put it differently and perhaps in another sense, the War Logs offer depth down to the ground-level, unpleasant details of warzone combat. But the documents lack an overall, strategic-level—I daresay antiseptic—breadth of understanding. The War Logs suffer from a lack of the broader context—but they do provide useful and interesting stories, vignettes, and anecdotes that flesh out the story we all broadly know.

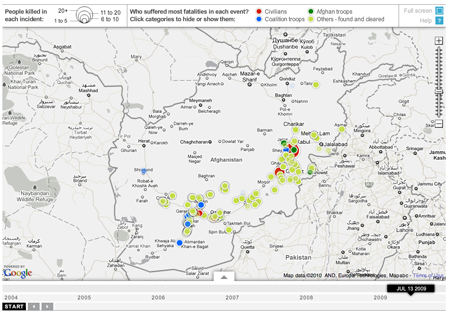
The Guardian is one of three main newspapers that received the leaks in advance; the others were the New York Times and Germany’s Der Spiegel. And one of the things the Guardian did was create an interactive piece exploring improvised explosive devices (IEDs) and where and when they occurred in Afghanistan from 2004 to 2010.

While I understand the use of Google maps, I always see the map as a distraction. For example, why in a story about Afghanistan do I need to see a map that includes the small cities of India. To some degree, the same can be said about the bordering countries like Iran and Pakistan—but as those countries are along the border and are to varying degrees involved in the action, their inclusion can be understood on a case-by-case basis.

Guardian Piece on IEDs

Choice of map aside, the piece  highlights the detonation of IEDs as circles whose area reflects the number of casualties. The colour of each circle represents which ‘group’ of people had the most casualties: civilians, Coalition soldiers, or Afghan soldiers. However, by reducing the data to a single circle of a single colour, we lose the potential added depth of breaking down the event into the deaths of soldiers and civilians alike. Do I have an instant solution on hand? No. But I do note that if one clicks on the specific event, a window appears that breaks down the event into said figures.

One of the more interesting things about this whole story is that at least the Guardian is putting out the data as a spreadsheet. Perhaps in the near to intermediate future those with the time and inclination will take that information and make something truly interesting for the public’s consumption.

Won’t You Be My Neighbour

The BBC has an article about the massiveness of Facebook—at least in the United States. They have taken the data and spent time to do a little bit of visualisation. It is worth a look; the design is not perfect but acceptable in a broad sense.

Social Networking Usage

Poor MySpace.

Rules Exist for a Reason

(and when I learn that reason, I shall let you know)

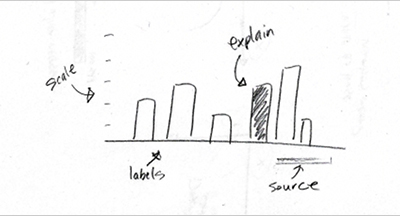
FlowingData has an interesting post today. It is less about an awesome graphic and more about the best practices of creating, well, an awesome graphic. Largely it makes sense. Learn the rules. And then learn how people break them. And then when you should break them.

A Hand Drawn Chart. Of Something Important.

The Name’s Bond…

The Washington Post has released an in-depth article, or series of articles, about the intelligence community of the United States and its growth since 11 September 2001. There are several visualisations of data and relationships between government agencies and companies along with a video introduction and, well, a traditional written article or two.

A Screenshot of an Interactive Piece of the Article

Overall, the piece is quite interesting to look through—although I have not yet had the time to do just that. Some of the visualisations appear a bit thin. But, that may be just because I have not yet had time to play with them enough to draw out any particular insights.

What is nice, however, is again having visualisations supporting editorial content in such a fashion.

Damn the Torpedoes…We’ll Just Use Our Fists

A brief bit of background before I begin, a few months ago, a South Korean warship, a corvette, was sunk in waters claimed by both South Korea and North Korea. And technically speaking, the Korean War has never ended and the two countries remain at war. An independent commission studied the situation and determined that a North Korean submarine sank the ship with a torpedo. It did not help North Korea that North Korean markings were found on the remnants of a torpedo not far from the submerged wreckage.

Regardless, North Korea claimed innocence and the case went before the United Nations. The UN expressed, per usual, its toothless displeasure at the entire affair and everything has since sort of faded away—at least here in the United States it has. However, apparently somebody has smuggled a poster out of North Korea that hints at responsibility. According to the article, the text in the poster reads “If they attack, we will smash them in a single blow”.

North Korean Propaganda Poster

photo uncredited, via the New York Times

I just found it fascinating that in 2010 we can still see good, old-fashioned propaganda posters. Even if we can only get them smuggled out of North Korea.

Money

This is not strictly related to information design or maps or any such things, however, India has adopted a new symbol for their currency, the rupee. The symbol joins the dollar, the pound, the euro, and the yen in having a special symbol. According to the article in the New York Times, adding the symbol to unicode will take some time. But when it eventually happens I will probably have to learn a new shortcut.

New Rupee Symbol and Its Designer

Photo is from the Associated Press via the article.