Flowing Lava and Layers

I didn’t have the internet yesterday morning, so apologies for no posting. But at least it was back by the afternoon. Unlike utilities in La Palma, where a volcano has been erupting and lava flowing, covering parts of the island.

The BBC had a brief article last week detailing the spread of the lava, which has been devastating the town. And it was a neat little graphic that I really liked.
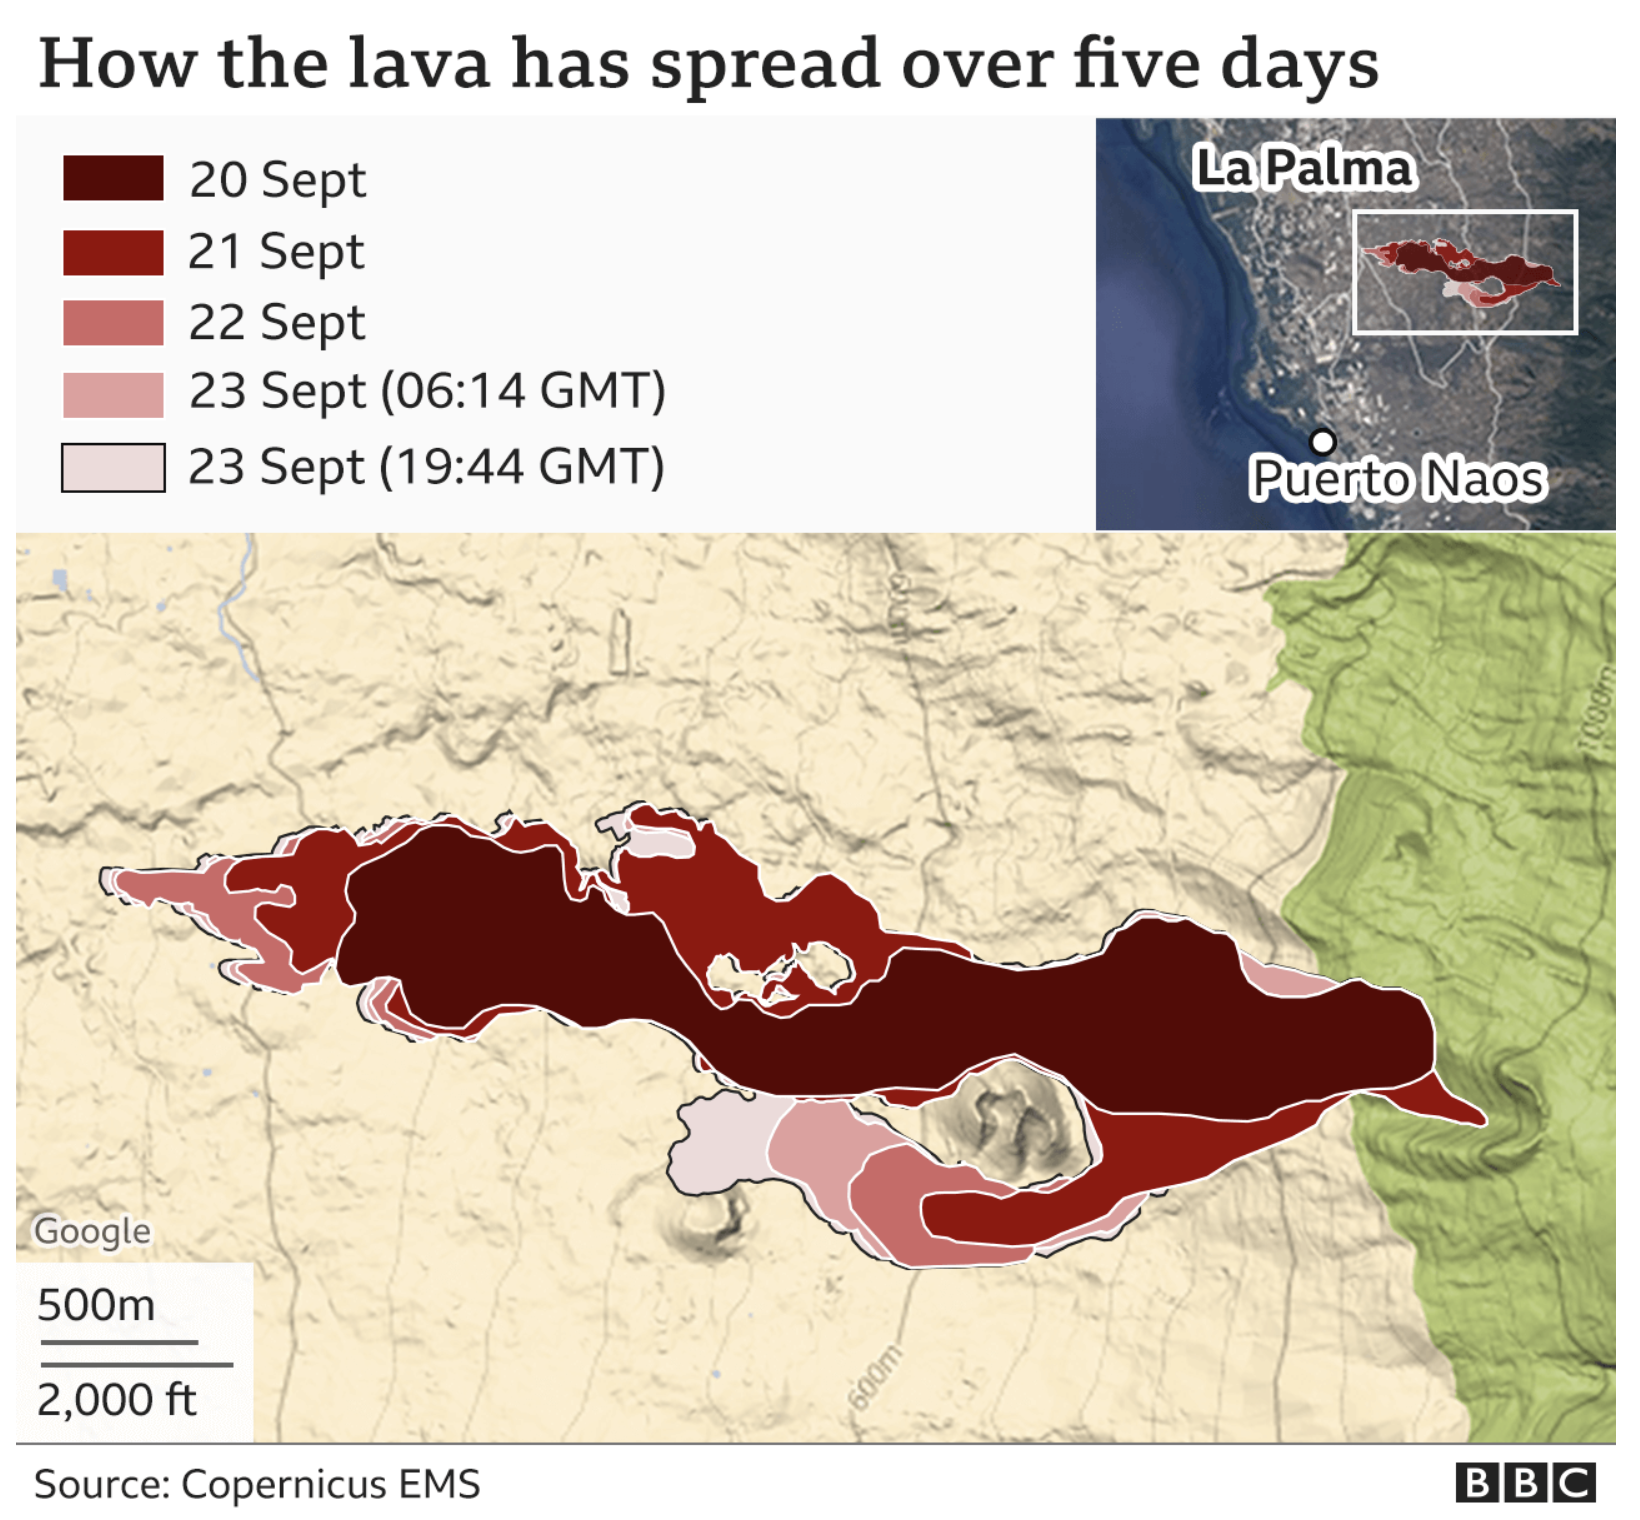
At least it doesn’t move super quickly?

This graphic does a couple of things that I really like. First, context. Yes, the main graphic is the actual spread over four days (the fifth layer is almost half-a-day later). But in the upper-right corner, we have the same graphic layered over a satellite image of the region. I’m not sure how I feel about the satellite image, but overall it does provide a sense of scale.

Because the second thing I like is how the larger map shows not a satellite view, but rather a topographic or terrain view. The lines represent points of continuous height and help explain why the lava flow looks the way it does. The drawback here is that you don’t get any sense of urban development, like streets or neighbourhoods impacted. For that you could often use a satellite image, but then the colours and their saturation could detract from the importance of the graphical element, the lava flow layers.

Finally for the layers, I like the stepped gradients of the dark reds. This makes the sequential flow very clear. My only quibble might be the stroke or border on the shape. You can see that for all but the final shape, the stroke is a thin white line. But because those layers are stacked in reverse order—or else you would only be able to see the last layer, the most distant spread—the white stroke often overlaps and hides the black stroke for the final day.

Here I would recommend taking the five layers, duplicating them then merging them into a single sixth shape that sits atop the original five layers. I would eliminate the fill colour from the shape and then put the outline to black, that way the final borders of the lava flow in the graphic could be seen for the entirety of the flow.

But overall, this was a really nice piece that provides a lot of context to the lava flow.

Credit for the piece goes to the BBC graphics department.

Natural Disasters

Today’s piece is another piece set against a black background. Today we look at one on natural disasters, created by both weather and geography/geology alike.

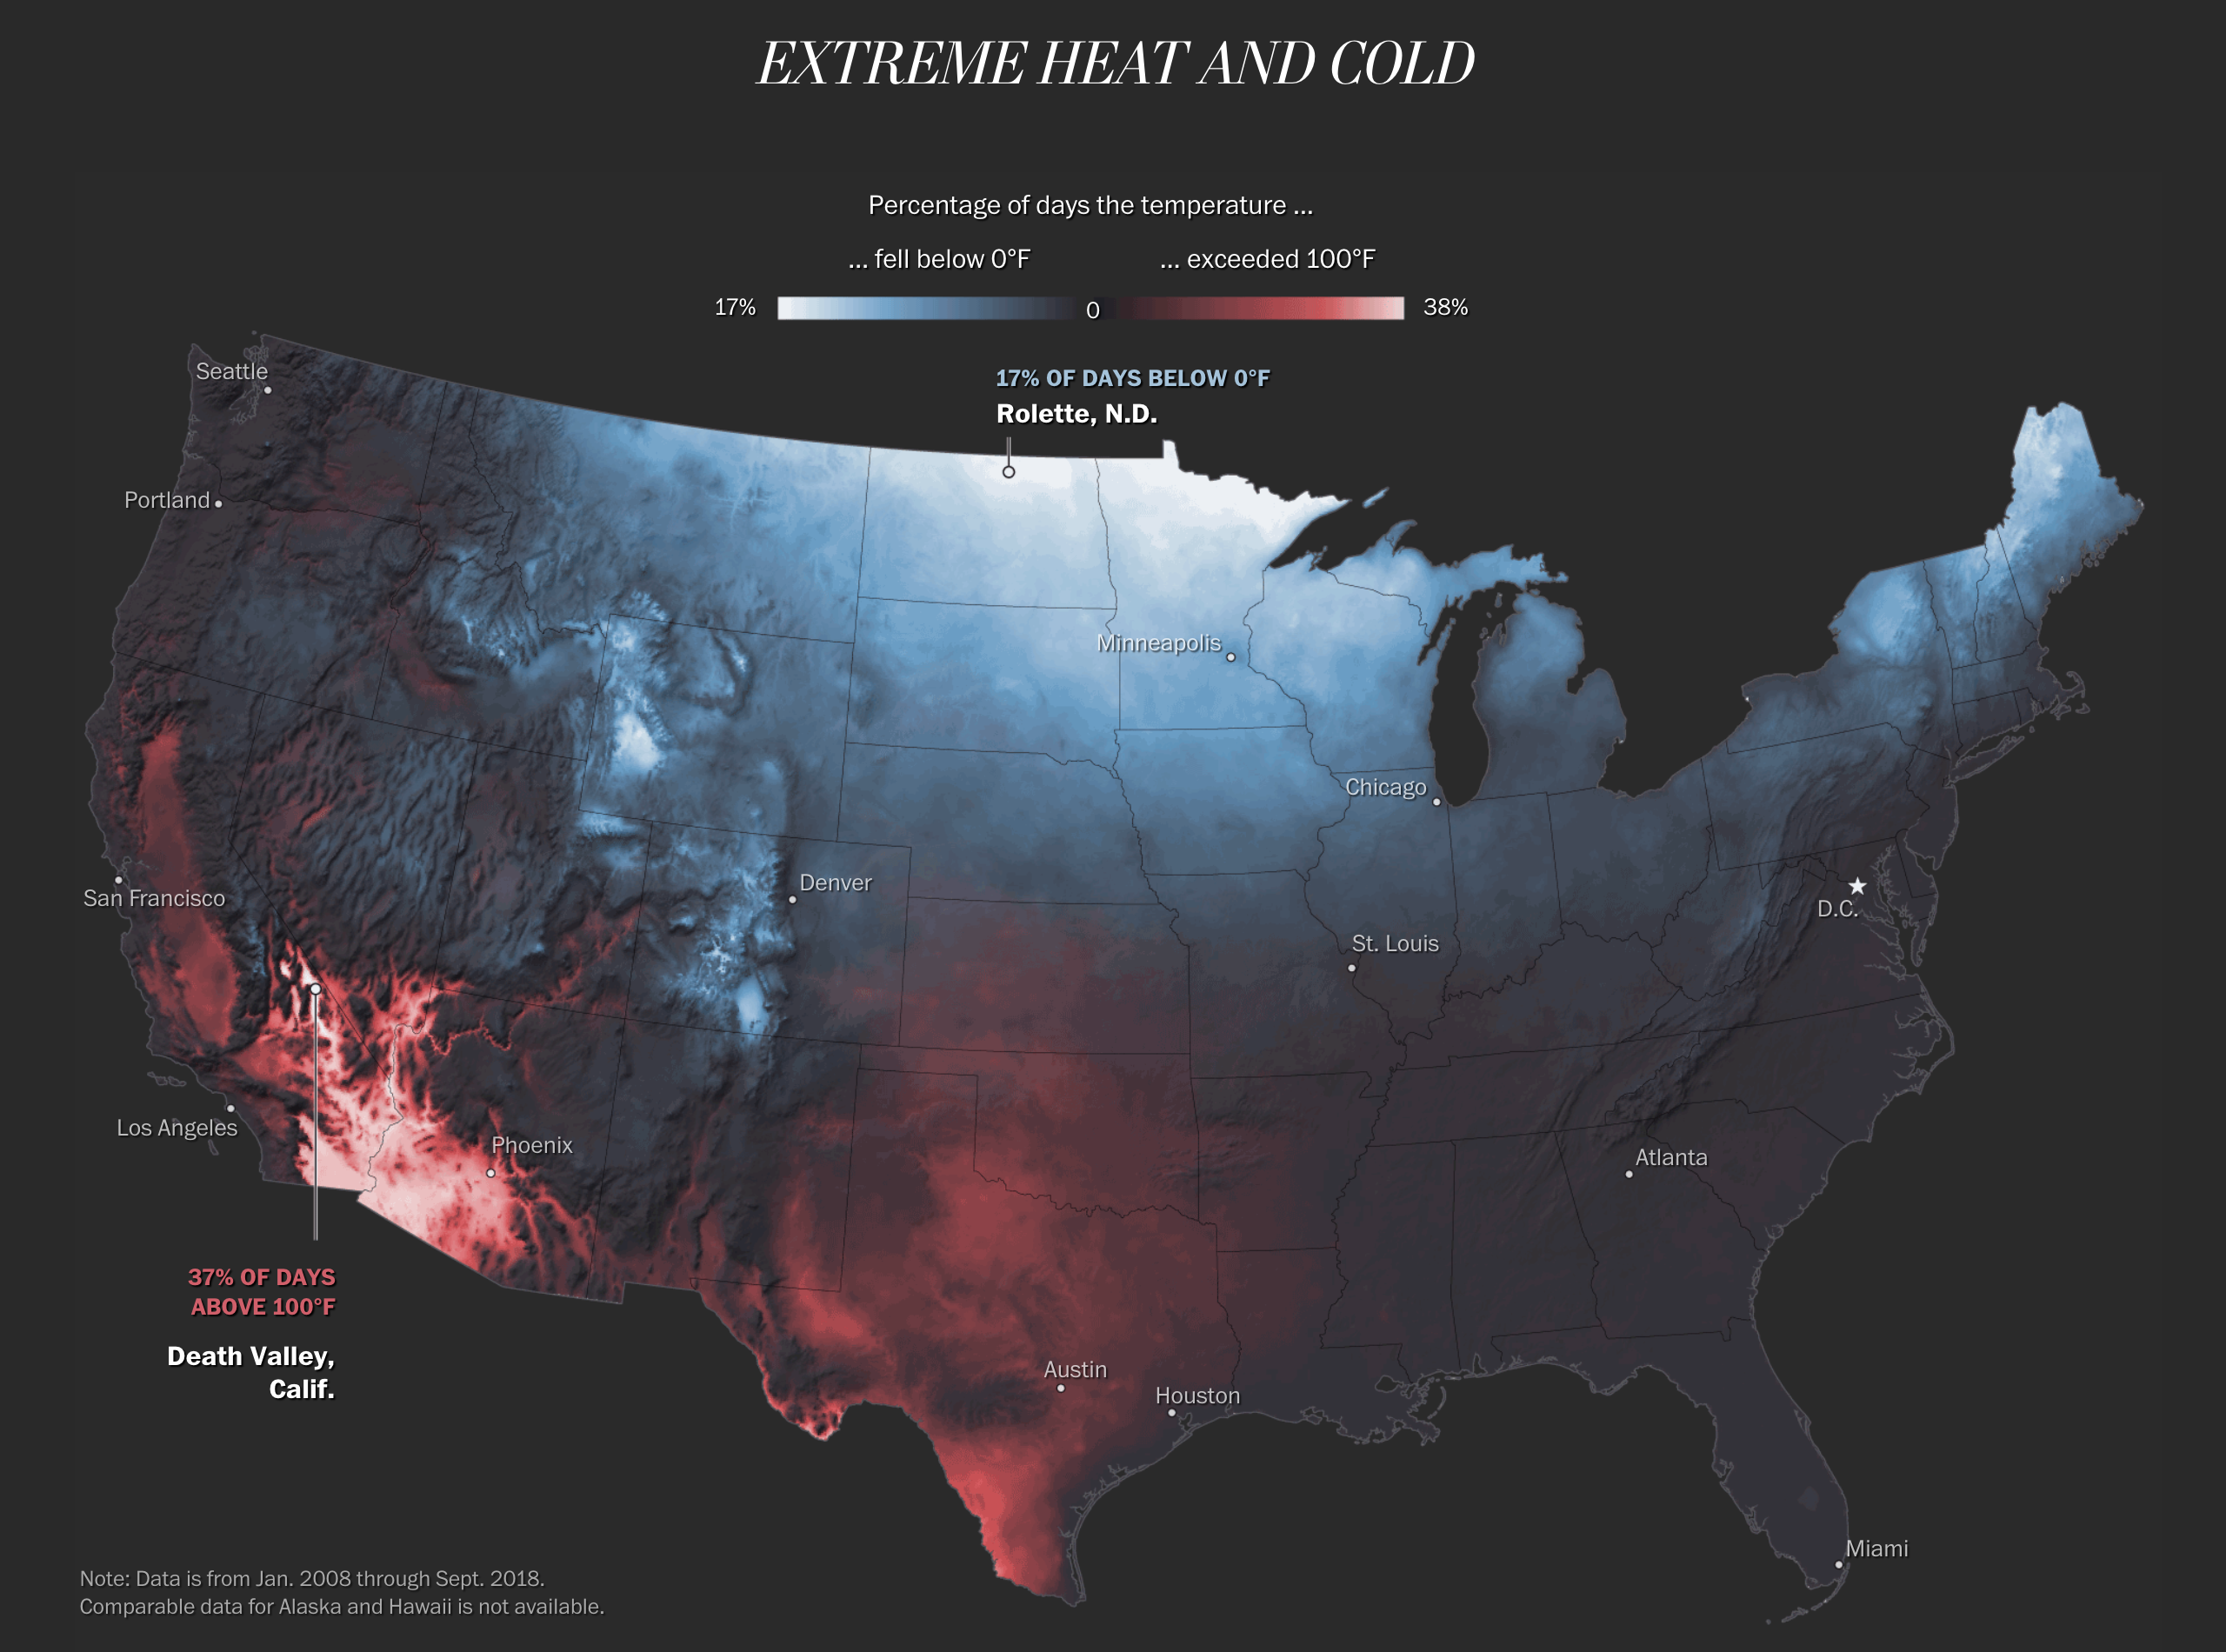
The Washington Post mapped a number of different disaster types: flooding, temperature, fire, lightning, earthquakes, &c. and plotted them geographically. Pretty clear patterns emerge pretty quickly. I was torn between which screenshots to share, but ultimately I decided on this one of temperature. (The earthquake and volcano graphic was a very near second.)

Pretty clear where I'd prefer to be…
Pretty clear where I’d prefer to be…

It isn’t complicated. Colder temperatures are in a cool blue and warmer temperatures in a warm red. The brighter the respective colour, the more intense the extreme temperatures. As you all know, I am averse to warm weather and so I will naturally default to living somewhere in the upper Midwest or maybe Maine. It is pretty clear that I will not really countenance moving to the desert southwest or Texas. But places such as Philadelphia, New York, and Washington are squarely in the blacked out or at least very dark grey range of, not super bad.

Credit for the piece goes to Tim Meko.

The Changing Shape of Anak Krakatau

A few weeks ago we took a look at an interactive piece from the BBC that used a slider to show before and after photos of Anak Krakatau. For those that forget, that was the volcano that exploded and created a tsunami in Indonesia, which killed over 400 people. Well, geography is always changing and so has the shape of the volcano.

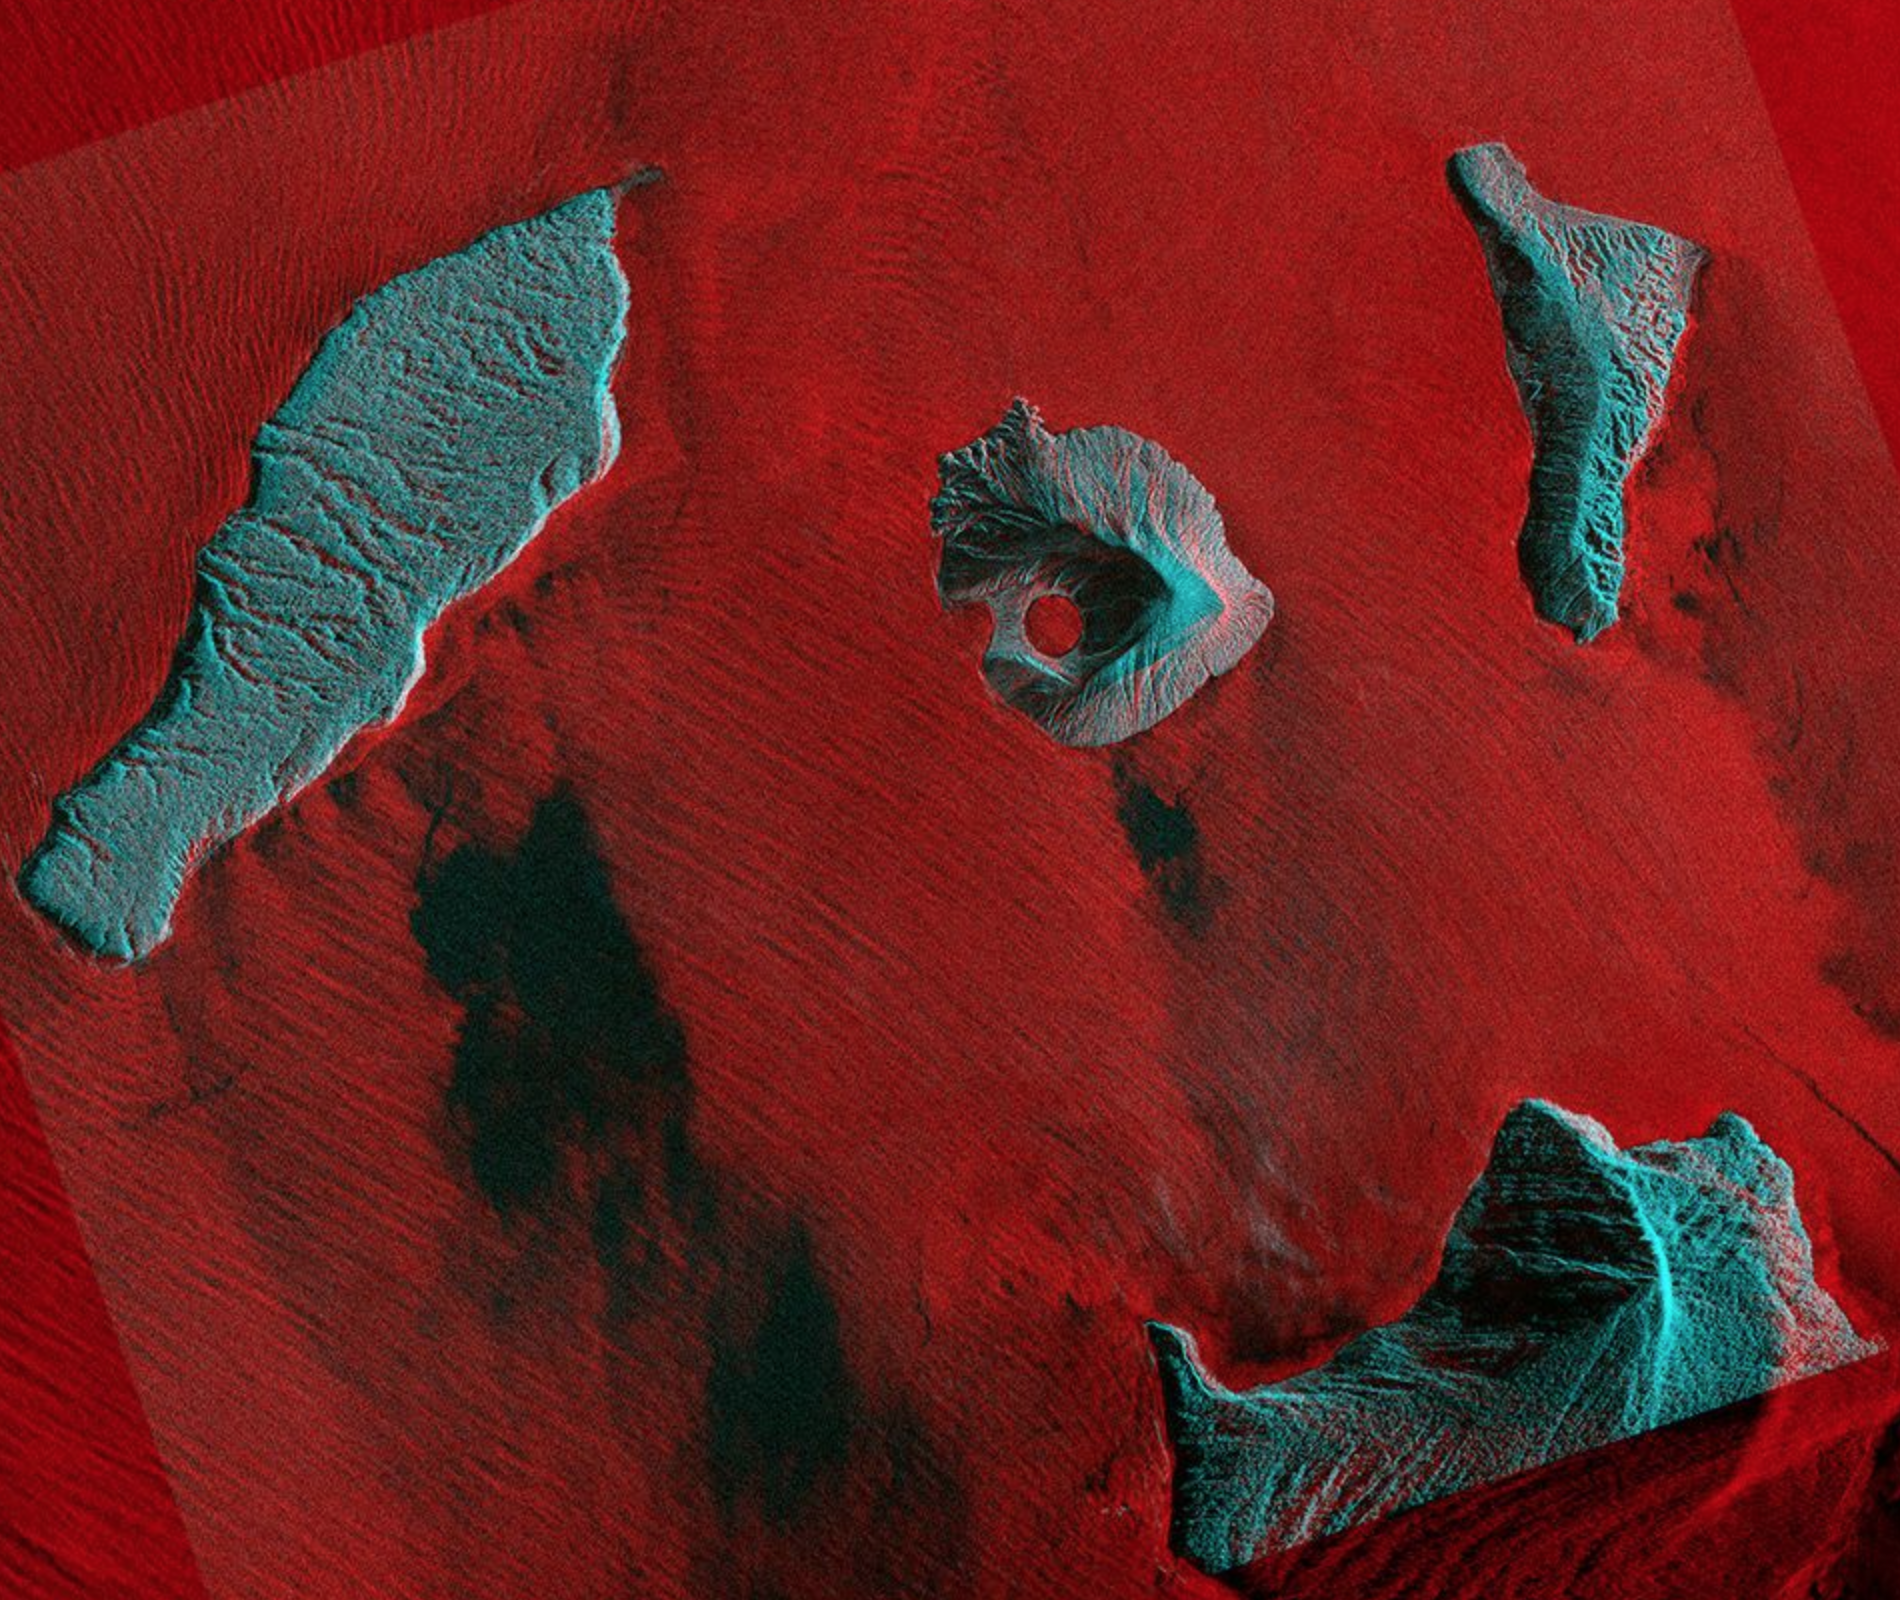
The BBC published a piece about two weeks ago that looked at new details from a Finnish radar satellite. These show how the crater of the volcano has been cut off from the ocean and is now a little lake.

Maybe not the most ideal lounging lagoon

This piece is not really revolutionary in its design. But it does provide a nice follow-up on a story that piqued my interest.

Credit for the piece goes to ICEYE.

Anak Krakatau

During my winter holiday to London the volcano Anak Krakatau erupted, sending enormous amounts of material sliding into the ocean. The displaced water had to go somewhere and travelled as a tsunami that devastated the Indonesian coastline.

Of course Anak Krakatau is one of several remnants of the much larger volcano of Krakatoa that erupted several times, perhaps most famously in 1883. Anak Krakatau specifically emerged in the late 1920s and has been building ever since until it collapsed almost two weeks ago. But by how much did it collapse?

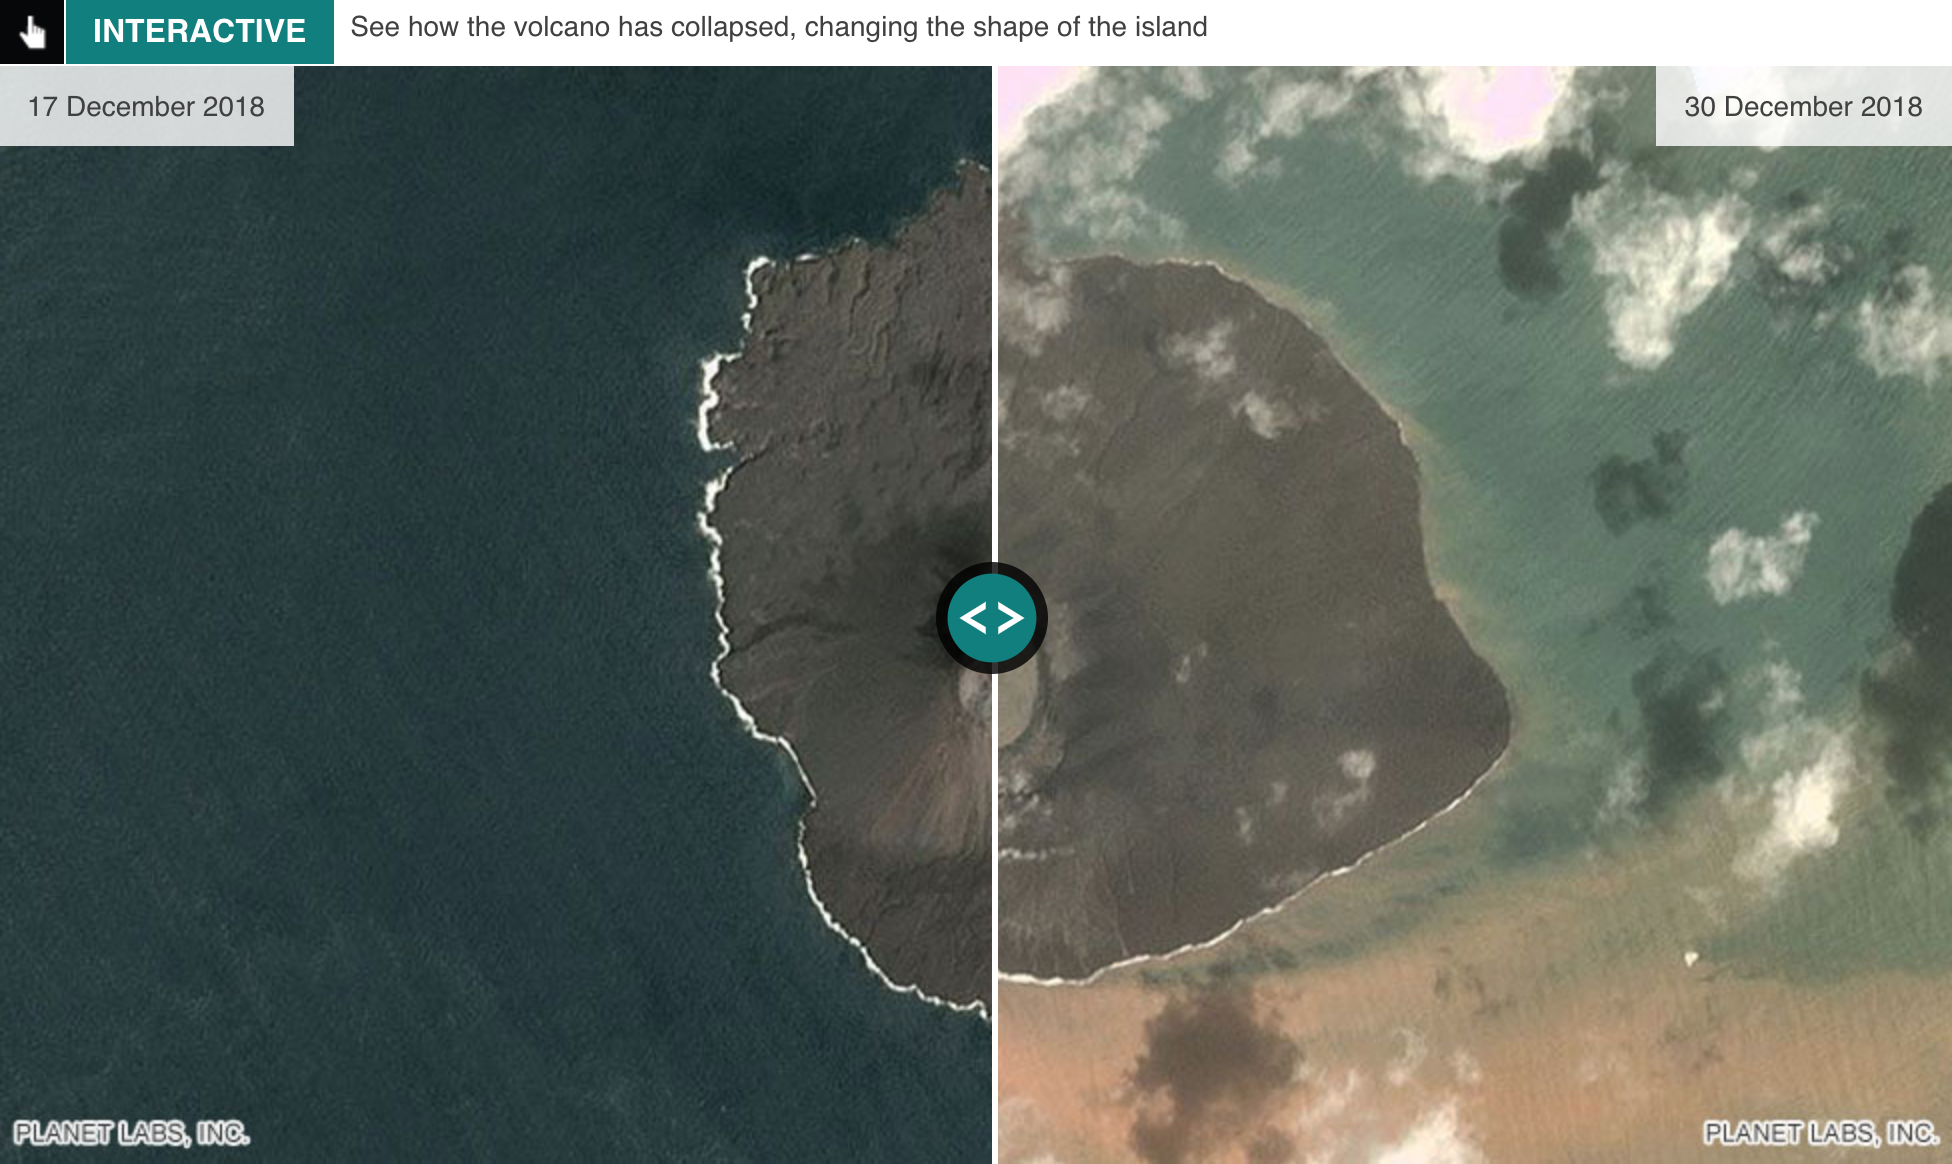
Until just a few days ago, the skies above the volcano have not permitted detailed photography. But within the last day or so we have started to get images and the BBC put together this piece that looks at Anak Krakatau before and after.

Before on the left, after on the right

It is a fairly common convention these days, the slider overtop the two images. But conceptually it shows clearly how the shape of the island has changed, in particular the new bay that has emerged. The other remarkable feature is the extension of land to the presumably east (right) of the image.

Credit for the piece goes to the BBC graphics department.
Kilauea Eruption

As a kid, volcanoes fascinated me. The idea that the molten core of the Earth can bubble its way up to and then erupt from the cold crusty surface of the planet still fascinates me. Of course, volcanoes can also have drastic impacts on people, both at the grand scale of impacting global climate to the smaller and more personal scale of someone’s home destroyed by a lava flow.

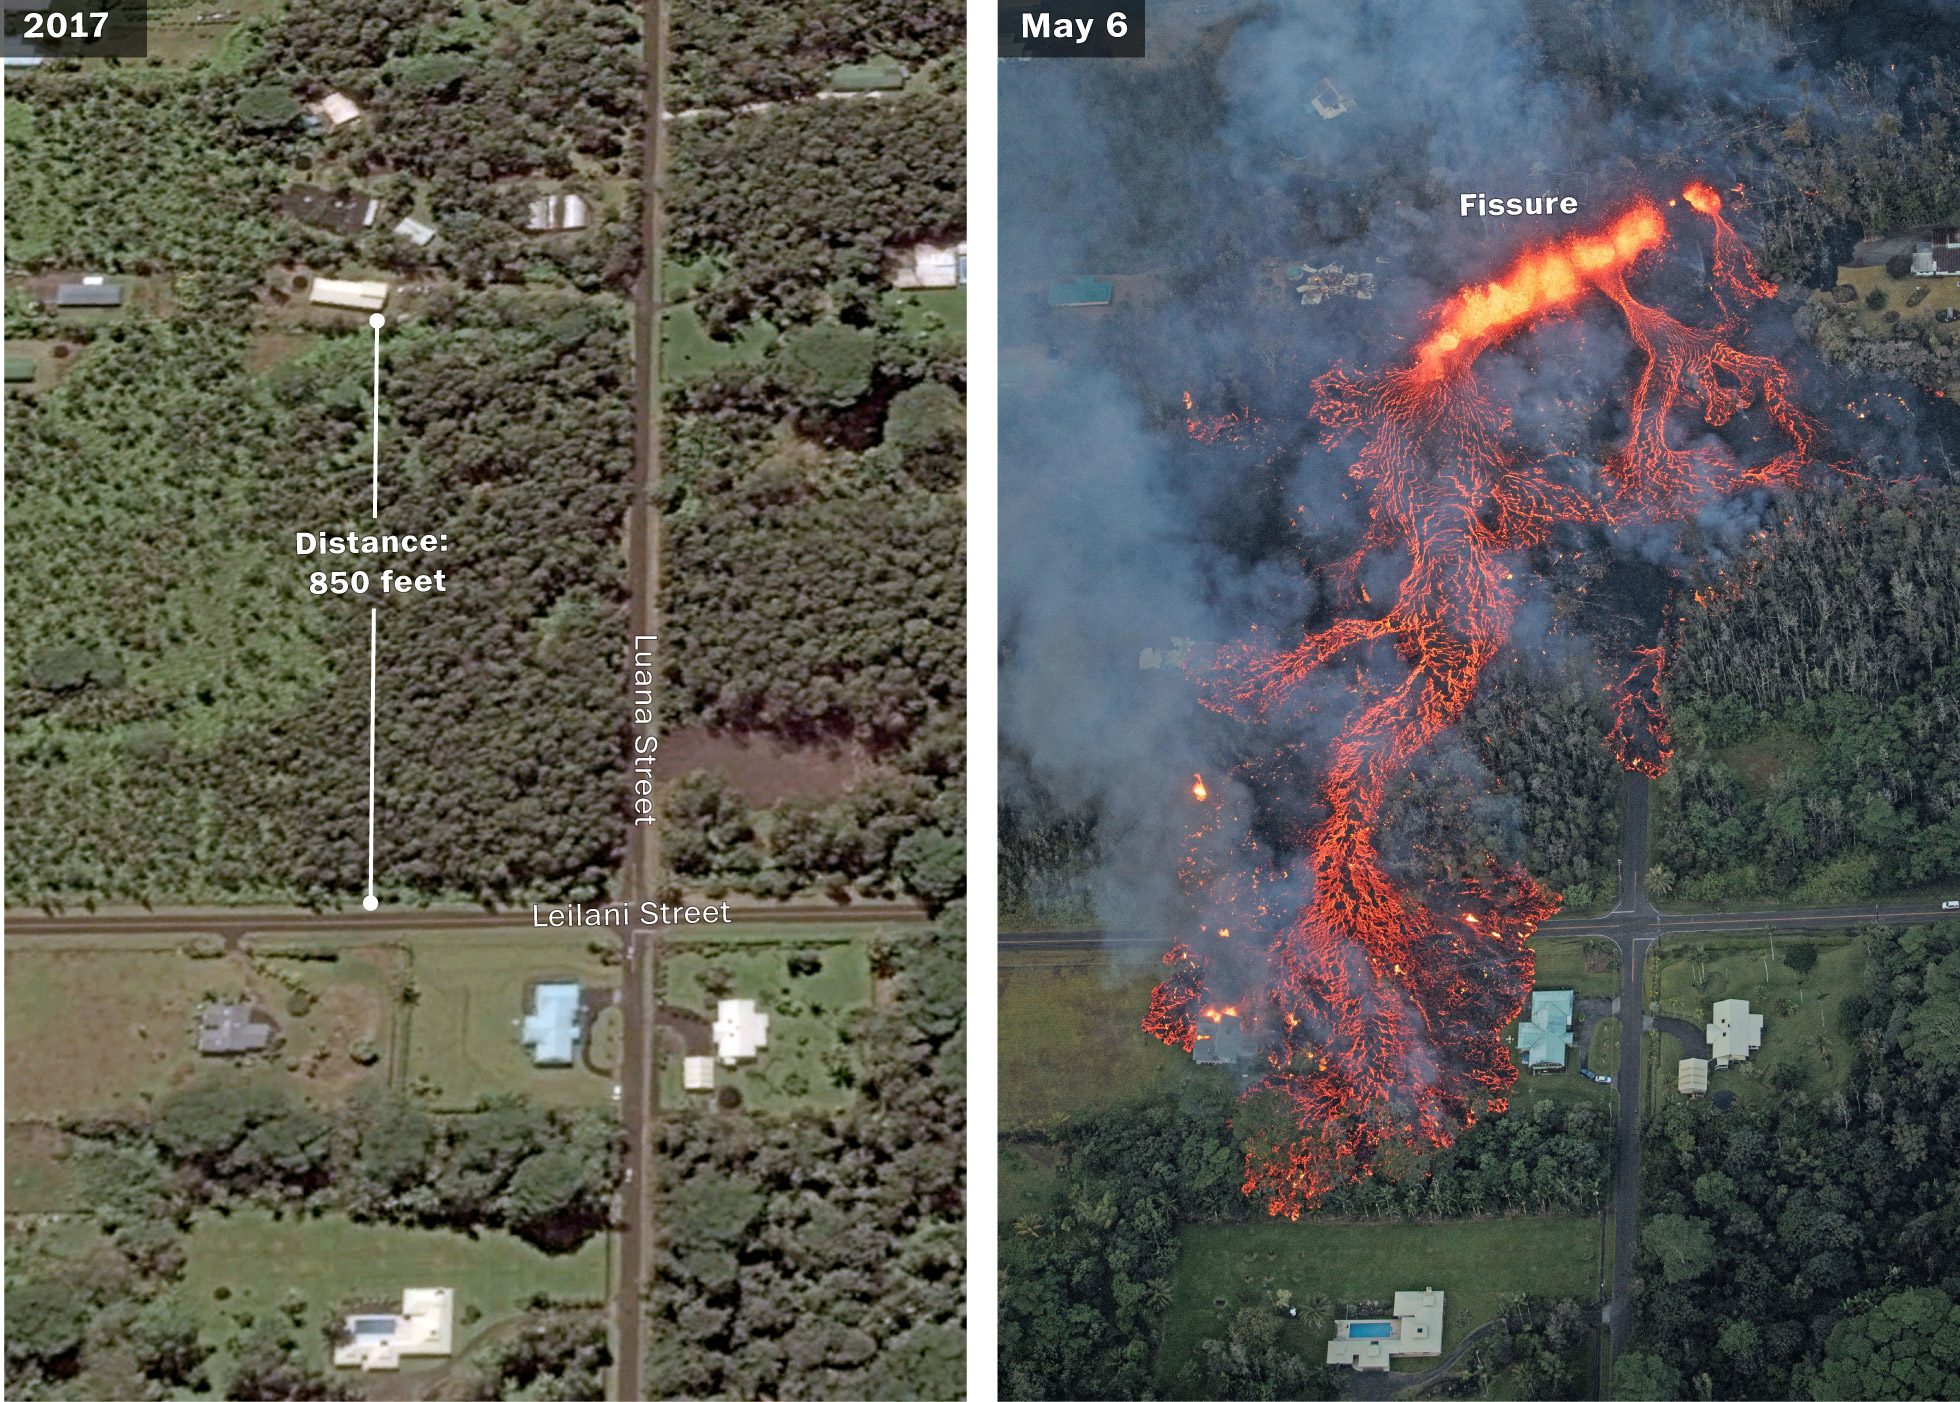
And unfortunately for residents of Hawai’i that personal destruction is unfolding across a development called Leilani Estates. The Washington Post has a nice piece detailing the geography of the area and showing how quickly things can change.

Earth is powerful
Earth is powerful

The article uses the photo above to illustrate the distance the lava flow travelled in only a few days. It also shows how precariously sited the homes are.

Only because I am so fascinated by these kinds of stories, I hope the Post continues to expand its content with pieces like this exploring the eruption and those of other volcanoes in the area.

Credit for the piece goes to Laris Karklis and Lauren Tierney.