On Tuesday, Southwest Flight 1380 made an emergency landing here in Philadelphia after the Boeing 737-700’s port engine exploded. One passenger died, reportedly after being partially sucked out of the aircraft after the explosion broke a window. But the pilot managed to land the aircraft with only one engine and without any further deaths.
I wanted to take a look at some of the eventual graphics that would come out to visually explain the story. And as of Thursday, I have seen two: one from the Guardian and another from the New York Times.
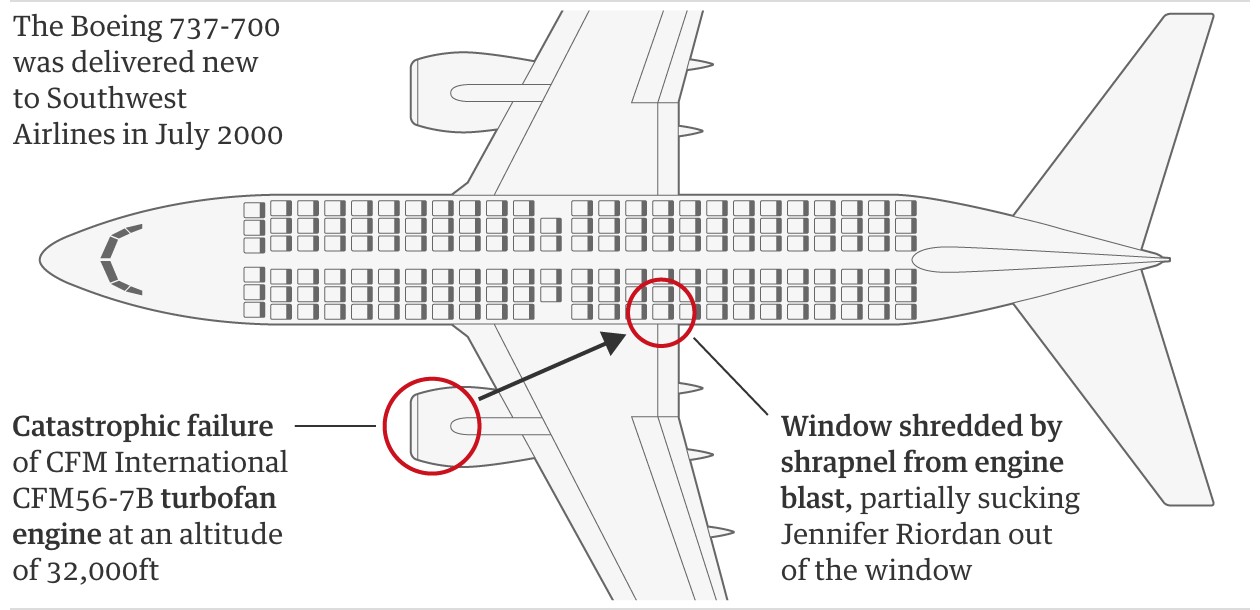
The Guardian’s piece is the simpler of the two, but captures the key data. It locates the engine and the location of the window blown out by debris from the engine.
The New York Times’ piece is a bit more complex (and accompanied elsewhere in the article by a route map). It shows the seat of the dead passenger and the approximate locations of other passengers who provided quotes detailing their experiences.
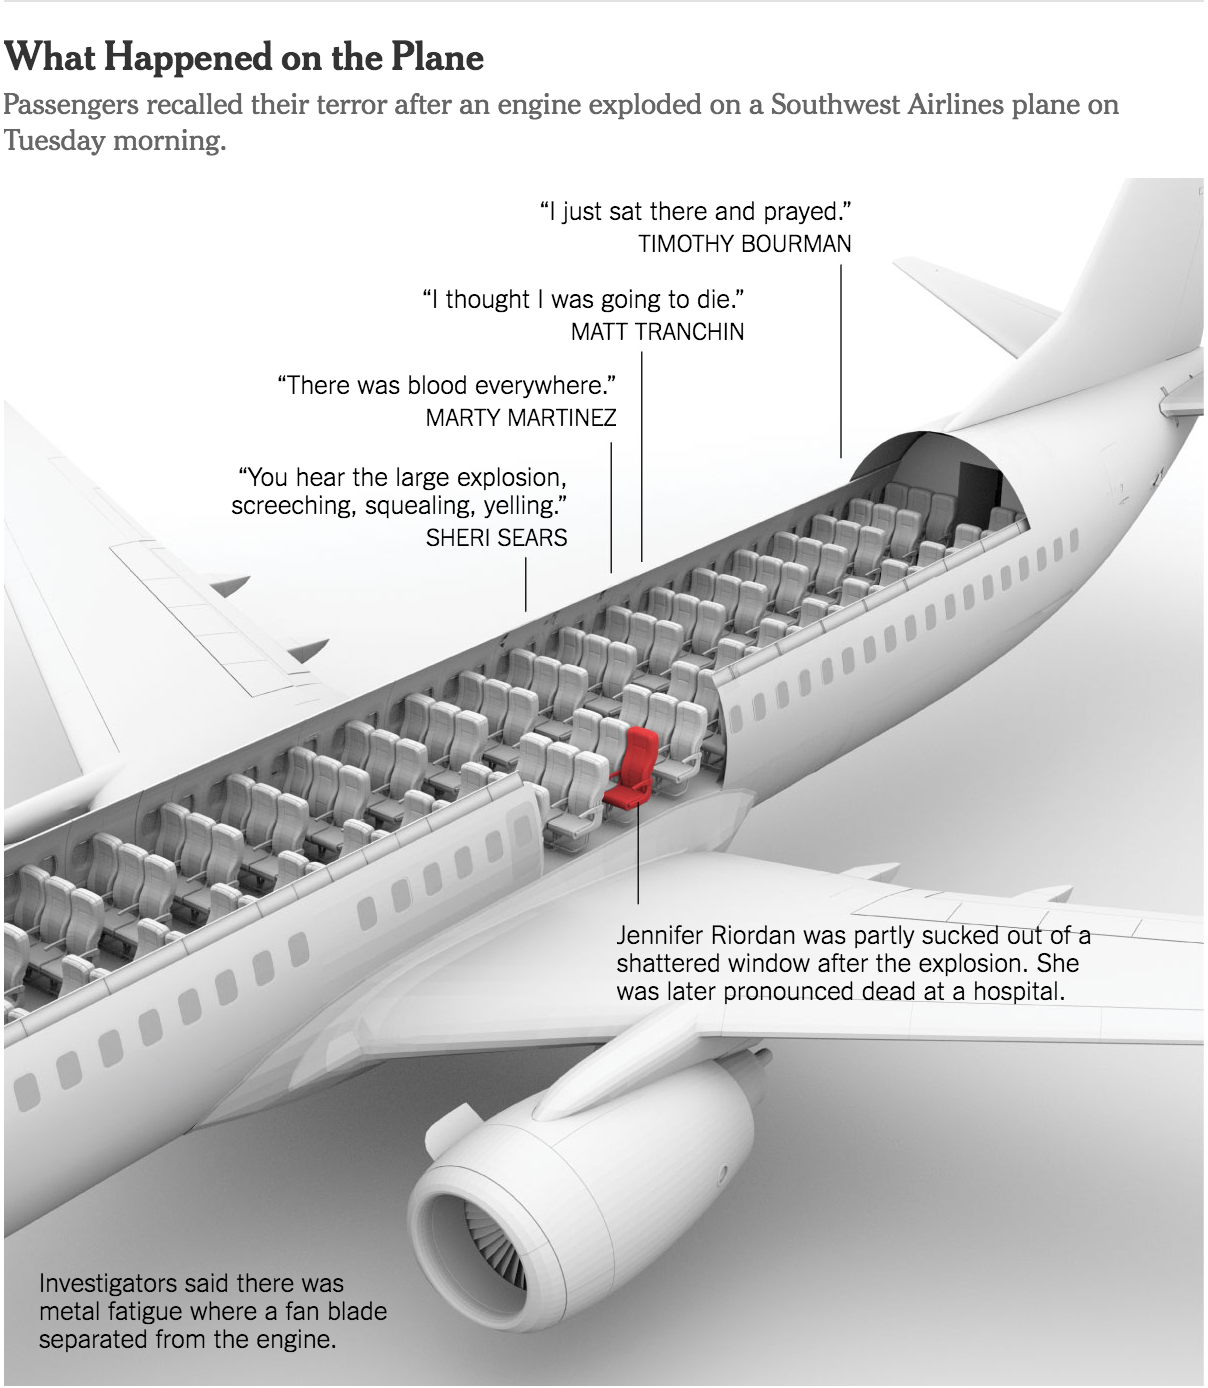
So the first thing that struck me was the complexity of the graphic. The Times opted for a three-dimension model whereas the Guardian went with a flat, two-dimensional schematic of the aircraft. Notice, though, that the seating layout is different.
Four rows ahead of the circled window location are two seats, likely an exit row, in the Guardian’s graphic where in the Times’ piece they have a full three-seat configuration. If you check seating charts—seatguru.com was the first site that came up in the Google for me—you can see that neither configuration actually matches what the seating chart says should be the layout for a 737-700. Instead it, the Guardian’s more closely resembles the 737-800 model.
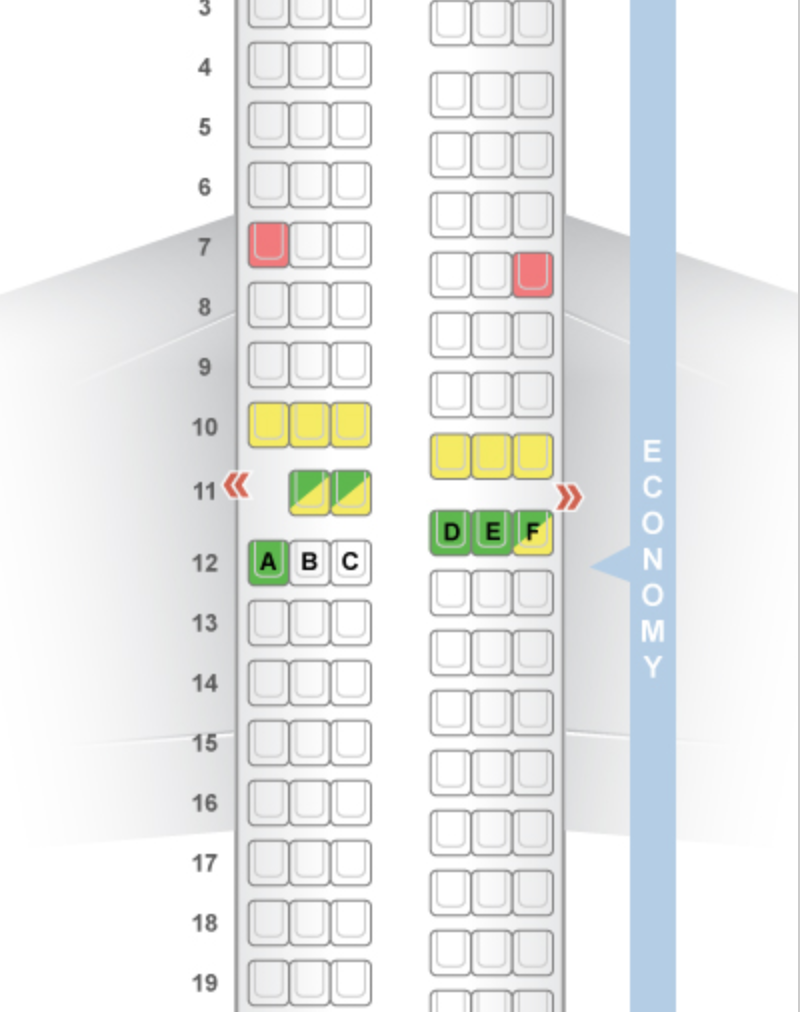
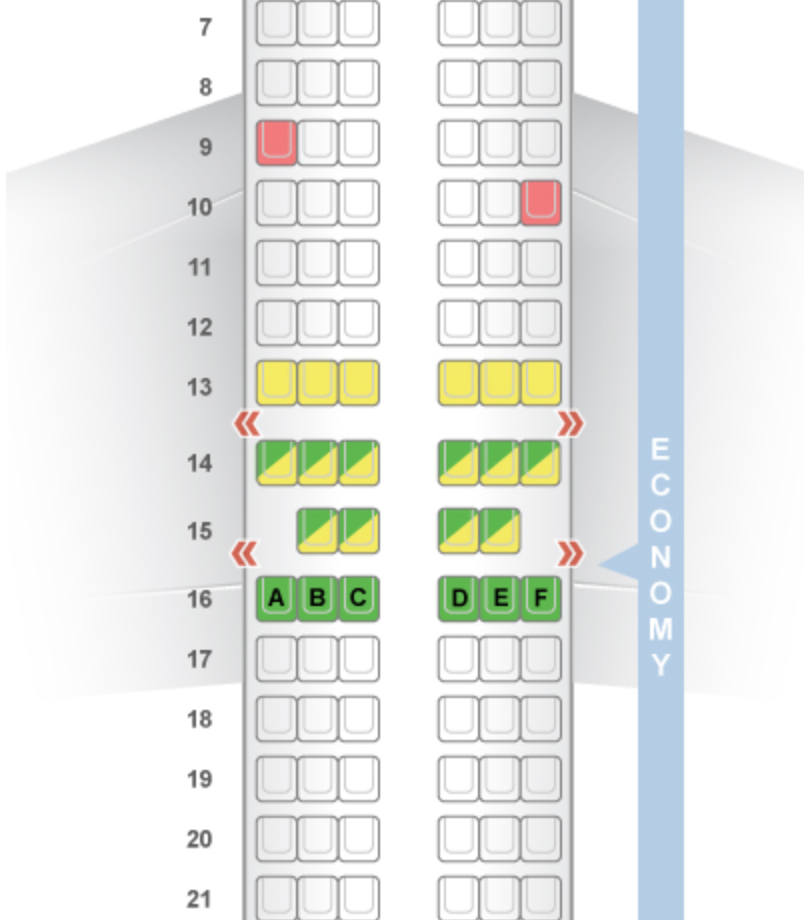
Nerding out on aircraft, I know. But, it is an interesting example of looking at the details in the piece. The Guardian’s piece is far closer to the layout, as least as provided by SeatGuru, and the New York Times’ is more representative of a generic narrow-body aircraft.
Personally, I prefer the Guardian in this case because of its improved accuracy at that level of detail. Though, the New York Times does offer some nice context with the passenger quotes. Unfortunately, the three-dimensional model ultimately provides just a flavour of the story, compared to the drier, but more accurate, schematic depiction of the Guardian.
Credit for the Guardian piece goes to the Guardian’s graphics department.
Credit for the New York Times piece goes to Anjali Singhvi, Sahil Chinoy, and Yuliya Parshina-Kottas.

