Into the Memory Hole

I noticed an interesting thing this morning. Over the holiday weekend I bookmarked a BBC News article about new airlines because it included a small graphic showing the number of airlines started during the pandemic (32) and the number of new airlines lost during the pandemic (55). The graphic used a stock three-dimensional illustration of a passenger airlines with a blank white body. From the top of the body rose two white bars, next to the left was the shorter of the two with a 32. The right was taller and had a 55. Above each was a header saying something to the effect of “Airlines started in 2020” and “Airlines lost in 2020”, respectively. Funny thing this morning that when I returned to the bookmark with this post in mind, the article’s graphic had disappeared.

This weekend I happened to start re-reading 1984, George Orwell’s classic dystopian novel about a man named Winston Smith. He works in the Records Department and is tasked with “rectifying” misstatements. I had just finished reading the section where Orwell describes Smith’s work wherein he takes previously published newspaper articles about statistics and figures and then edits them to include new numbers aligned with the actual outputs. This way should anyone read the old article for evidence of a previous past, they find the output forecasts have always been correct. He then destroys the written record of the old past by dumping it into a memory hole, a pneumatic tube that delivers it straight to a furnace where the old past is incinerated and thus replaced with Smith’s new version.

When I read the article again, because the graphic was gone, I read a paragraph that had figures for 2021. I cannot recall those numbers being present earlier this weekend. But they are roughly where I remember the old graphic being. Yet the article includes no note about any edits to a previous version let alone what those edits may have been. And so now I am left wondering if I really saw what I think I remember that I saw. How very Orwellian.

But let’s assume I did see what I thought I saw, the graphic was actually unnecessary. It presented two figures, 32 and 55. The bar chart itself had no axis labels and that made it a bit difficult to believe the numbers themselves. It did not help that the white bars blended almost seamlessly into the white body of the airliner. Moreover, the graphic was large and fit the full width of the text column. For two figures.

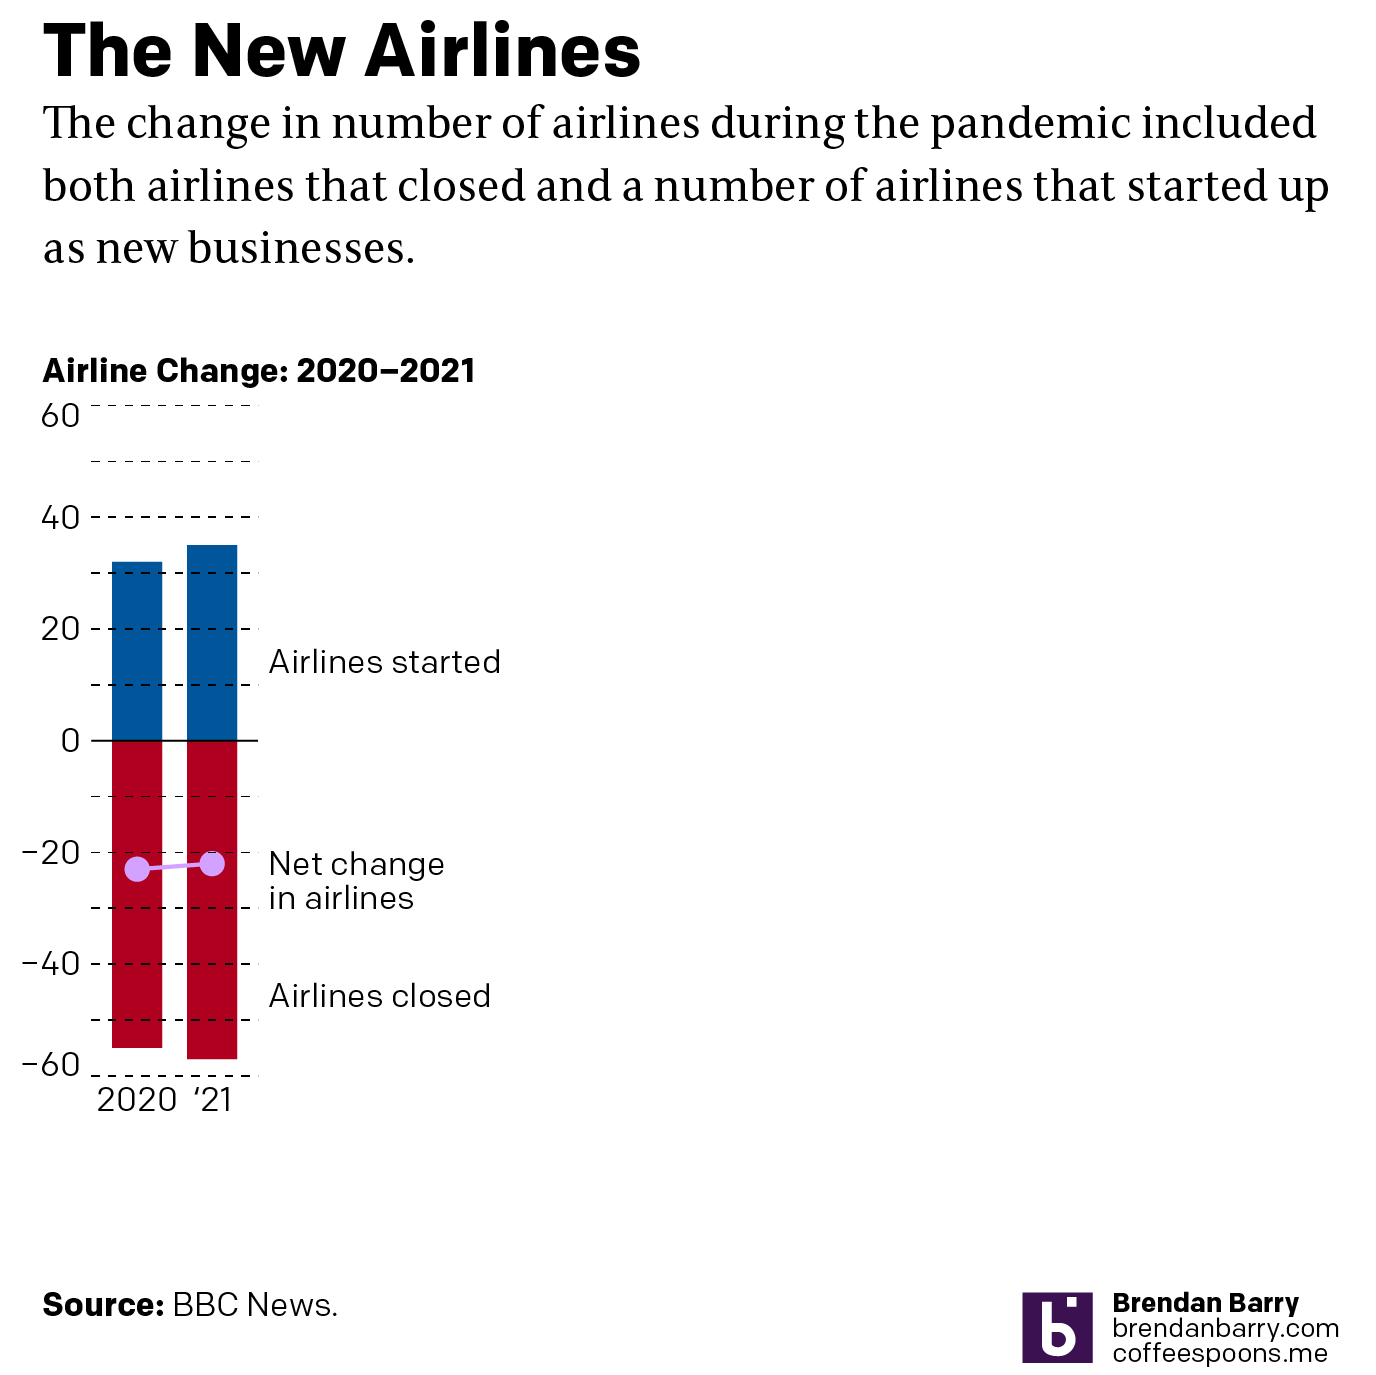
My initial goal was to show this graphic I made to show just how little space truly needs to be used to show an effective graphic. I also changed the direction of the bars. Instead of making one bar about the positive change and the other the negative change, I made both bars about the change. Therefore the one bar moved upwards with the positive (32) and the other downwards with the negative (55). I then plotted a dot to show the net change between the two. Yes, 32 airlines were created in 2020. But that still made for a net loss of 23 that year.

But because the graphic was missing and there was some new text for 2021 figures, I decided to incorporate them as well to show how the trend basically continued year over year.
Finally, a graphic

I left the white space to the right to illustrate how you really do not need a full-width graphic to display only six data points, itself a three-fold increase on the original graphic’s data content. The original graphic contained more illustrated plane than it did data content.

Graphics should be about the data, not about the splashy, flashy, whizbang background content that ultimately distracts our attention away from what should be the focal point of the piece: the data. The article still contains photos of planes with the livery of the new airlines, of empty terminals to represent the pandemic losses, and portraits of executives. This graphic did not need an illustrated plane taking over the graphic. It needed to only show those two numbers.
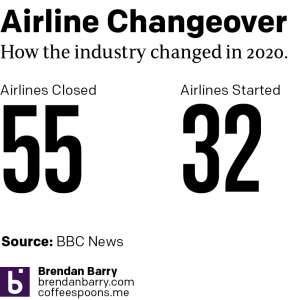
I would even contend that the article could have made do with a simple factette, two big numbers. Airlines closed in 2020 and the airlines opened. It need not be fancy, but it quickly delivers the big numbers with which the reader should be concerned. You don’t need to see an aircraft or a terminal. You could add some colour to the numbers or even a minus sign as there is a significant difference between a 55 and a -55. But all in all, the graphic need not be full width like it was originally.

But I think we should all keep in mind the value of transparency. The graphic did exist, of that I am certain. But future readers or even my sanity cannot be sure that it did. And in an era where “fake news” and fact-checking are important, I wonder if we need to be including corrections notes in more of our news articles. Because if we lose faith in our news, we have little left to lean upon in our societal discourse about the events of our time.

Credit for the piece is mine.

How Far You Won’t Go

Housekeeping first, as you may have noticed, I haven’t been publishing as much lately. That’s because I’ve been on holiday. After a tremendously busy year, I need to use up all the time I didn’t spend on holiday. Consequently, I’m only going to be posting a handful or so more times before the end of the year. The plan is to return in early January to my regular posting schedule. For this week that means the next few days before I’m off for American Thanksgiving.

But on with the show.

One of the things I haven’t been doing too much of is travelling. There are many reasons for this, but one is that air travel in the United States has, of late, been, shall we say unreliable. Hundreds if not thousands of flight cancellations, sometimes with no obvious cause. And in one notorious case, Southwest claimed inclement weather cancelled flights in Florida, but it was the only airline to cancel significant numbers of flights. In other words, it wasn’t the weather.

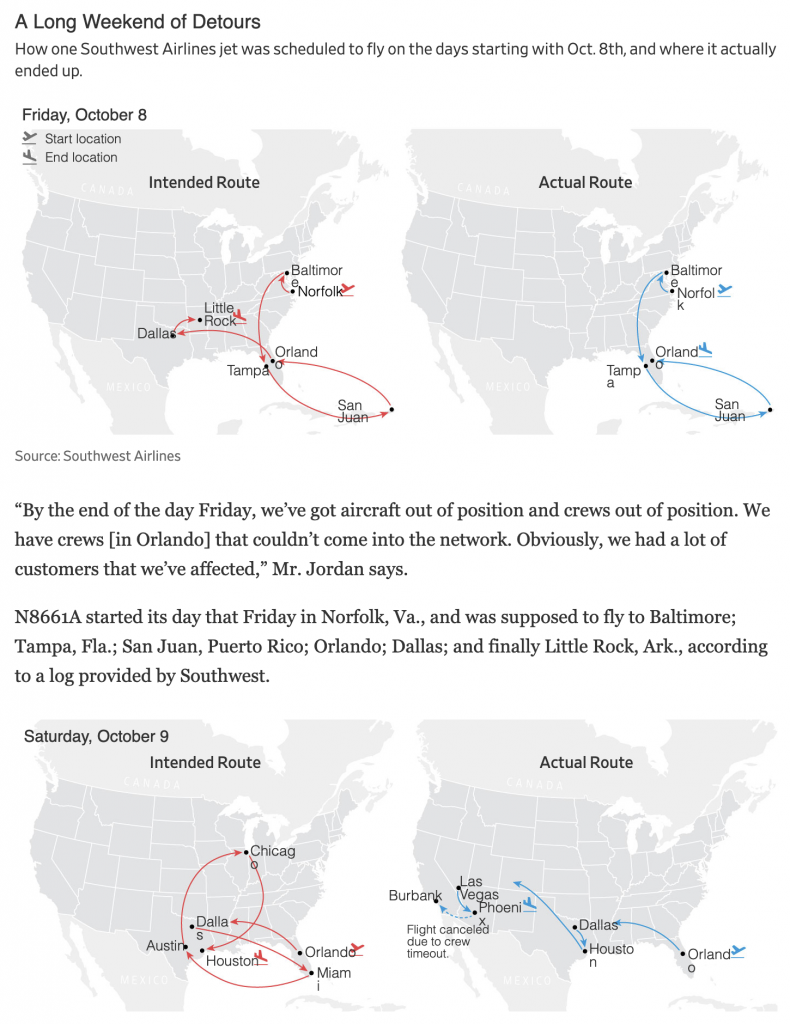
The Wall Street Journal recently posted an article that explored the issue, doing so via a great example. It followed the literal path of one Southwest aircraft over one long holiday weekend. The screenshot below captures two of the graphics with a wee bit of text between.

What’s nice about the graphics’ design is how they use small multiples and consistent colours. The intended route is always on the left and what actually happened is on the right. Red and blue colours depict those throughout.

The only thing I quibble with is the embedded HTML text. Sometimes the page loads fine for me, other times it looks like it did this morning for this screenshot. Note how for some city labels the final letters get dropped to a second line, e.g. the “o” in Chicago or the “e” in Baltimore.

This is far from a deal breaker on this being a good graphic, but I find it mildly annoying, especially when in situations like the bottom left Orlando, there’s no obvious reason as to why, because the little airplane departure icon sits atop the final letter.

I understand the idea behind using native HTML text in graphics, but when things like this happen, I wonder if it wouldn’t simply be better to include the text as part of the graphic and avoid these potential mishaps altogether.

Credit for the piece goes to Emma Brown.

The US Flies Alone

On Sunday, a Boeing 737 Max 8 aircraft crashed shortly after taking off from the airport in Addis Ababa, Ethiopia. This was the second crash in less than a year, since the another 737 Max 8 crashed into the sea shortly after taking off from Jakarta, Indonesia. And in the intervening months, there have been numerous reports to American regulators from pilots of problems with aircraft in flight. Unsurprisingly, international regulators have begun to take steps to protect their skies and their passengers from what might be an unsafe aircraft. American regulators, the Federal Aviation Administration, remains unconvinced.

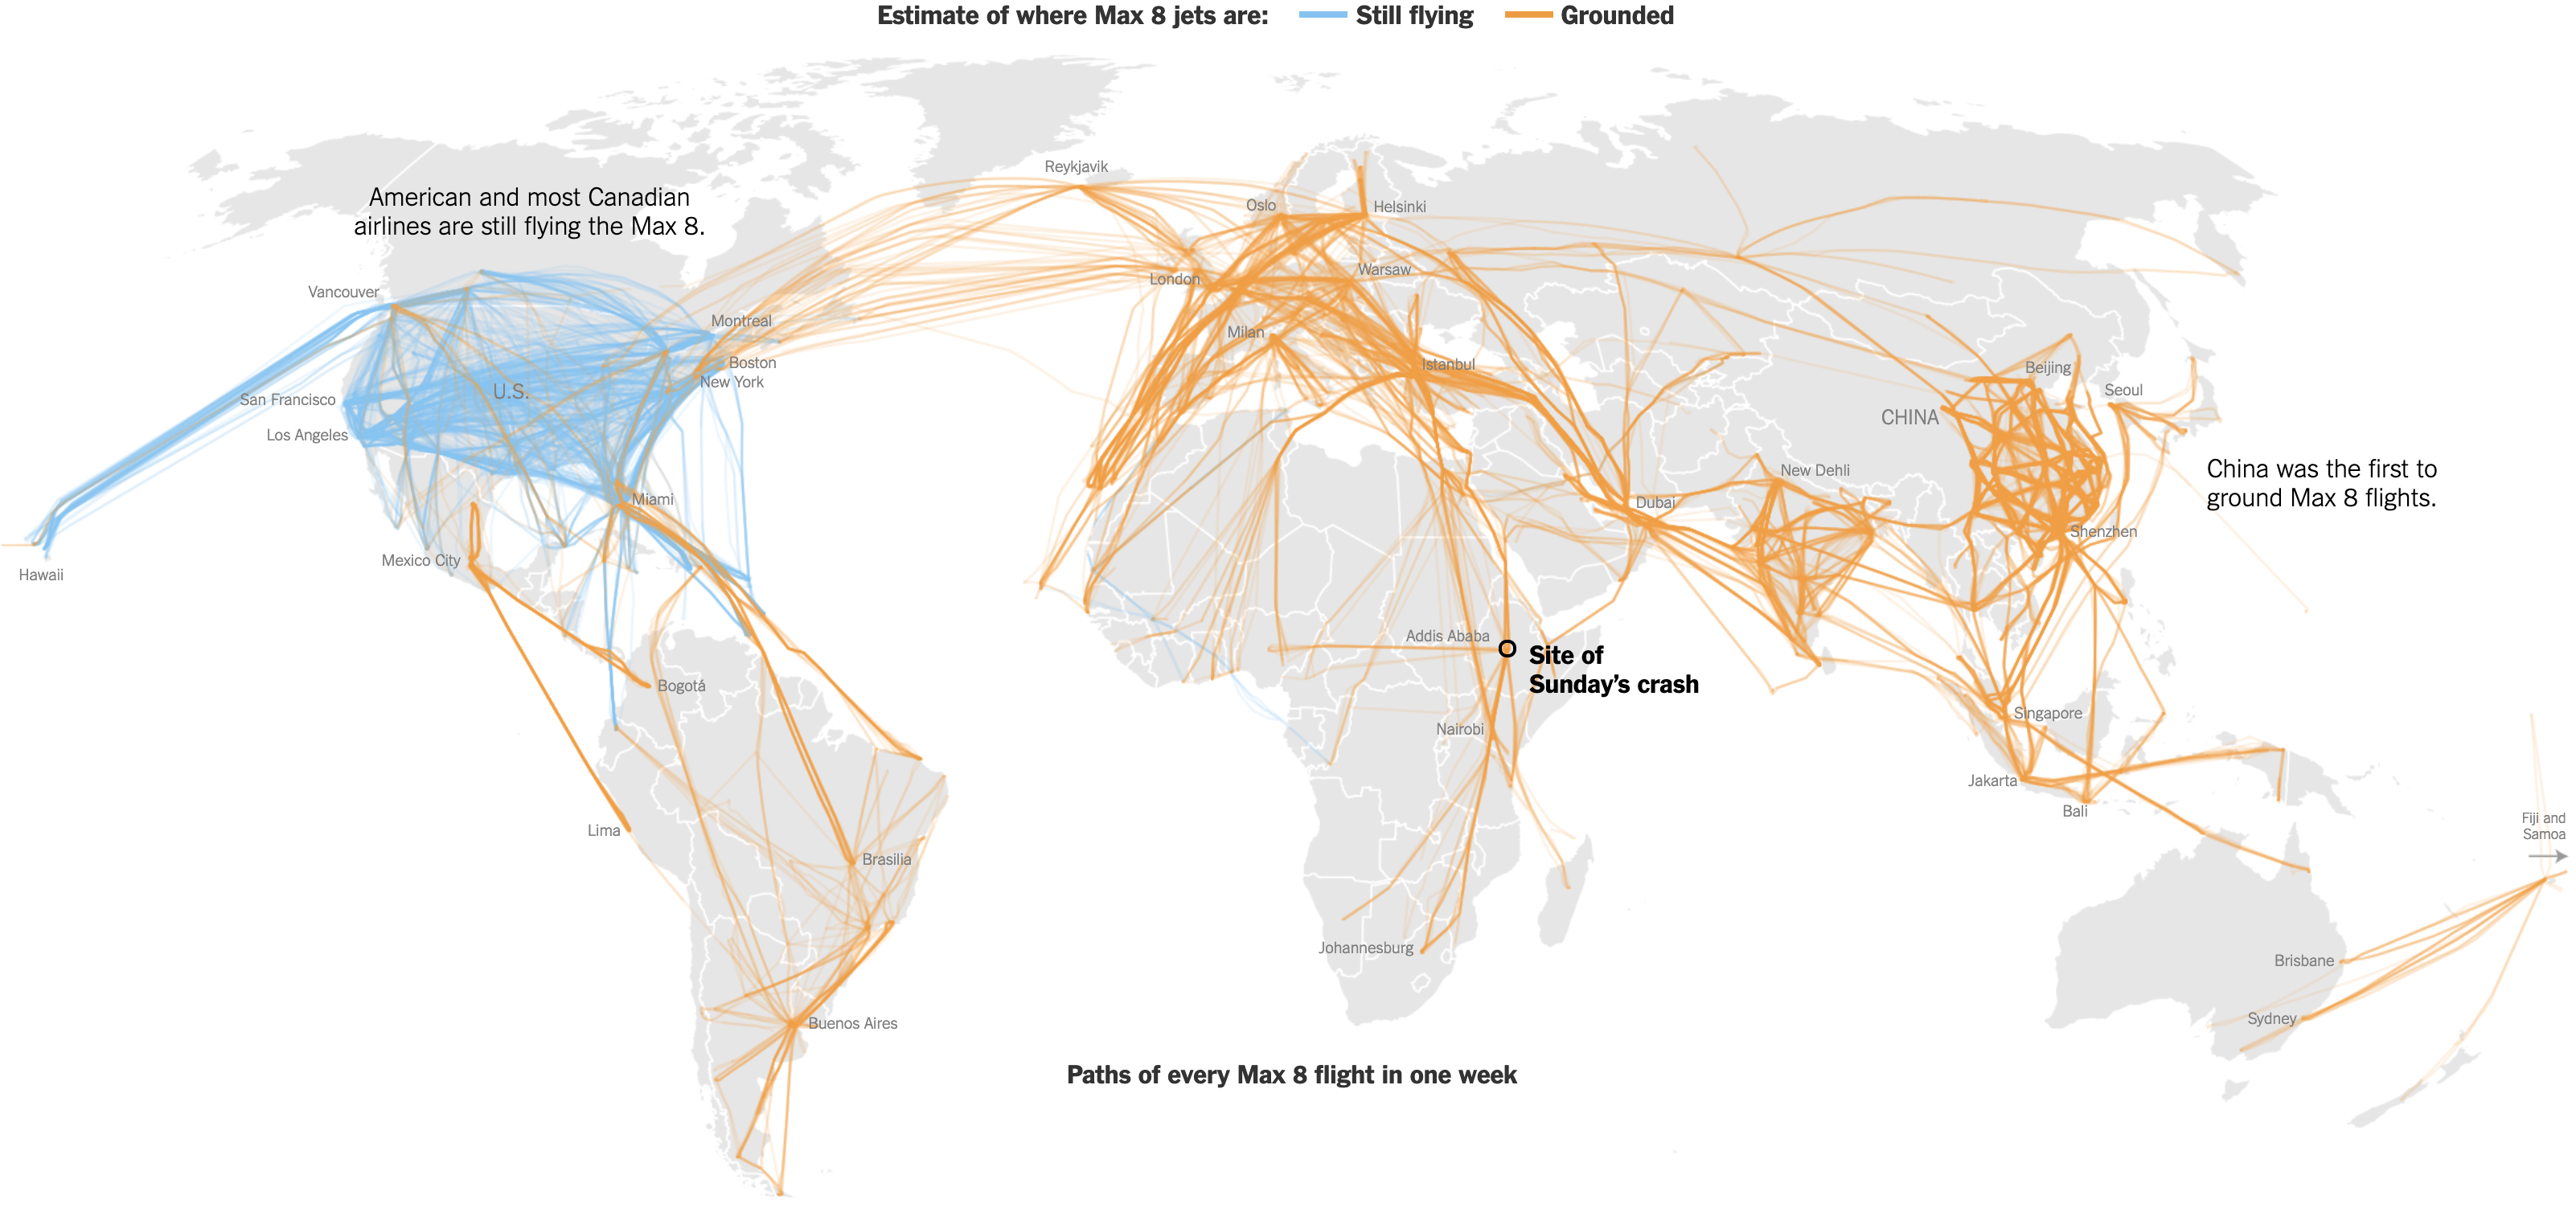
Consequently, the New York Times put together a graphics-driven article that details just how extensive the global grounding of 737 Max 8 aircraft has been in the last 24 hours.

There's a lot more orange than blue.
There’s a lot more orange than blue.

It’s a route map to headline the article. And it shows that almost all aircraft on 737 Max 8 routes, except for those in Canada and the United States, have been grounded.

The rest of the article makes use of more maps highlighting the countries who civil aviation authorities have grounded flights and popular routes. It also includes a bar chart showing how many 737 Max 8 aircraft are in use with each airline and how many of those airlines have had their fleets grounded.

Overall, it’s a strong article that makes great use of graphics to illustrate its point about the magnitude of the grounding and the isolation of the United States and Canada.

Credit for the piece goes to Denise Lu, Allison McCann, Jin Wu, and K.K. Rebecca Lai.

The New Longest Flight

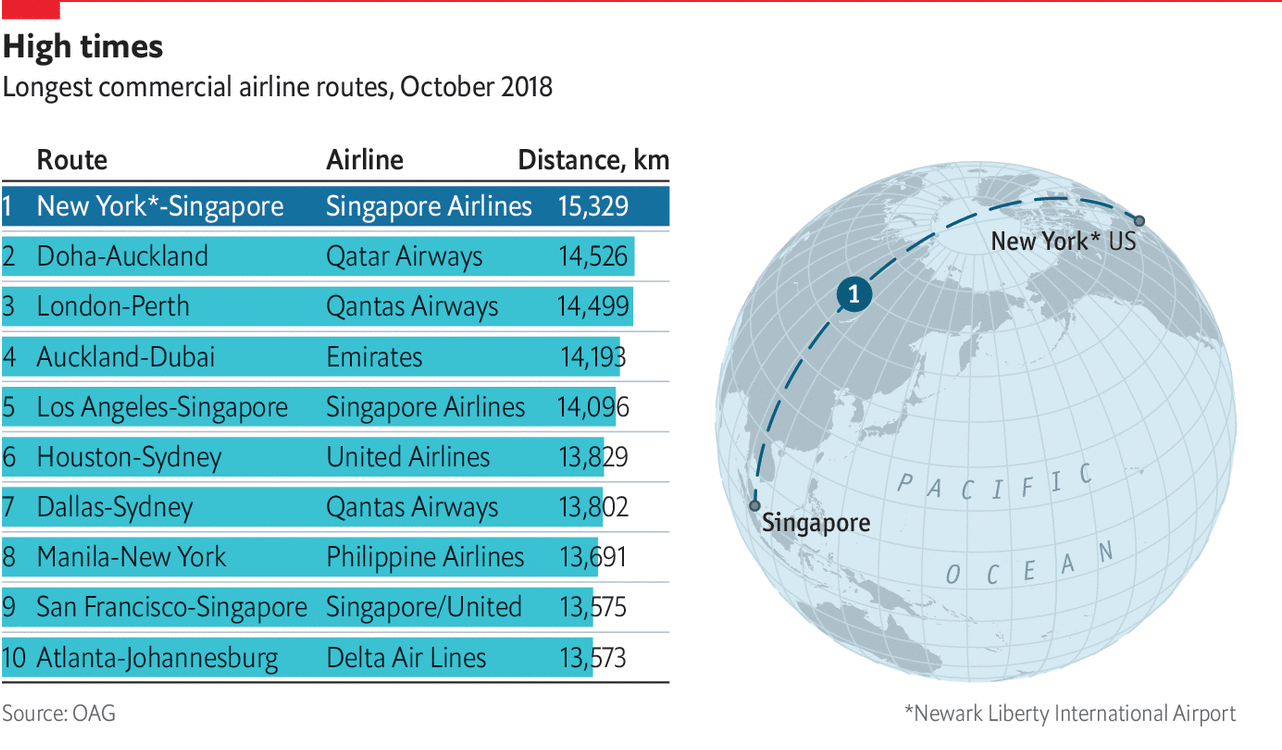
You might recall that back in March I wrote about the use of spherical maps to show great circles. This helps illustrate the actual routes that aircraft take in flight. (Yes, actual flight plans deviate based on routes, weather, traffic, &c.) At the time I wrote about how there was a soon-to-be Singapore–New York route. Ta da.

That's just a long time in one aircraft.
That’s just a long time in one aircraft.

Nothing fancy here in this graphic from the Economist. It probably is just a reuse of the original but with the additional routes removed. But, I still love these kinds of maps. From a design manager standpoint, in a way this is great efficiency in that an element from a graphic made once can now, with minimal effort, be used in a second piece. And not in a meaningless, throw-in way, but this graphic does very much help to illustrate the actual route and long across the globe it travels.

In a second note, not related to the graphic itself, I want to point out a subtle change made by the Economist. This is the first online graphic to use an updated chrome, which is the branding elements that surround the actual content of the piece.

Slight changes
Slight changes

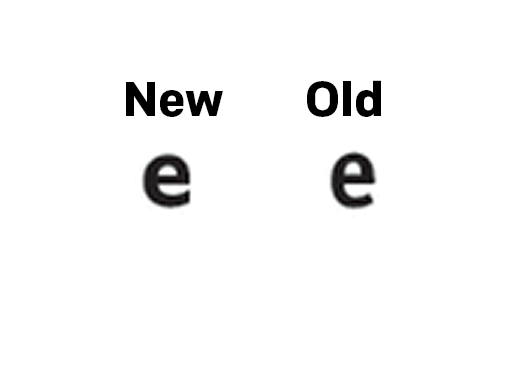
The biggest change is a new or modified typeface for the graphic header. I have not seen anything about design changes at the Economist, but I will look into it. But the changes are, again, subtle. The best example in these two comparisons (new on the left, old on the right) is the shape of the letter e.

E, as in Economist
E, as in Economist

You can see how the terminal, or the part of the letter hooking and swinging out at the bottom, used to come to an end at an angle. Now it ends with a vertical chop. I haven’t looked too extensively at the typeface, but given the letter e, it appears to be a little bit wider of a face.

The other change, not quite as subtle, is the positioning of the iconic red rectangle around which so much of the Economist’s brand hangs. Bringing back the above graphic, you can see where I drew a black line to indicate the edge of the original graphic.

Slight changes

The box is now orientated horizontally (again, new is on the left), which actually brings it closer to the actual Economist logo. But, and probably more importantly, it allows the graphic’s edge to go to the, well, edge. And since their site uses generous whitespace around their graphics, they don’t necessarily need margins within the graphic.

They have also chosen to raise the level at which the header starts, i.e. there is less space between the red rule at the top of the graphic and the start of the words. This, however, appears to have been possible in the original design.

As more graphics roll out, I am going to be curious to see if there are other changes. Or even just to see how these subtle changes affect the rest of the graphics.

Credit for the piece goes to the Economist Data Team.

Southwest 1380

On Tuesday, Southwest Flight 1380 made an emergency landing here in Philadelphia after the Boeing 737-700’s port engine exploded. One passenger died, reportedly after being partially sucked out of the aircraft after the explosion broke a window. But the pilot managed to land the aircraft with only one engine and without any further deaths.

I wanted to take a look at some of the eventual graphics that would come out to visually explain the story. And as of Thursday, I have seen two: one from the Guardian and another from the New York Times.

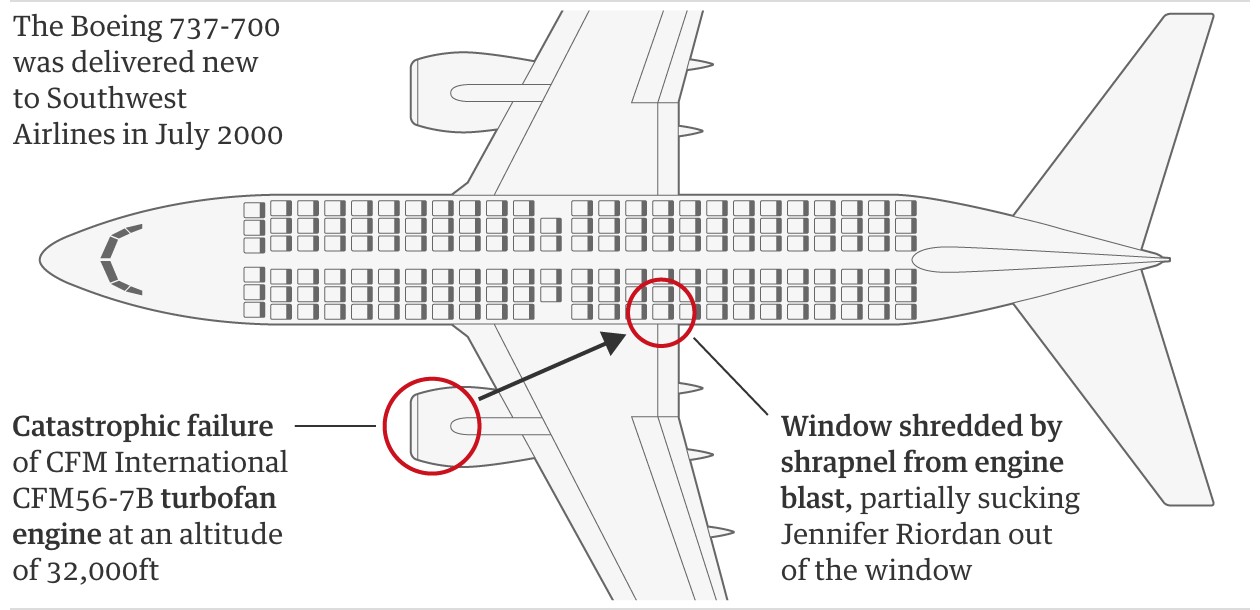
The Guardian’s piece is the simpler of the two, but captures the key data. It locates the engine and the location of the window blown out by debris from the engine.

The Guardian's graphic
The Guardian’s graphic

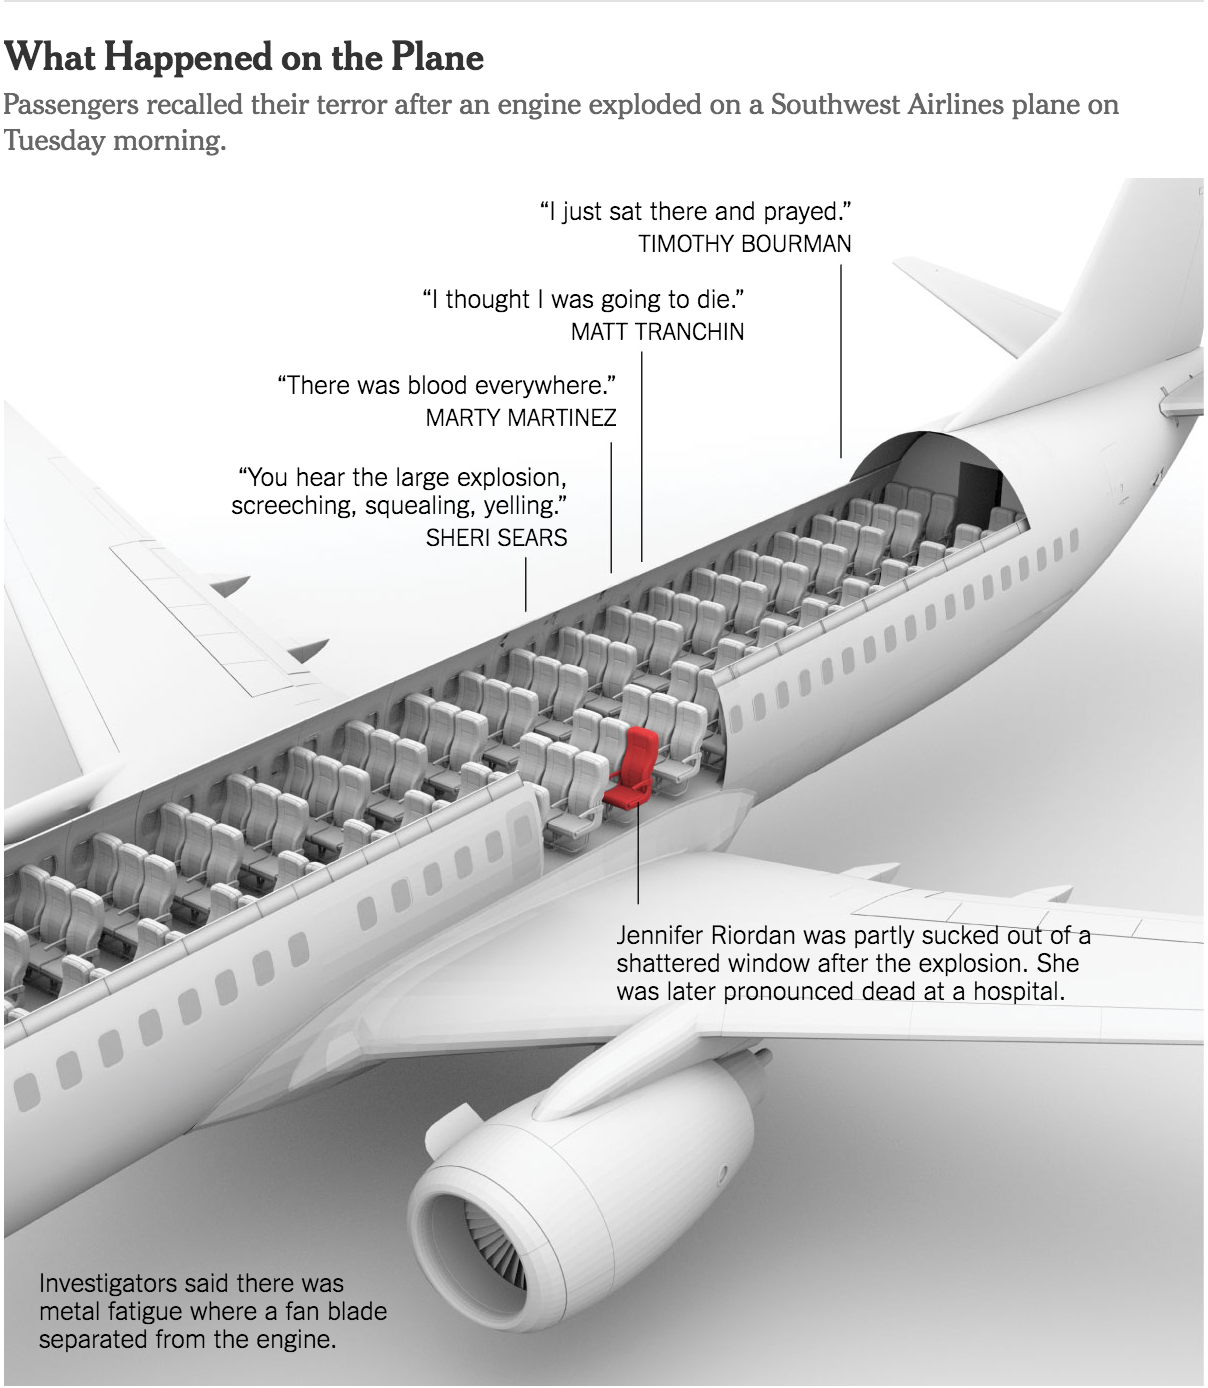
The New York Times’ piece is a bit more complex (and accompanied elsewhere in the article by a route map). It shows the seat of the dead passenger and the approximate locations of other passengers who provided quotes detailing their experiences.

The Times' graphic
The Times’ graphic

So the first thing that struck me was the complexity of the graphic. The Times opted for a three-dimension model whereas the Guardian went with a flat, two-dimensional schematic of the aircraft. Notice, though, that the seating layout is different.

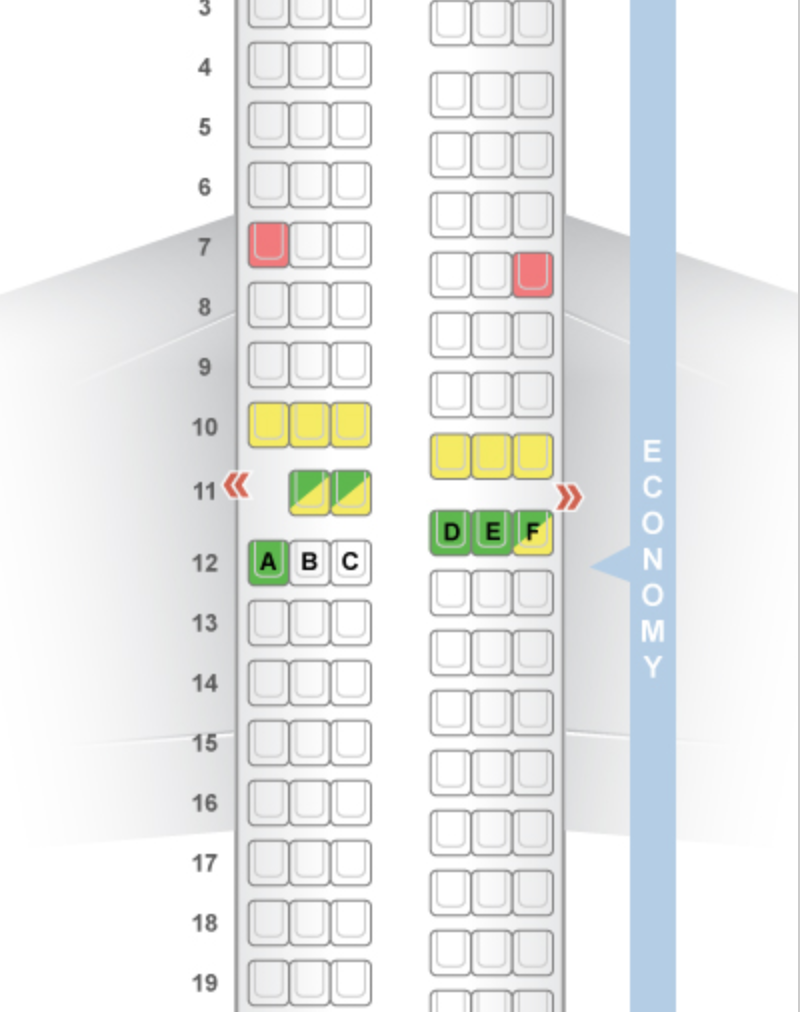
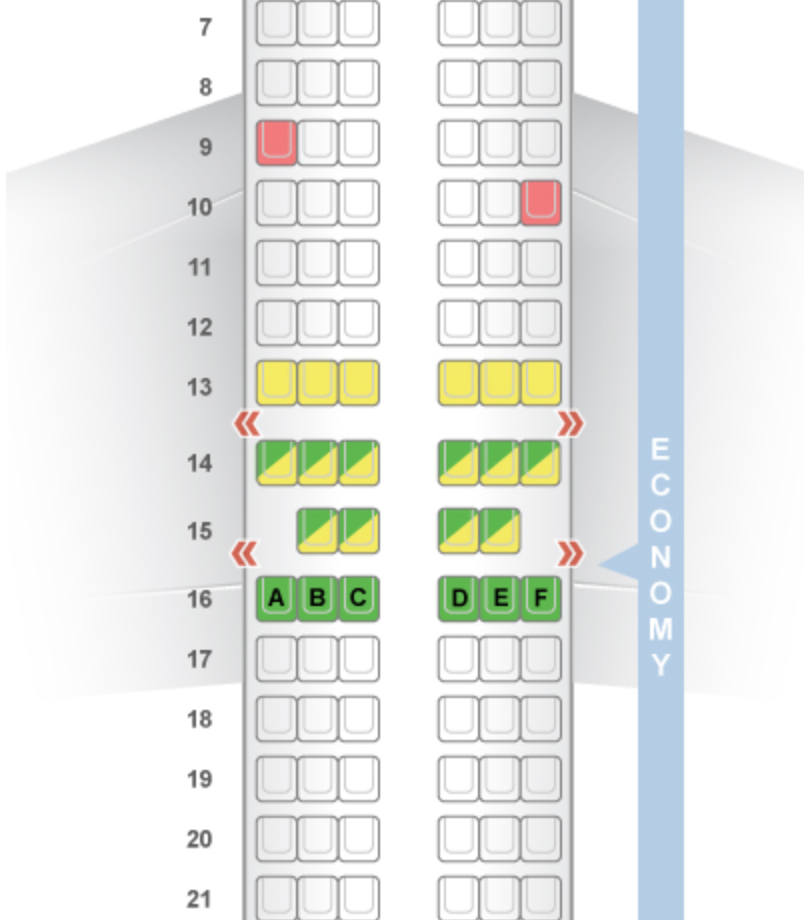
Four rows ahead of the circled window location are two seats, likely an exit row, in the Guardian’s graphic where in the Times’ piece they have a full three-seat configuration. If you check seating charts—seatguru.com was the first site that came up in the Google for me—you can see that neither configuration actually matches what the seating chart says should be the layout for a 737-700. Instead it, the Guardian’s more closely resembles the 737-800 model.

The 737-700 layout from SeatGuru.com

The 737-800 layout from SeatGuru.com

Nerding out on aircraft, I know. But, it is an interesting example of looking at the details in the piece. The Guardian’s piece is far closer to the layout, as least as provided by SeatGuru, and the New York Times’ is more representative of a generic narrow-body aircraft.

Personally, I prefer the Guardian in this case because of its improved accuracy at that level of detail. Though, the New York Times does offer some nice context with the passenger quotes. Unfortunately, the three-dimensional model ultimately provides just a flavour of the story, compared to the drier, but more accurate, schematic depiction of the Guardian.

Credit for the Guardian piece goes to the Guardian’s graphics department.

Credit for the New York Times piece goes to Anjali Singhvi, Sahil Chinoy, and Yuliya Parshina-Kottas.

The US Airline Industry

Yesterday Oscar Munoz, the CEO of United Airlines, testified to Congress about the airline industry. All of this just a few weeks after such a great week of press coverage. Of course, the last few weeks have also been a wee bit busy, so I was unable to post today’s piece. But with Munoz’s testimony it makes the perfect segue.

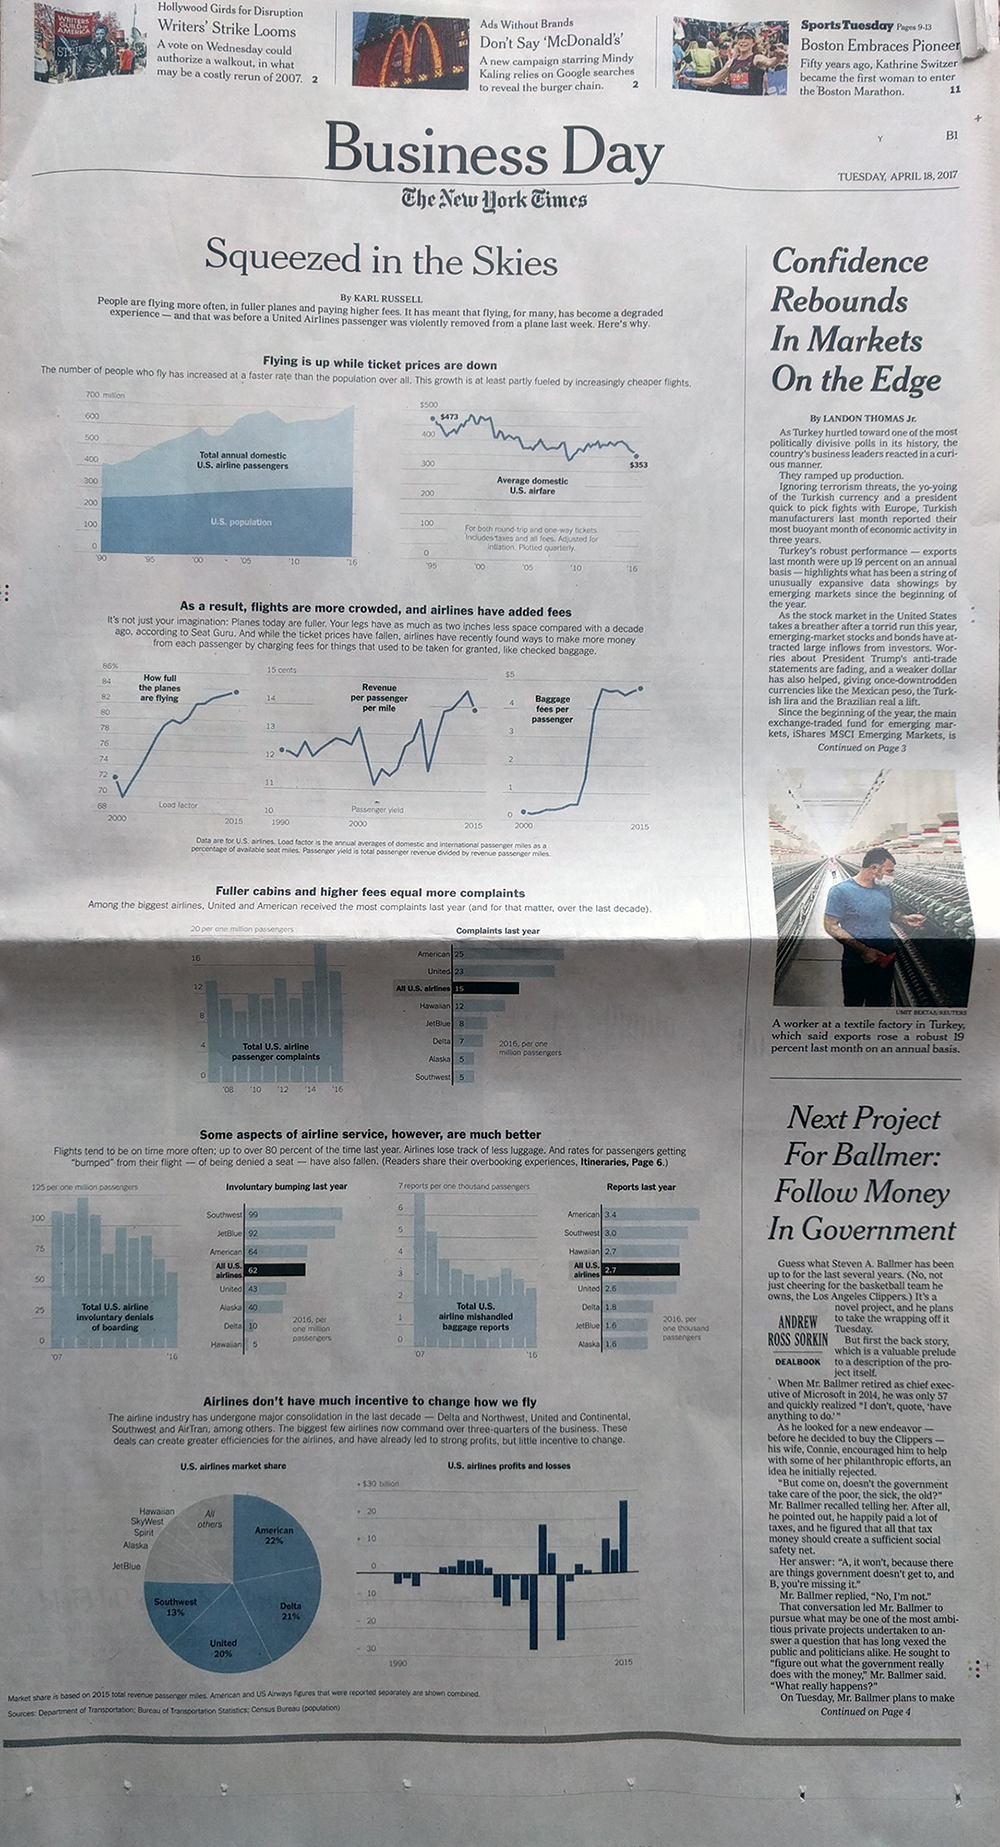
Today’s piece is a graphic article from the New York Times. It examines the state of the US airline industry. I use the term graphic article, because outside of headlines and subheads, it uses few words. Instead the point of the article is conveyed via charts. And what I found really nice is that, as the below photo shows, the article comprised most of the front page of the Business section.

The overall layout of the page

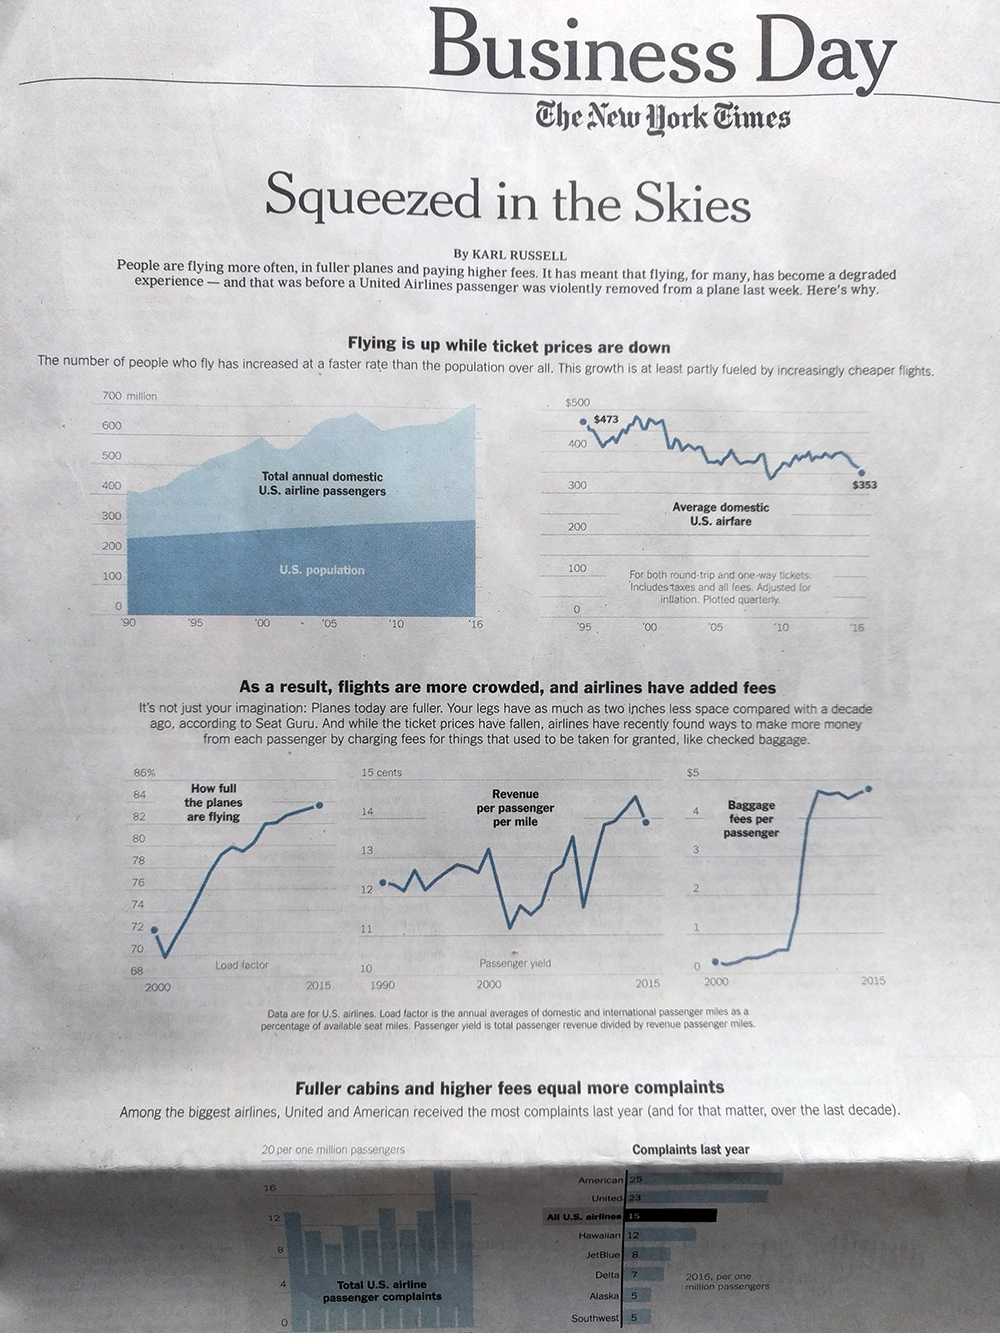
In terms of the structure, the piece did a nice job of giving breathing space around the various elements. This helps focus the reader’s attention on the charts and the data therein. Long headers and subheads break the vertical flow and create sentences or paragraphs that the charts prove.

The graphics above the fold

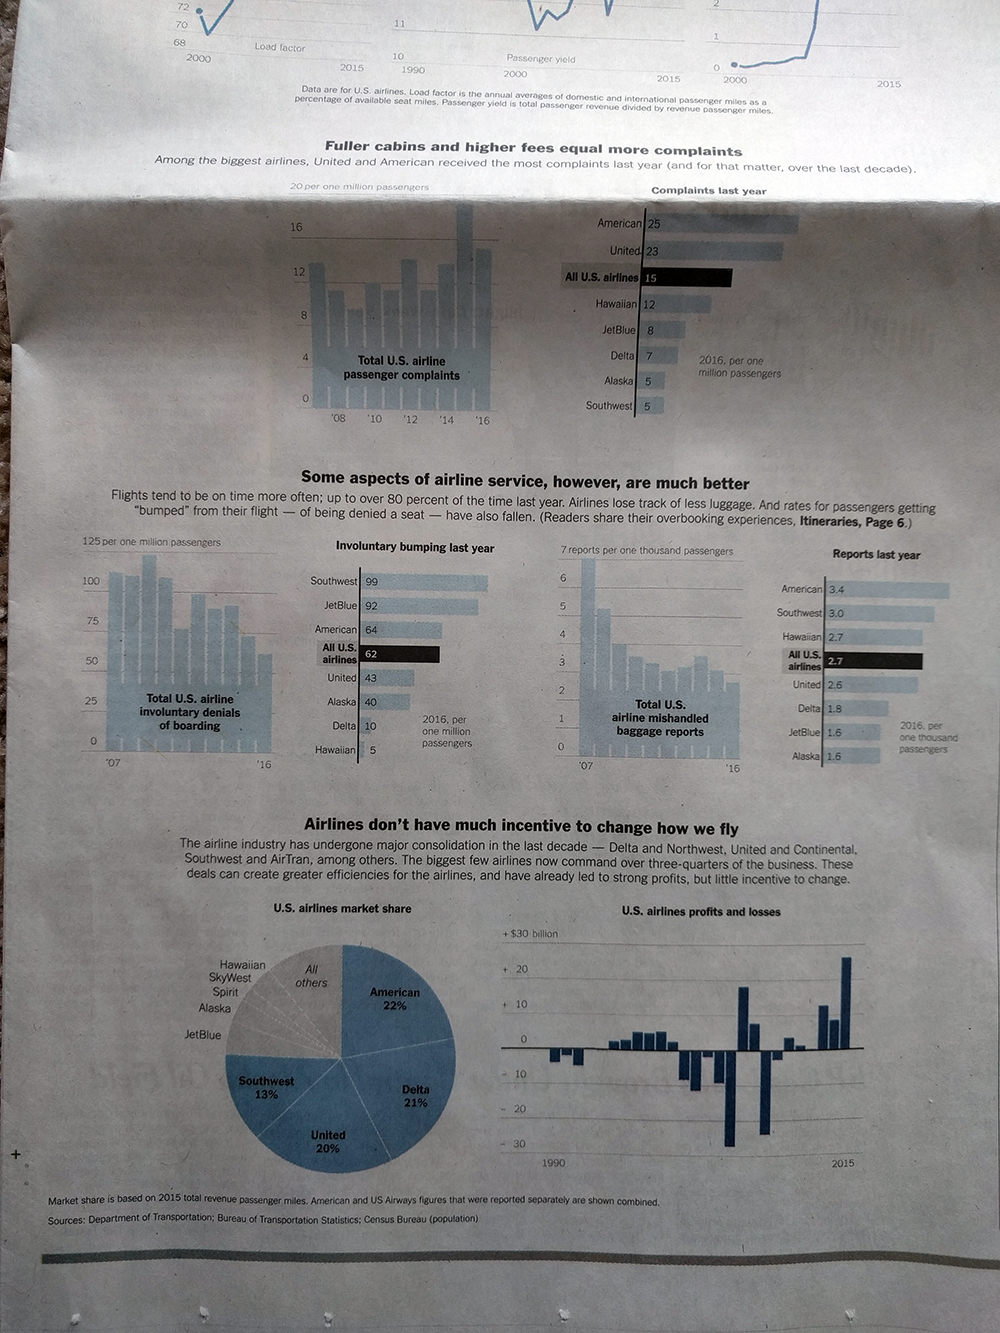
But then we get below the fold and low and behold we have a pie chart. I would have probably used a bar chart to show the market share. Especially with the top-three airlines so close. On the other hand, I can see the argument for the large, colour-filled visual. It does a nice job balancing the area charts at the opening and puts an emphatic period at the end of the piece.

And then below the fold

Overall, a solid piece and one that I am glad occupied a significant portion of the Business section front page.

Credit for the piece goes to Karl Russel.