The May Jobs Report

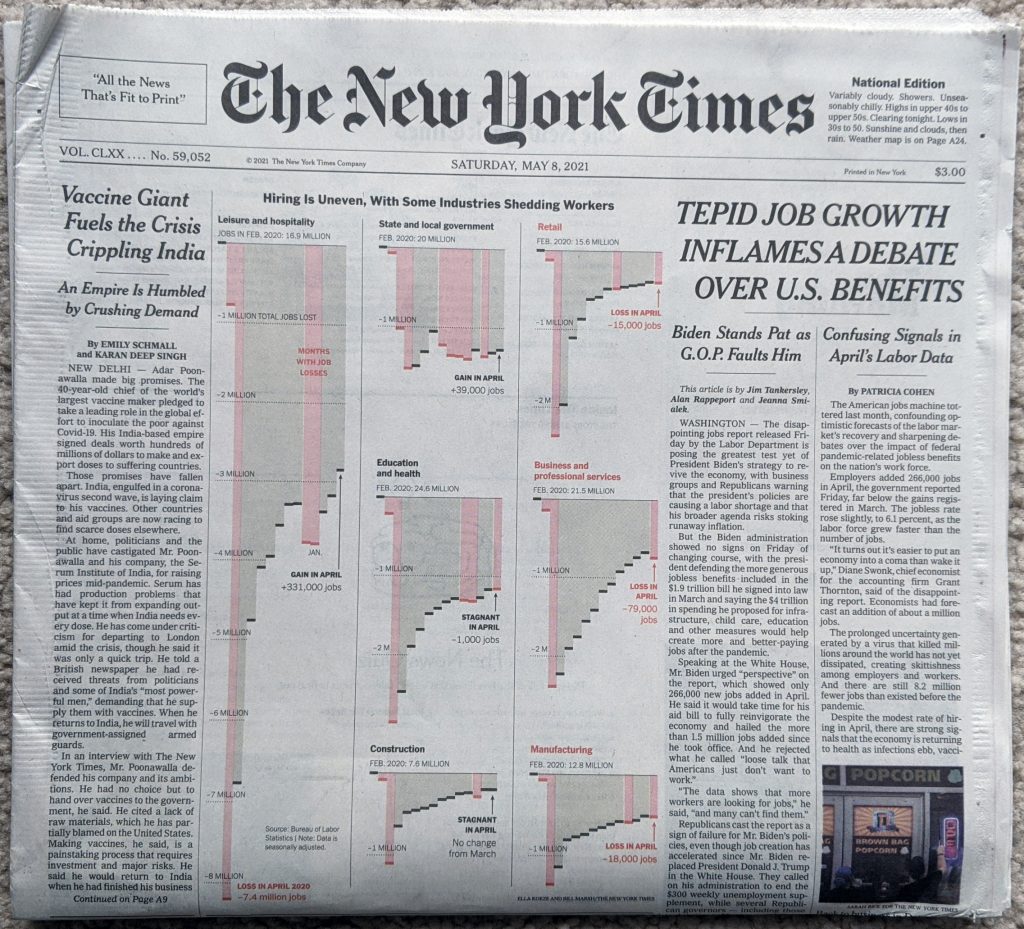
Last Friday, the government released the labour statistics from April and they showed a weaker rebound in employment than many had forecasted. When I opened the door Saturday morning, I got to see the numbers above the fold on the front page of the New York Times.
Welcome to the weekend

What I enjoyed about this layout, was that the graphic occupied half the above the fold space. But, because the designers laid the page out using a six-column grid, we can see just how they did it. Because this graphic is itself laid out in the column widths of the page itself. That allows the leftmost column of the page to run an unrelated story whilst the jobs numbers occupy 5/6 of the page’s columns.

If we look at the graphic in more detail, the designers made a few interesting decisions here.
Jobs in detail

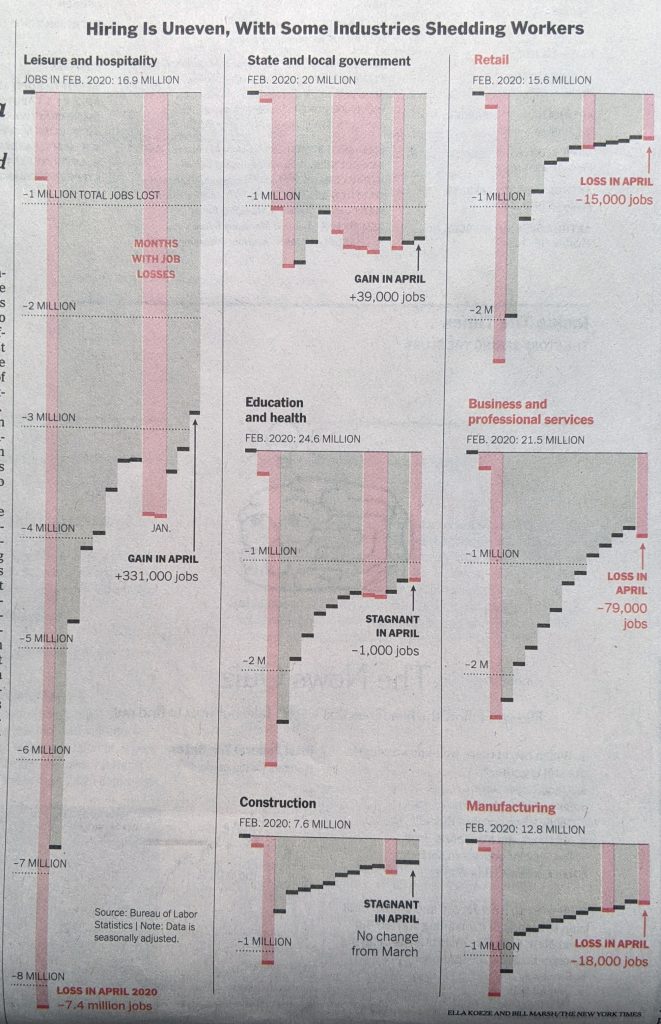
First, last week I discussed a piece from the Times wherein they did not use axis labels to ground the dataset for the reader. Here we have axis labels back, and the reader can judge where intervening data points fall between the two. For attention to detail, note that under Retail, Education and health, and Business and professional services, the “illion” in -2 Million was removed so as not to interfere with legibility of the graphic, because of bars being otherwise in the way.

My issue with the axis labels? I have mentioned in the past that I don’t think a designer always needs to put the maximum axis line in place, especially when the data point darts just above or below the line. We see this often here, for example Construction and Manufacturing both handle it this way for their minimums. This works for me.

But for the column above Construction, i.e. State and local government and Education and health, we enter the space where I think the graphic needs those axis lines. For Education and health, it’s pretty simple, the red losses column looks much closer to a -3 million value than a -2 million value. But how close? We cannot tell with an axis line.

And then under State and local government we have the trickier issue. But I think that’s also precisely why this could use some axis lines. First, almost all the columns fall below the -1 million line. This isn’t the case of just one or two columns, it’s all but two of them. Second, these columns are all fairly well down below the -1 million axis line. These aren’t just a bit over, most are somewhere between half to two-thirds beyond. But they are also not quite nearly as far to -2 million as the ones we had in the Education and health growth were near to -3 million.

So why would I opt to have an axis line for State and local governments? The designers chose this group to add the legend “Gain in April”. That could neatly tuck into the space between the columns and the axis line.

Overall it’s a solid piece, but it needs a few tweaks to improve its legibility and take it over the line.

Credit for the piece goes to Ella Koeze and Bill Marsh.

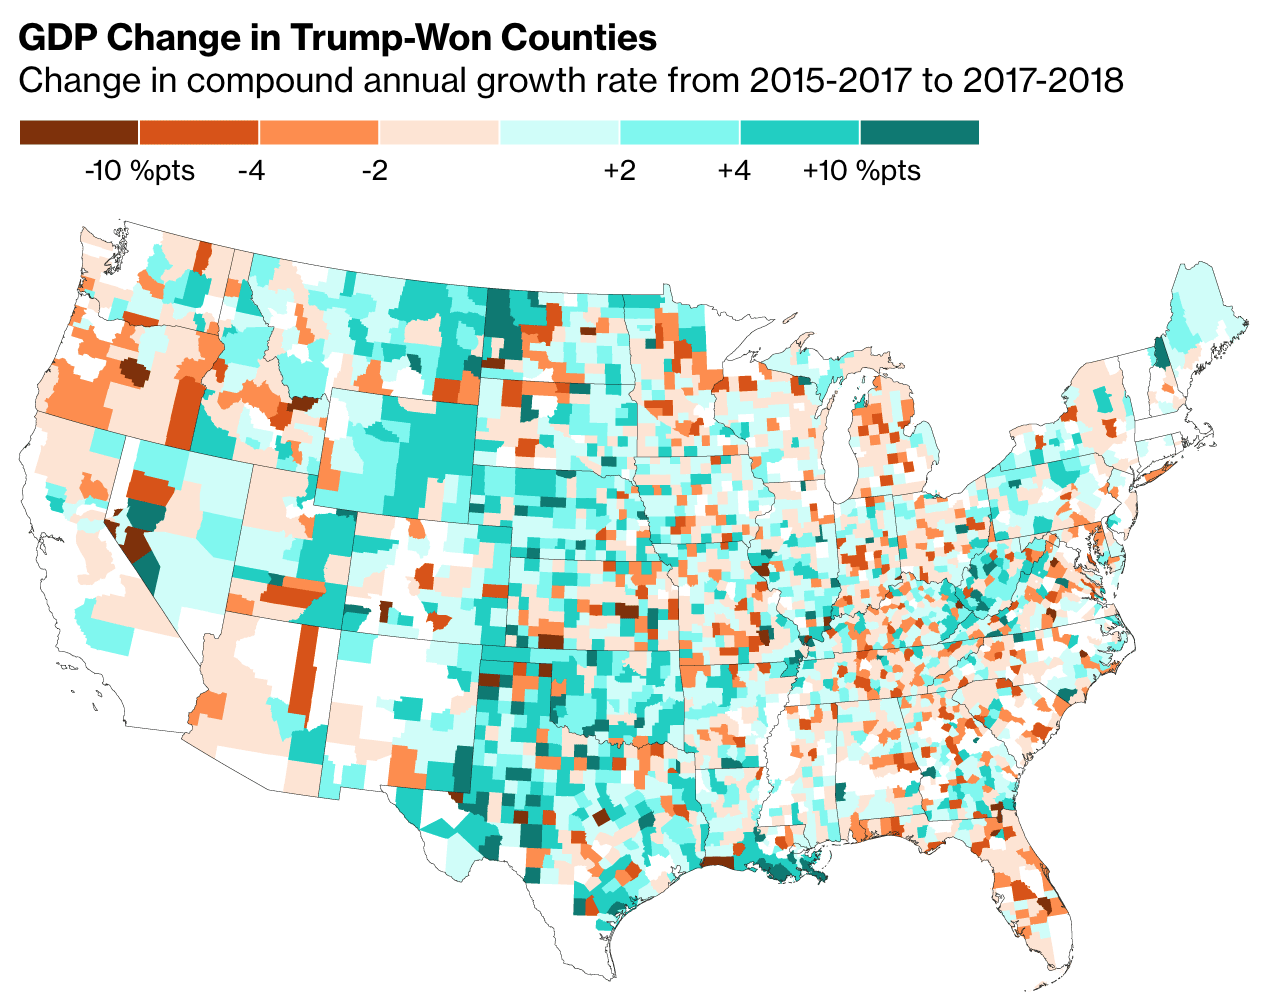
Trump-won Counties Are Winning

Yesterday we looked at how China and the European Union are planning their tariff/trade war retaliation to target Trump voters. Today let’s take a look at how those voters are doing as this article from Bloom does.

Lots of green, but some noticeably red counties in Florida.

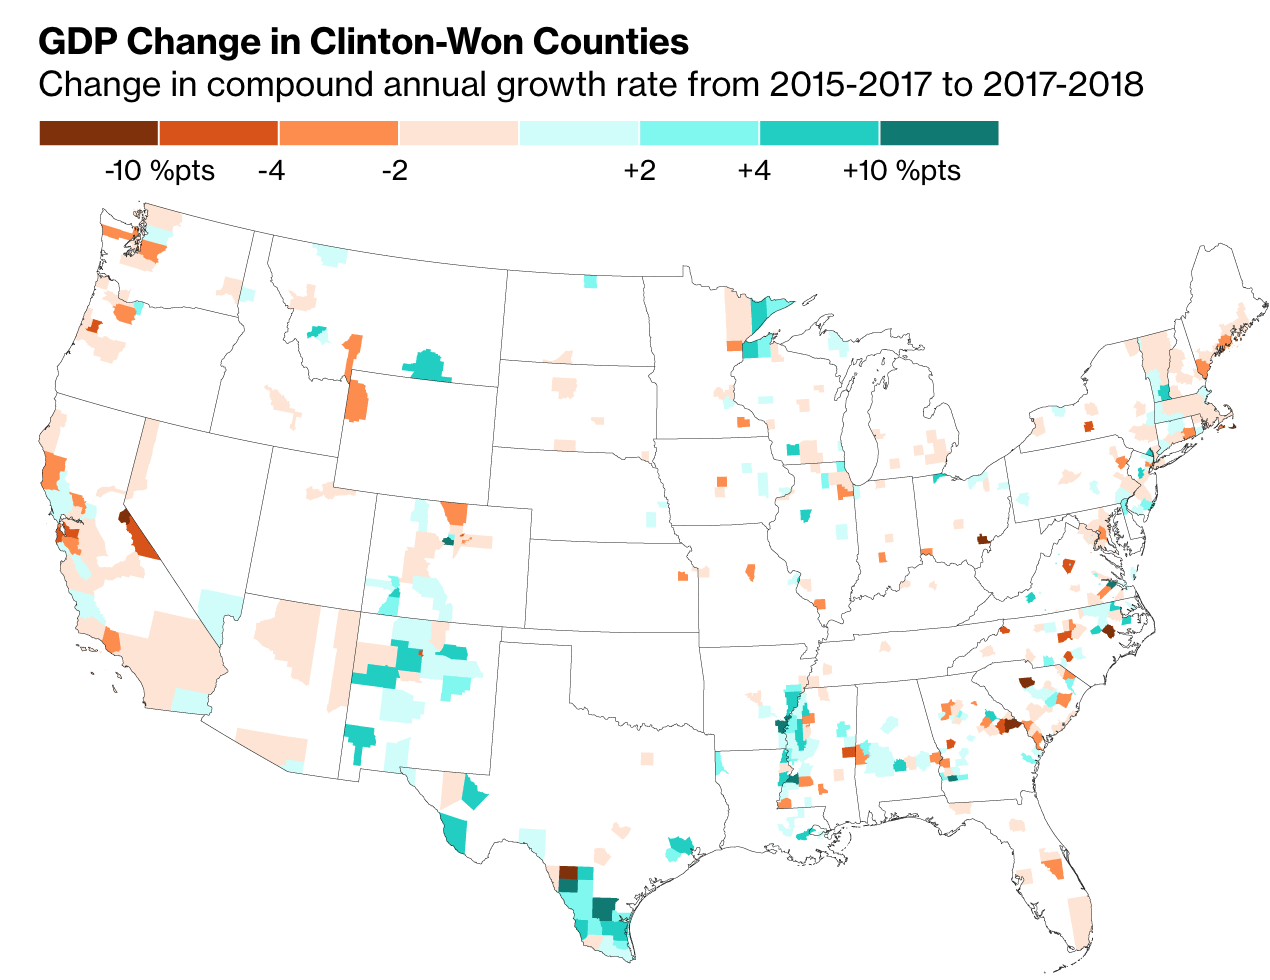
The article is not terribly complicated. We have four choropleth maps at the county level. Two of the maps isolate Trump-won counties and the other two are Clinton-won. For each candidate we have a GDP growth and an employment growth map.

In the Trump-won maps, the Clinton-won counties are white, and vice versa. Naturally, because the Democratic vote is greatest in the large cities, which, especially on the East Coast, are in tiny counties, you see a lot less colour in the Clinton maps.

Not a whole lot to see here…

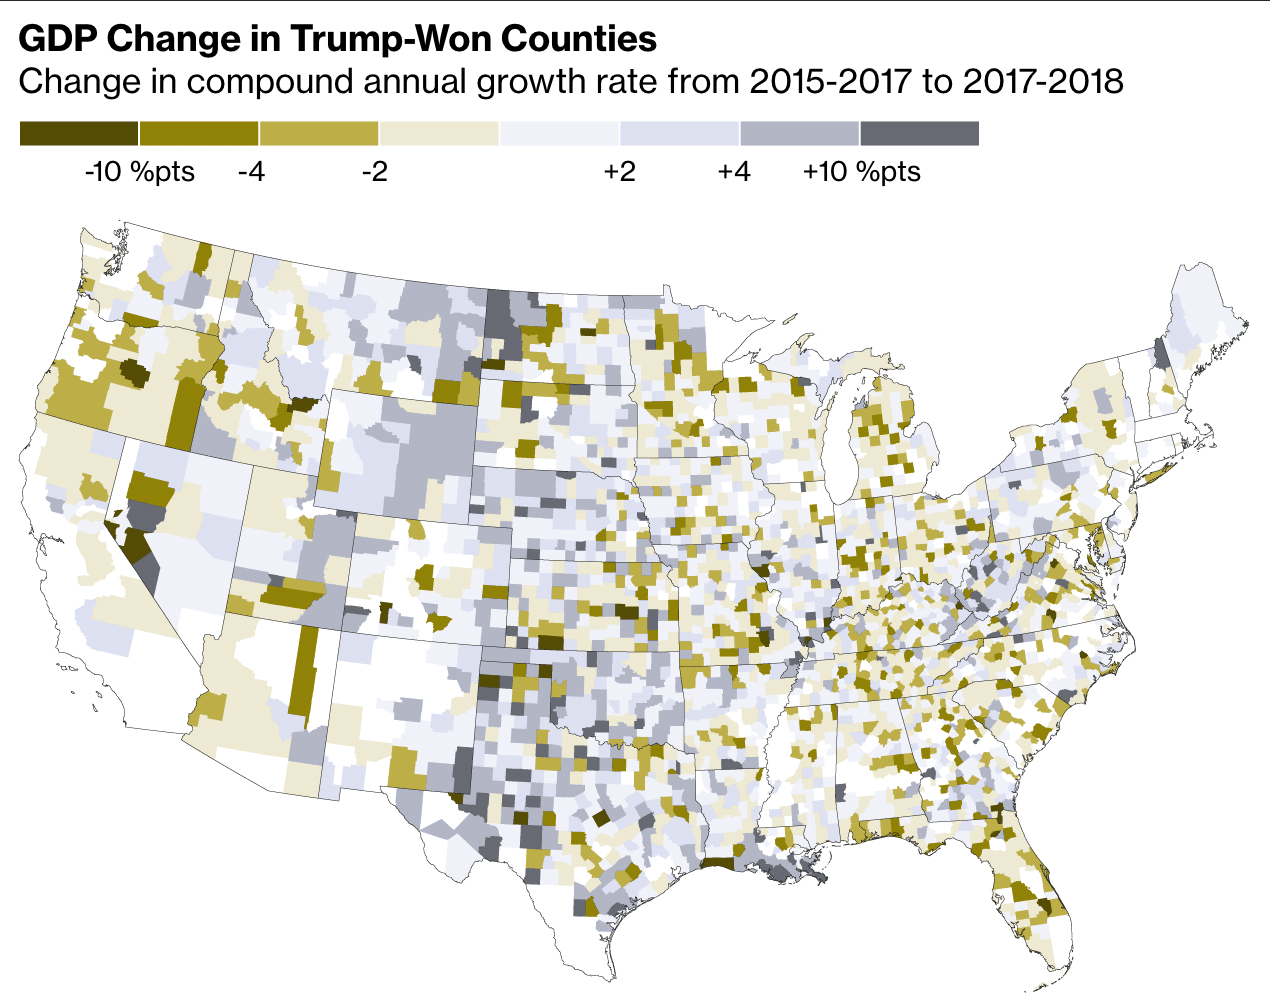
Design wise, I should point out the obvious that green-to-red maps are not usually ideal. But the designers did a nice job of tweaking these specific colours so that when tested, these burnt oranges and green-blues do provide contrast.

Here they appear more of a yellow to grey

But I am really curious to see this data plotted out in a scatter plot. Of course the big counties in the desert southwest are noticeable. But what about Philadelphia County? Cook County? Kings County? A scatter plot would make them equally tiny dots. Well, hopefully not tiny. But then when you compare GDP growth and employment growth and benchmark them against the US average, we might see some interesting patterns emerge that are otherwise masked behind the hugeness of western counties.

But lastly. And always. Where. Are .Alaska. And. Hawaii? (Of course the hugeness problem is of a different scale in Hawaii. Their county equivalents are larger than states combined.)

Credit for the piece goes to the Bloomberg graphics department.

Differences Between Print and Online

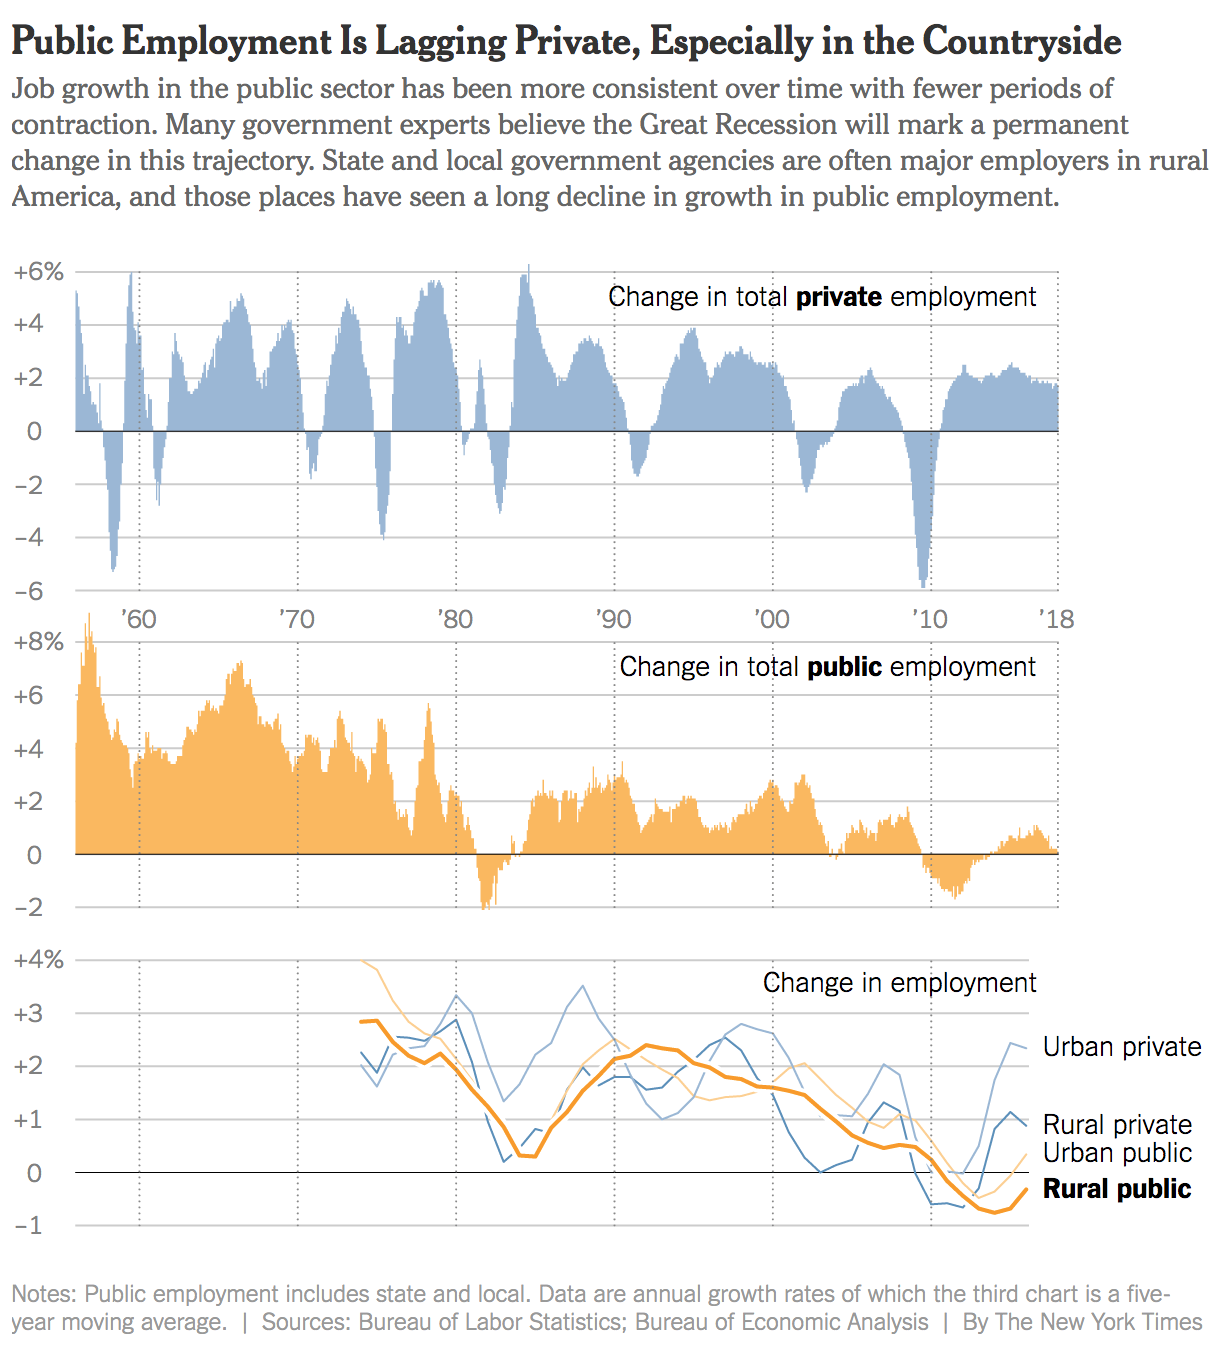
On Monday I read, in print, part of a page one article in the Times. I ran out of times given the whole new royal baby coverage, and opted to read the rest digitally. Originally, this was just for my own enjoyment as there were no graphics in the article.

But this one appeared online.

It's a nice graphic too…
It’s a nice graphic too…

I clearly have nothing to compare it to in print, which is a shame because this is a nice graphic with one thing I really wanted to point out. Although, maybe a print version would not have had the thing I will get to. But maybe there just wasn’t space in the print edition or they tried to make it work, but the colours or layout wasn’t working. Who knows.

When I saw the digital version, the line chart struck me as particularly nice. Now, maybe the Times has been doing this for a little while and I have missed it, but notice the highlighted line, Rural public. Yes the line is thicker or bolder than the others, but more importantly it has a thin white stroke attached that helps separate it from the lines behind it. Those lines are important for context, but not necessarily to tell the story of how rural public servant jobs have been hit the hardest.

You often see this kind of approach taken with maps. Don’t believe me? Take a look at Google Maps as one example. Their text often has a thin white outline to make it stand out from the content of the map. I just have never seen the logic applied to a line chart.

I doubt the design would hold up in a number of other scenarios. For example, a straight line chart with no line highlighted in particular, the spaghetti-ness mess would make the above a largely white line chart. Too much overlap. And a simple comparison, say of two lines, probably is clear enough that the approach is not necessary. But in scenarios like these where the highlighted series is important, the choice clearly works.

On a much smaller note, check out the x-axis labels. They are used only once for the first chart. And then because the bar charts and line charts align, they carry through straight down the rest of the piece. Very efficient.

I only wish I knew how this would have appeared in print…

Credit for the piece goes to the New York Times graphics department.

Farewell, Summer (Jobs)

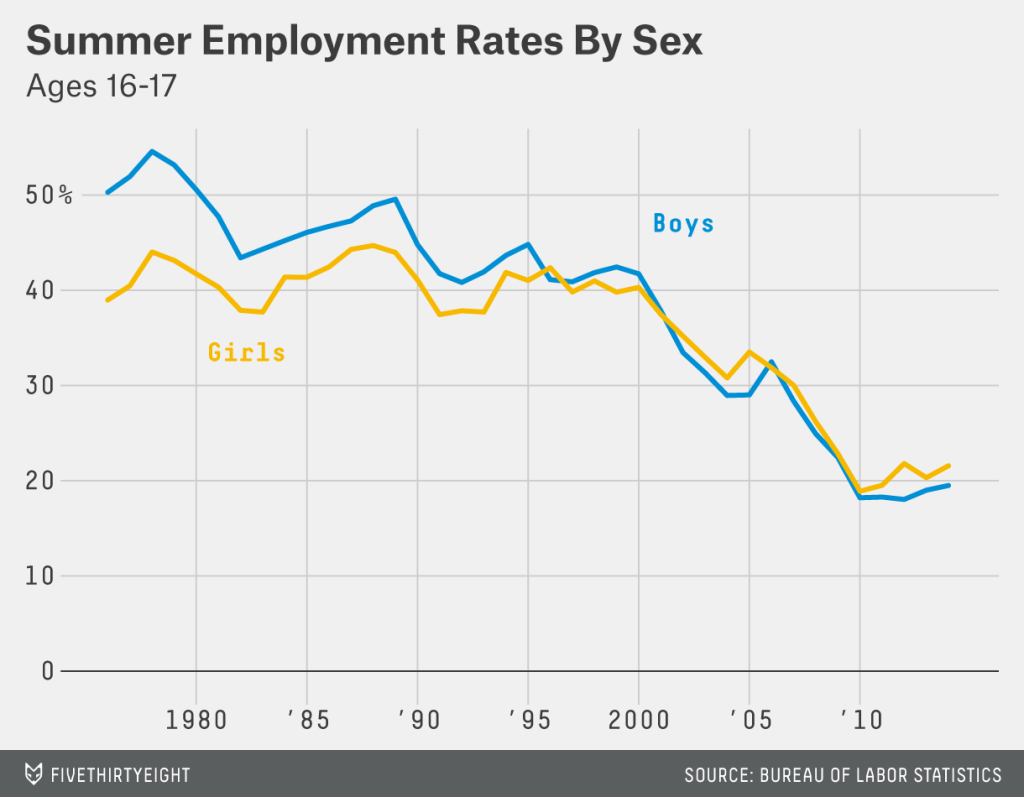
Sorry (American) folks, but Labour Day just came and went. And for us (Americans) that means summer has “officially” ended. Back in the day, for your humble author, that meant preparing to wrap up my summer employment at the Jersey Shore. The Sidewalk Sale was the great clearing of summer stock and most of us teenagers’ last working day. Fast-forward a decade and it turns out most teenagers are no longer working summer jobs. Five Thirty Eight put together a small set of graphics to support an article explaining the decline. (It’s not all recession-related.)

Teen employment in summer by gender

Welcome to autumn, folks.

Credit for the piece goes to Ben Casselman.