New Mexico Burns

Editor’s note: I was having some technical issues last week. This was supposed to post last week.

Editor’s note two: This was supposed to go up on Monday. Still didn’t. Third time’s the charm?

Yesterday I wrote about a piece from the New York Times that arrived on my doorstep Saturday morning. Well a few mornings earlier I opened the door and found this front page: a map of the western United States highlighting the state of New Mexico.
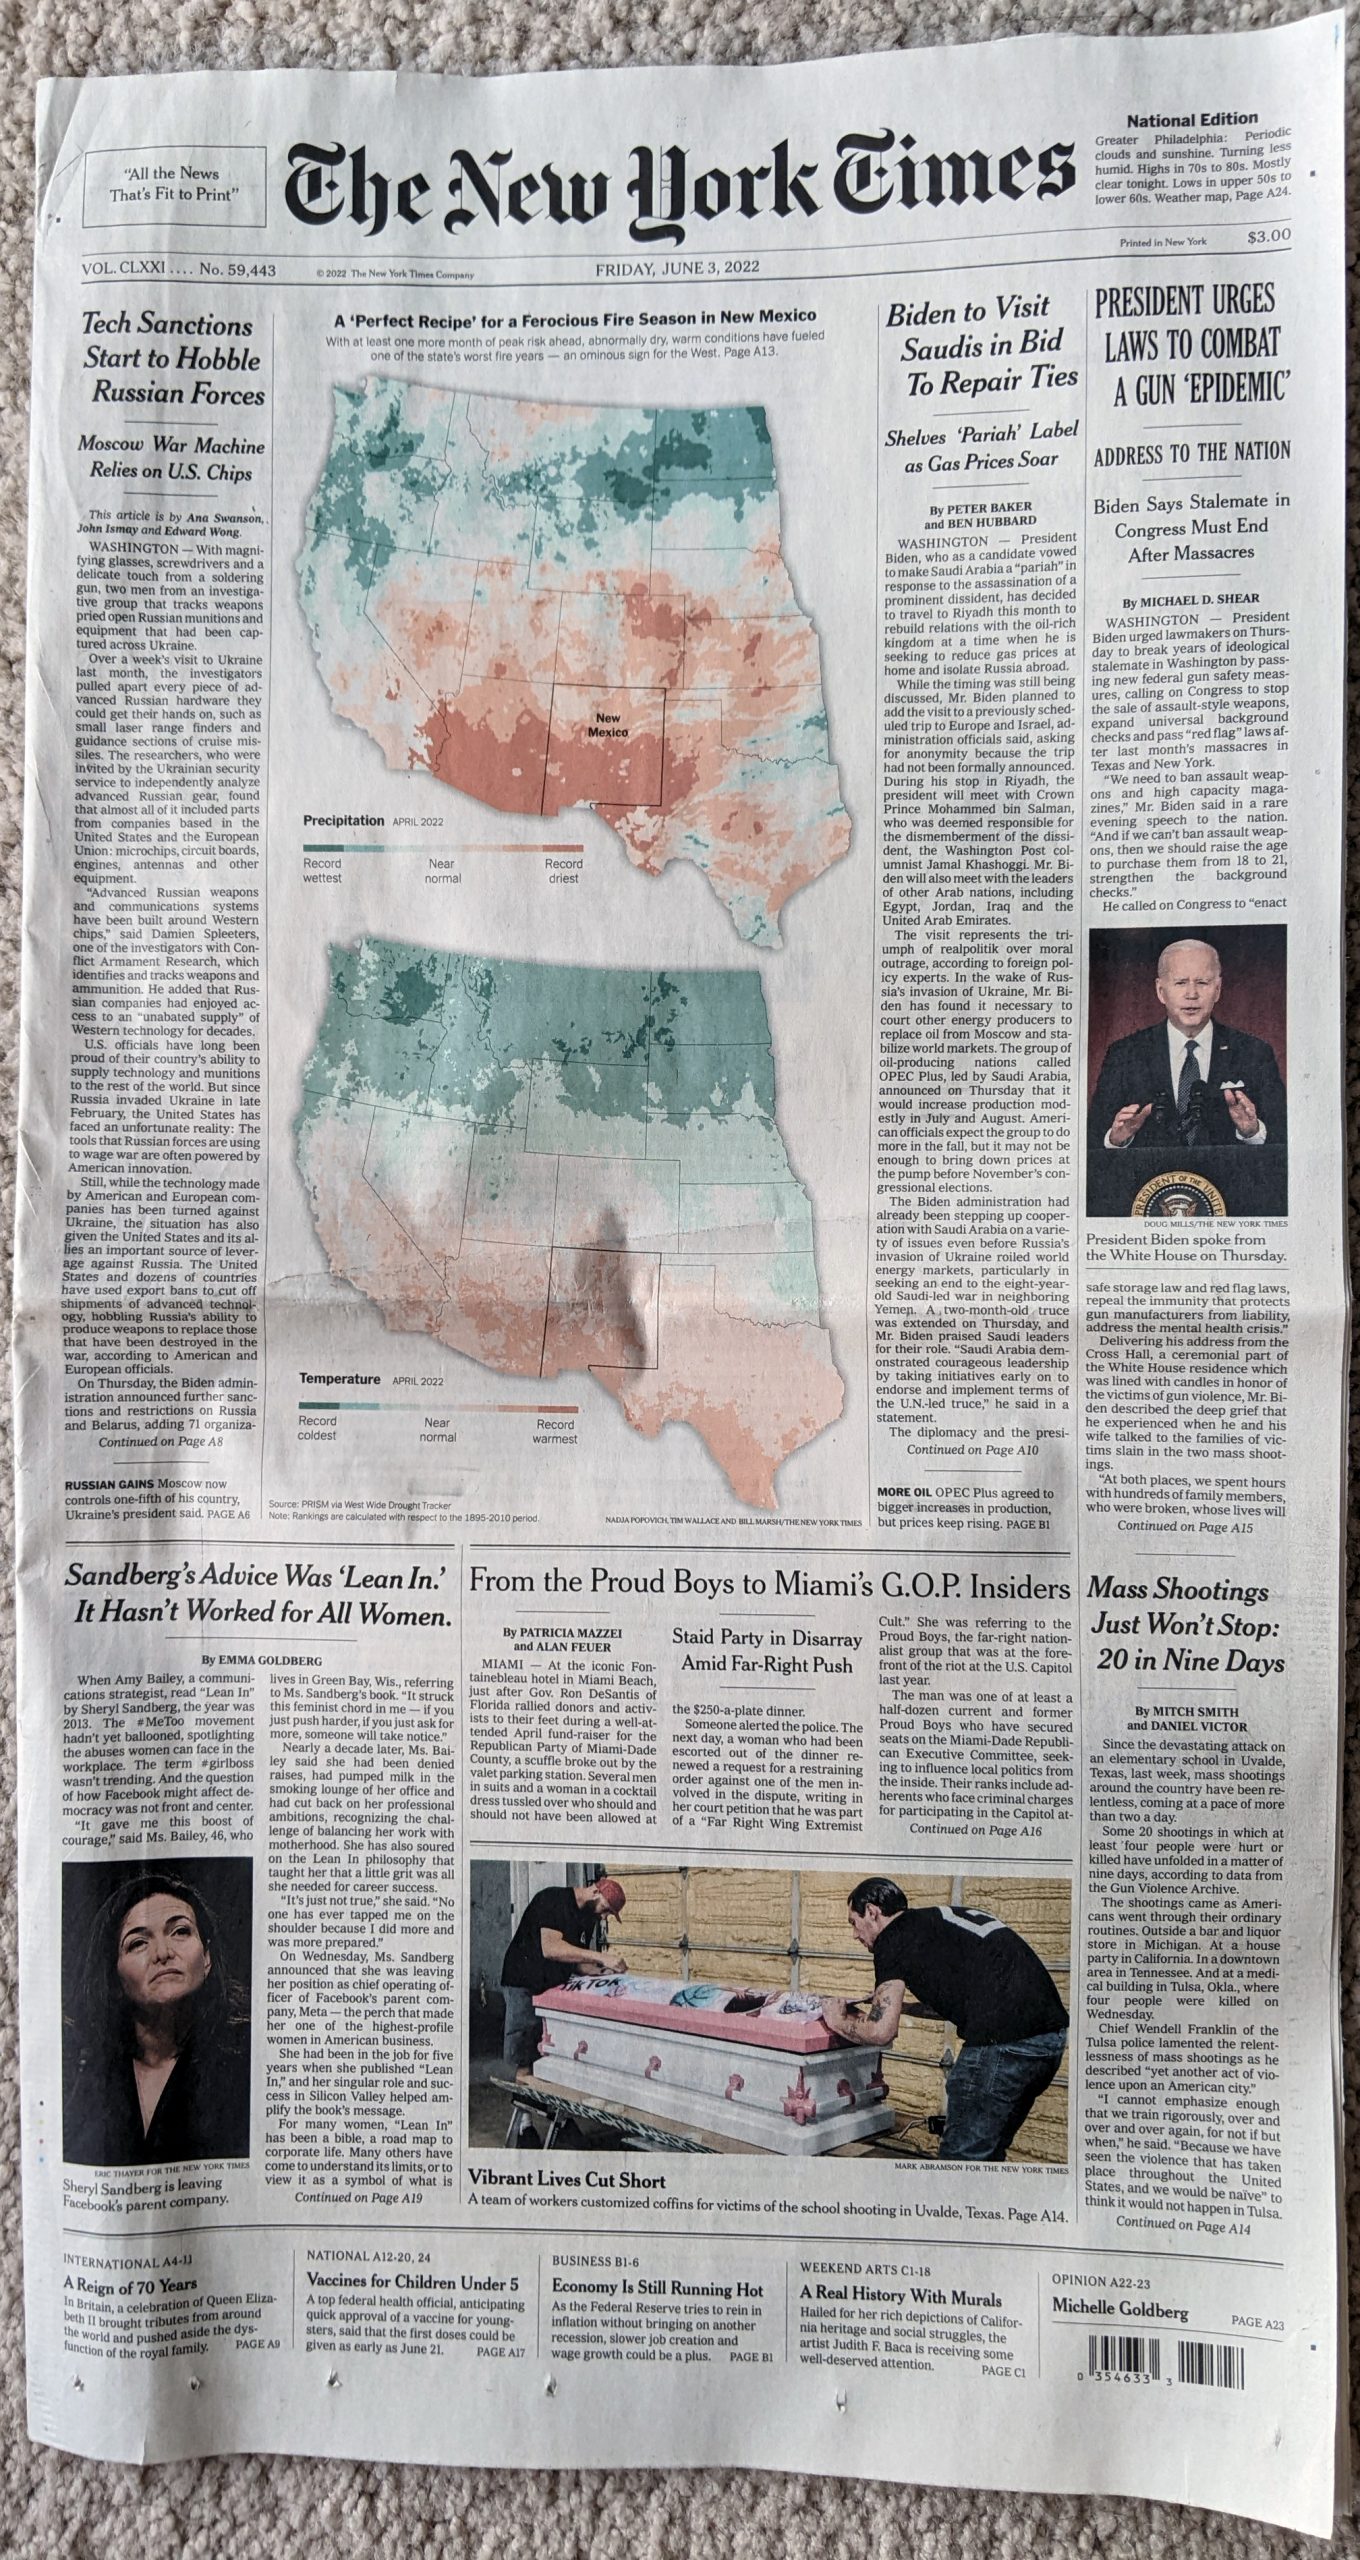
That doesn’t exactly look like a climate I’d enjoy.

Unlike the graphic we looked at yesterday, this graphic stretched down the page and below the fold, not by much, but still notably. The maps are good and the green–red spectrum passes the colour blind test. How the designer chose to highlight New Mexico is subtle, but well done. As the temperature and precipitation push towards the extreme, the colours intensify and call attention to those areas.

Also unlike the graphic we looked at yesterday, this piece contained some additional graphics on the inside pages.
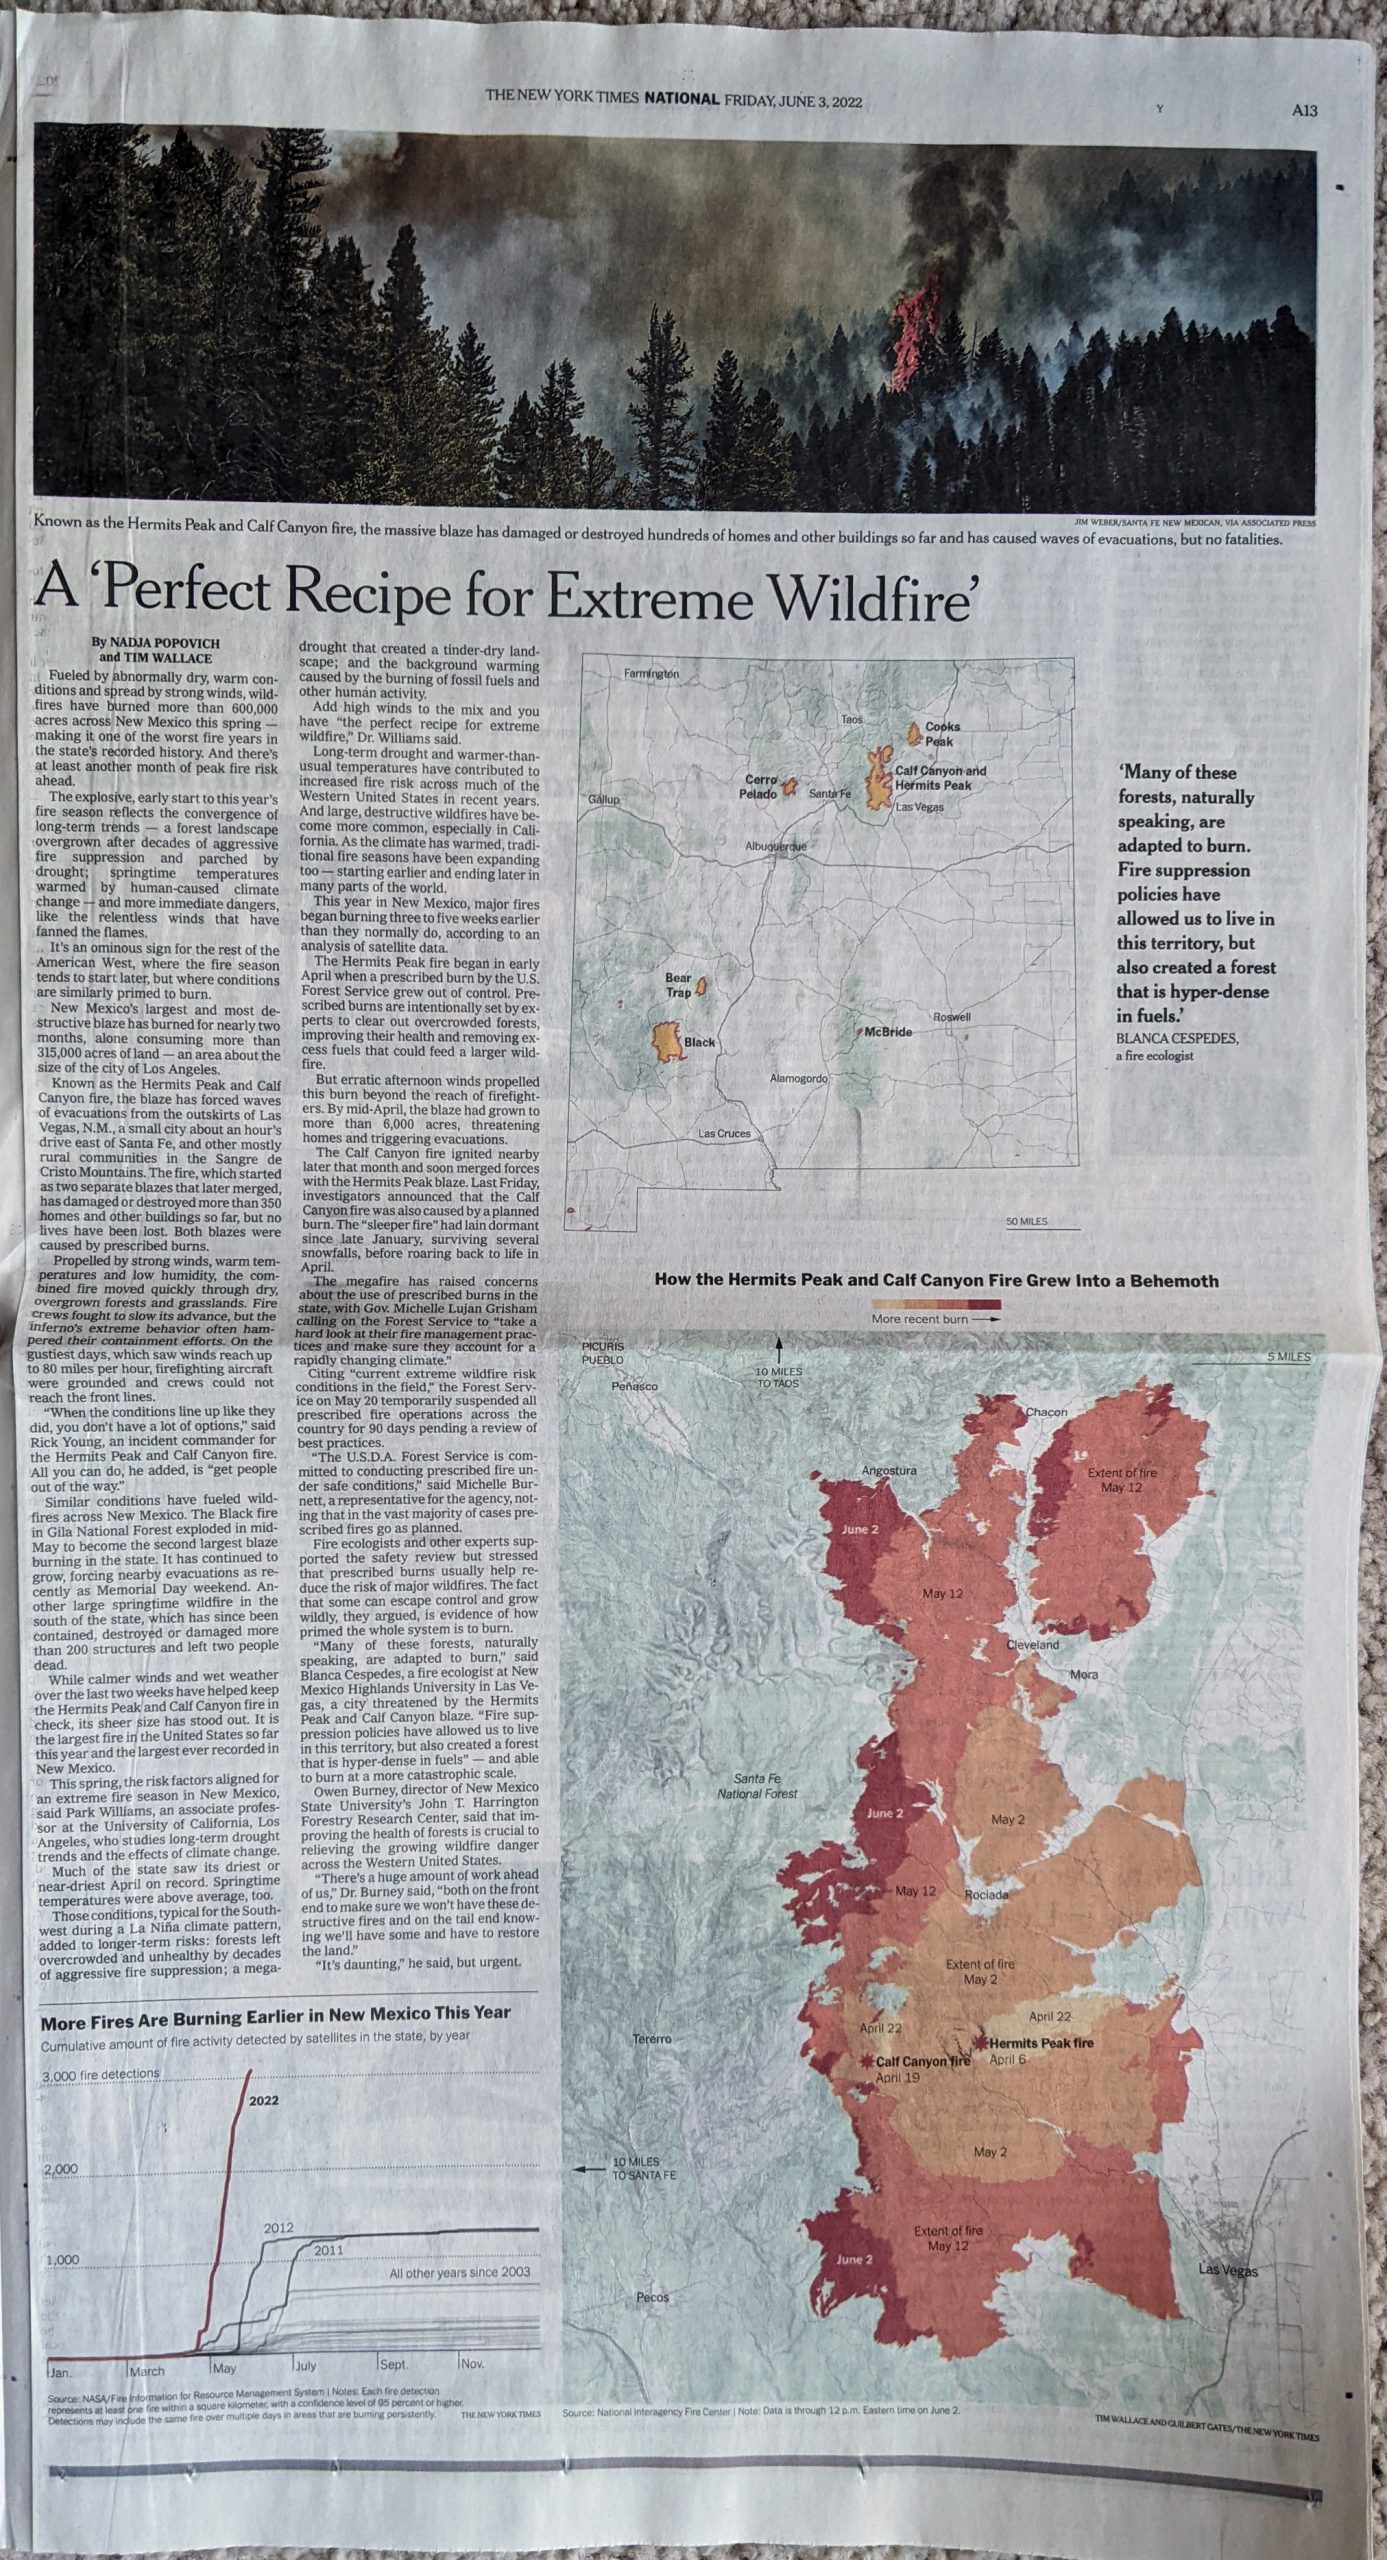
Definitely not a place where I want to be.

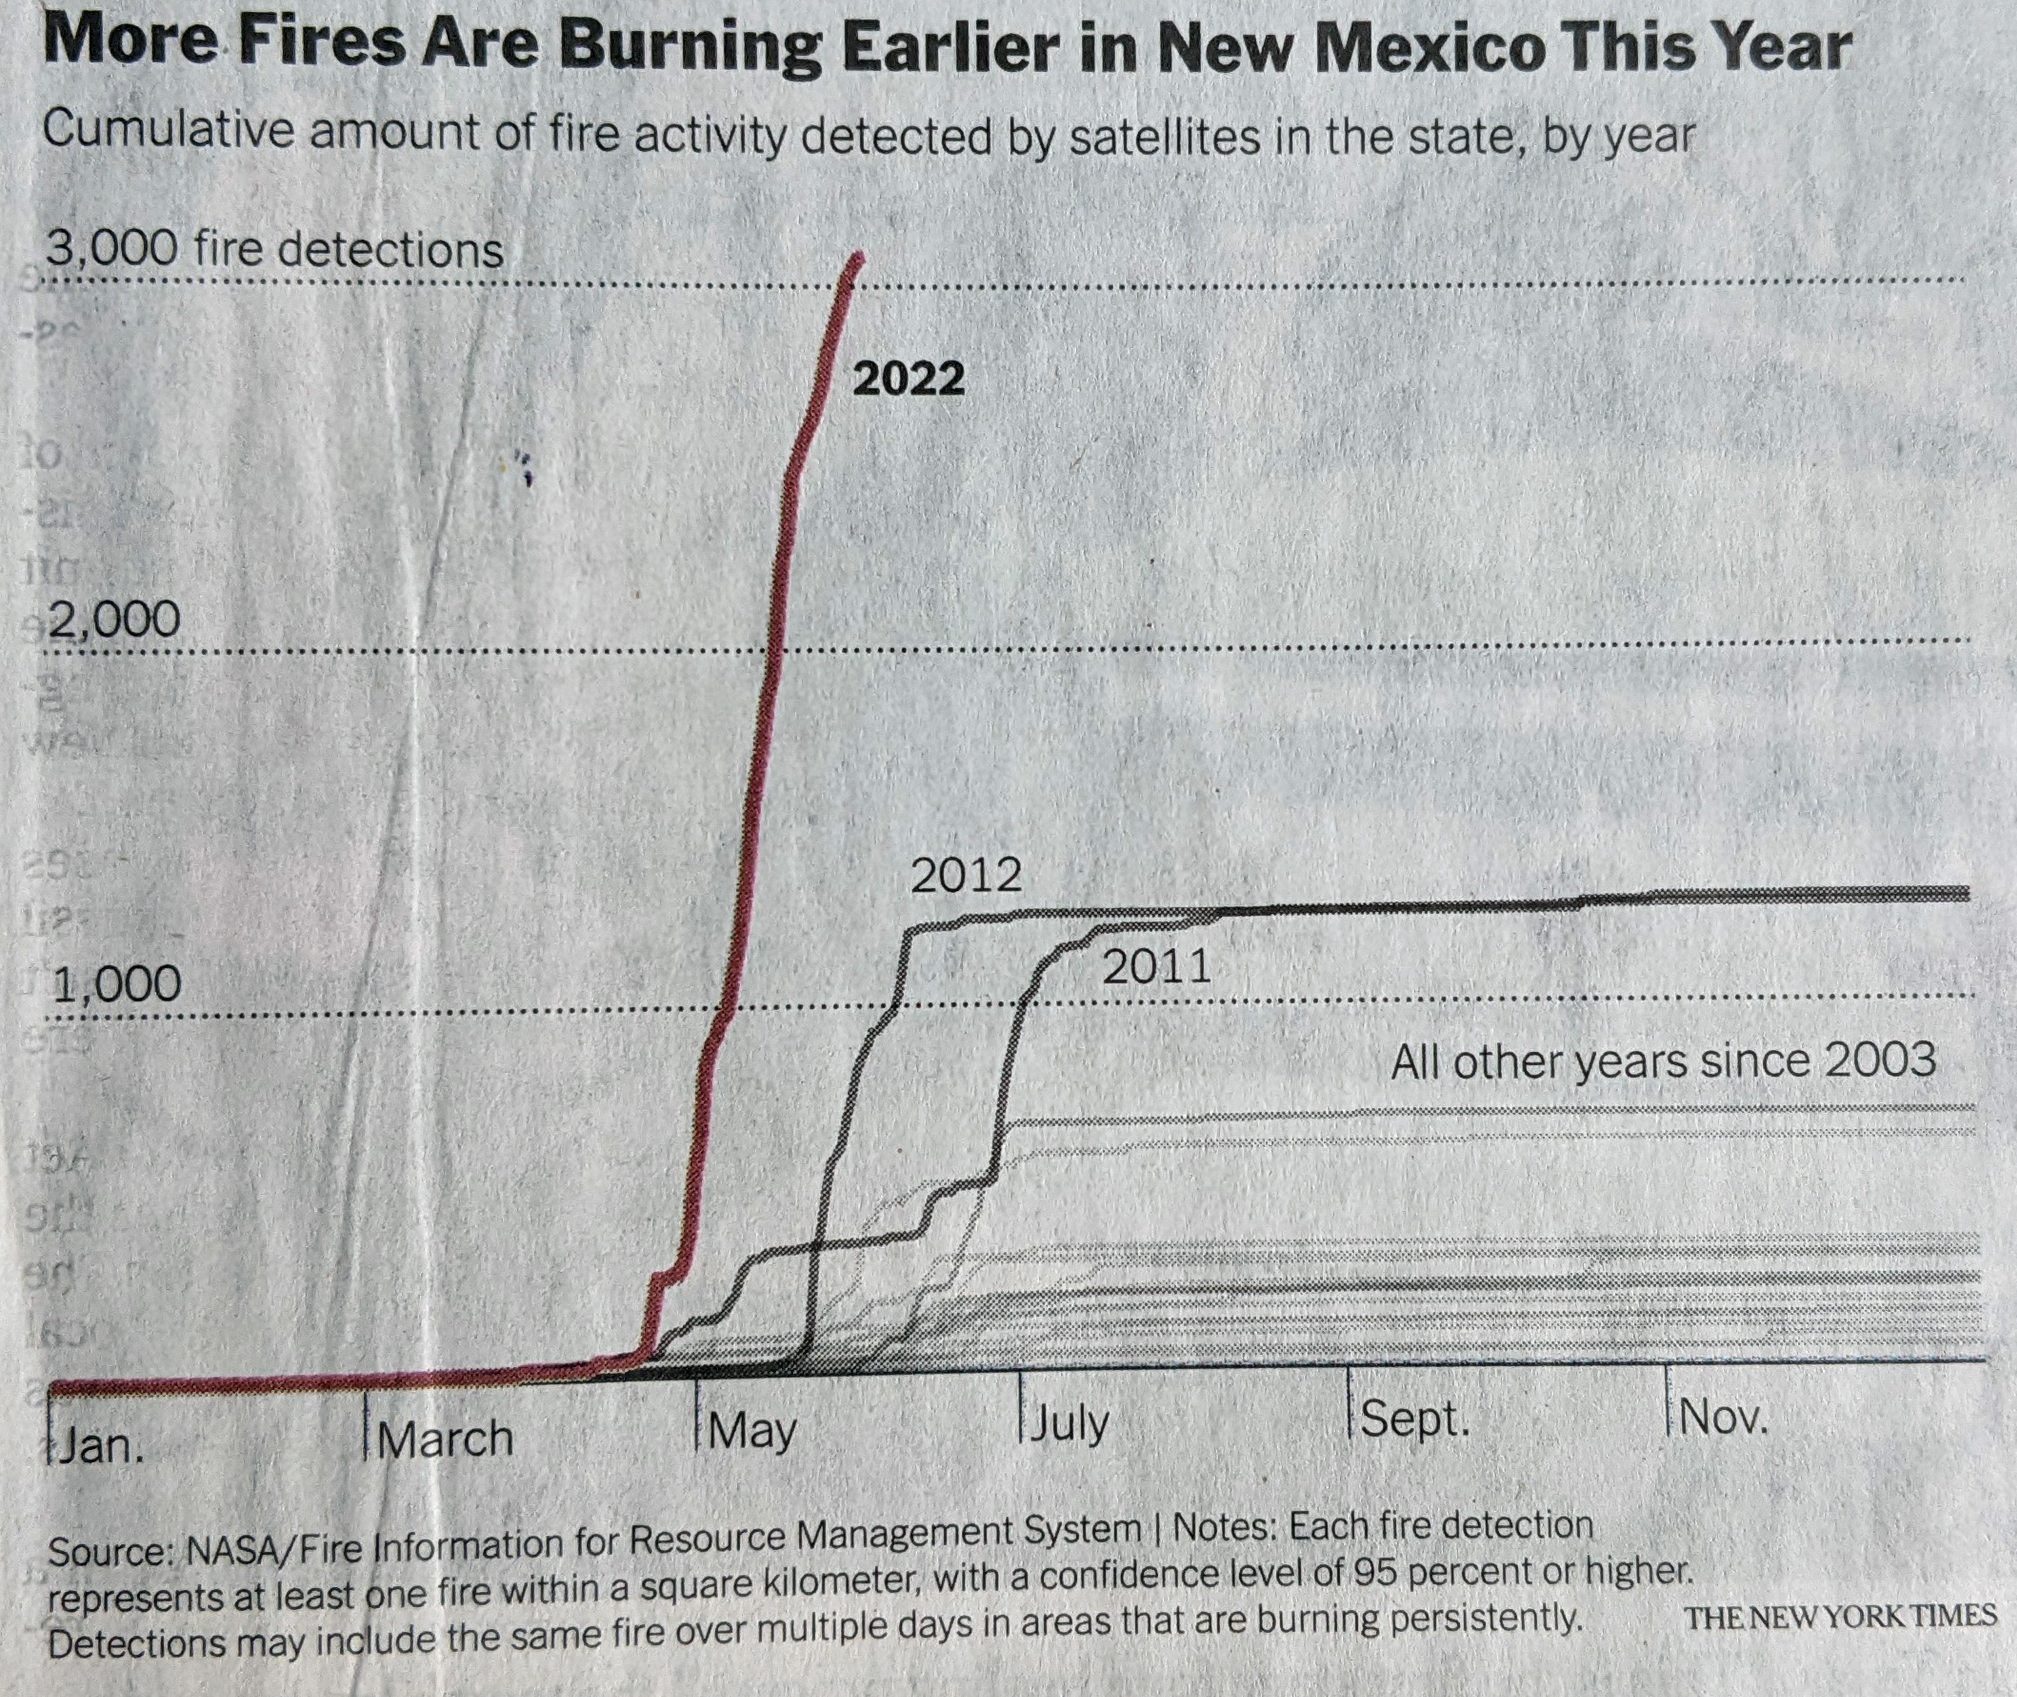
These are also nicely done. Starting with the line chart at the bottom of the page, we can contrast this to some of the charts we looked at yesterday.
Burn, baby, burn.

Here the designer used axis lines and scales to clearly indicate the scale of New Mexico’s wildfire problem. Not only can you see that the number of fires detected has spiked far above than the number in the previous years back to 2003. And not only is the number greater, the speed at which they’ve occurred is noticeably faster than most years. The designer also chose to highlight the year in question and then add secondary importance to two other bad years, 2011 and 2012.

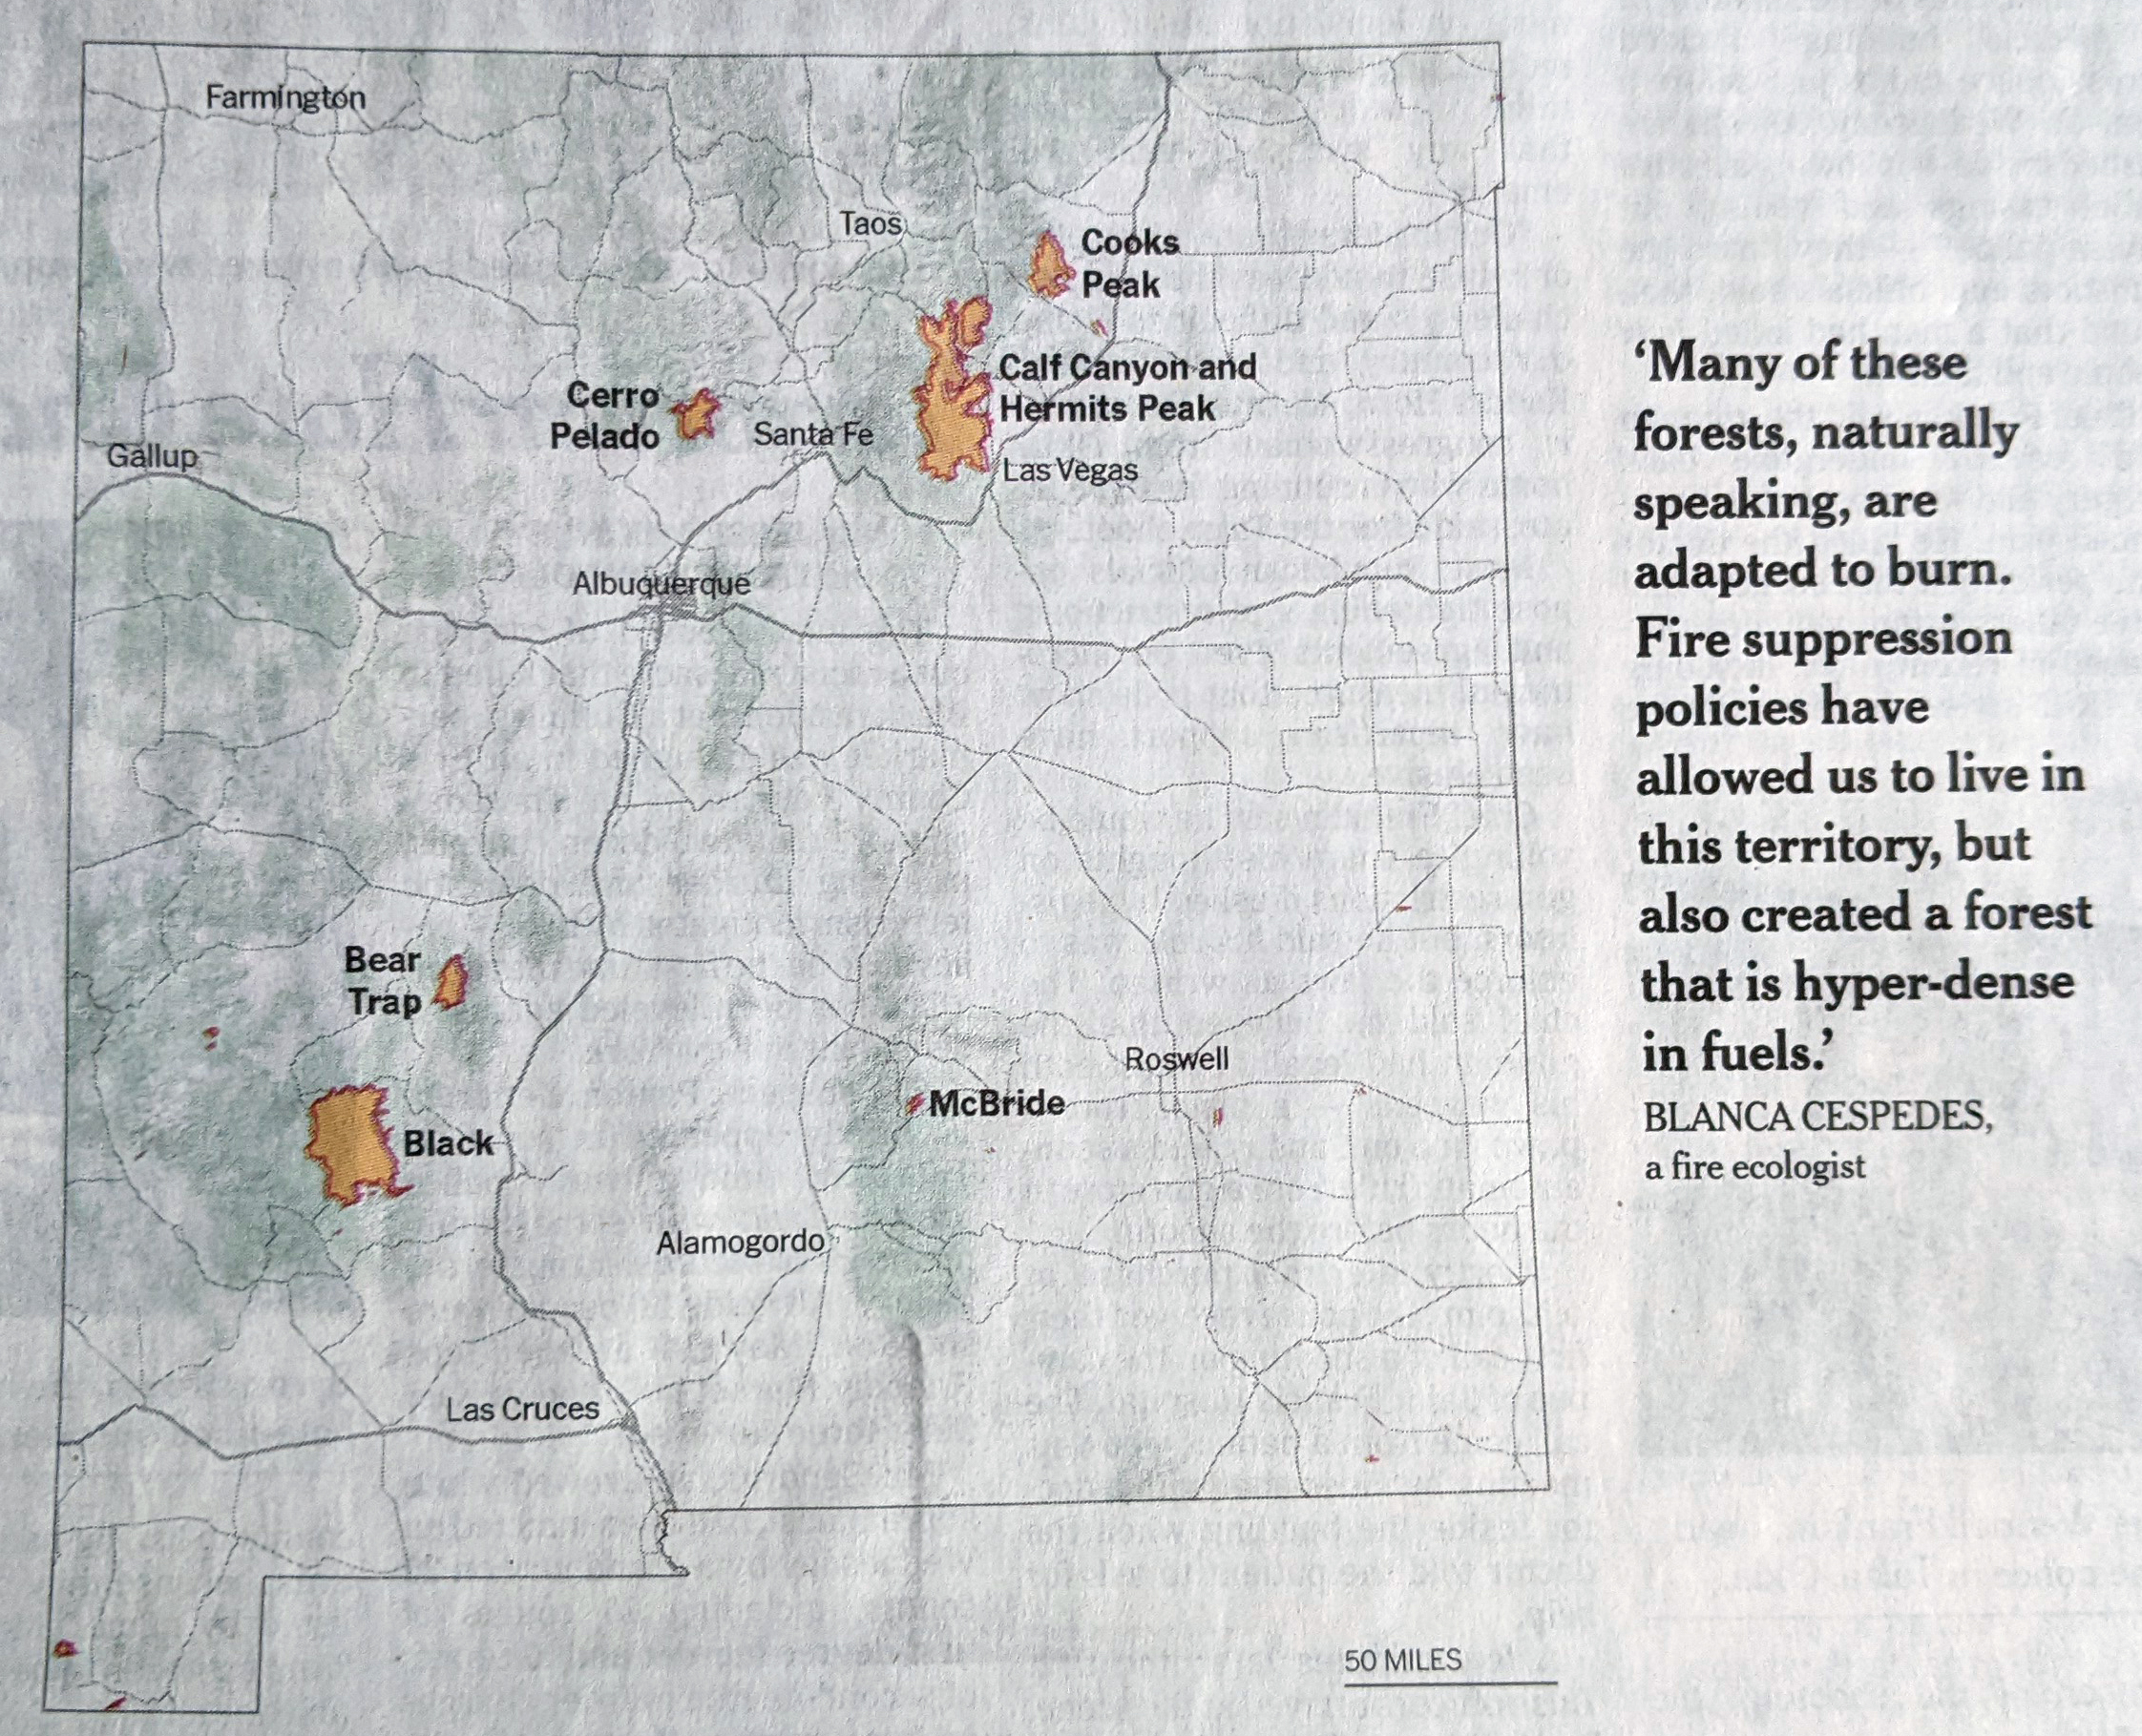
The other graphics are also maps like on the front page. The first was a locator map that pointed out where the fires in question occurred. Including one isn’t much of a surprise, but what this does really nicely is show the scale of these fires. They are not an insignificant amount of area in the state.
Pointing out where I really don’t want to be in New Mexico.

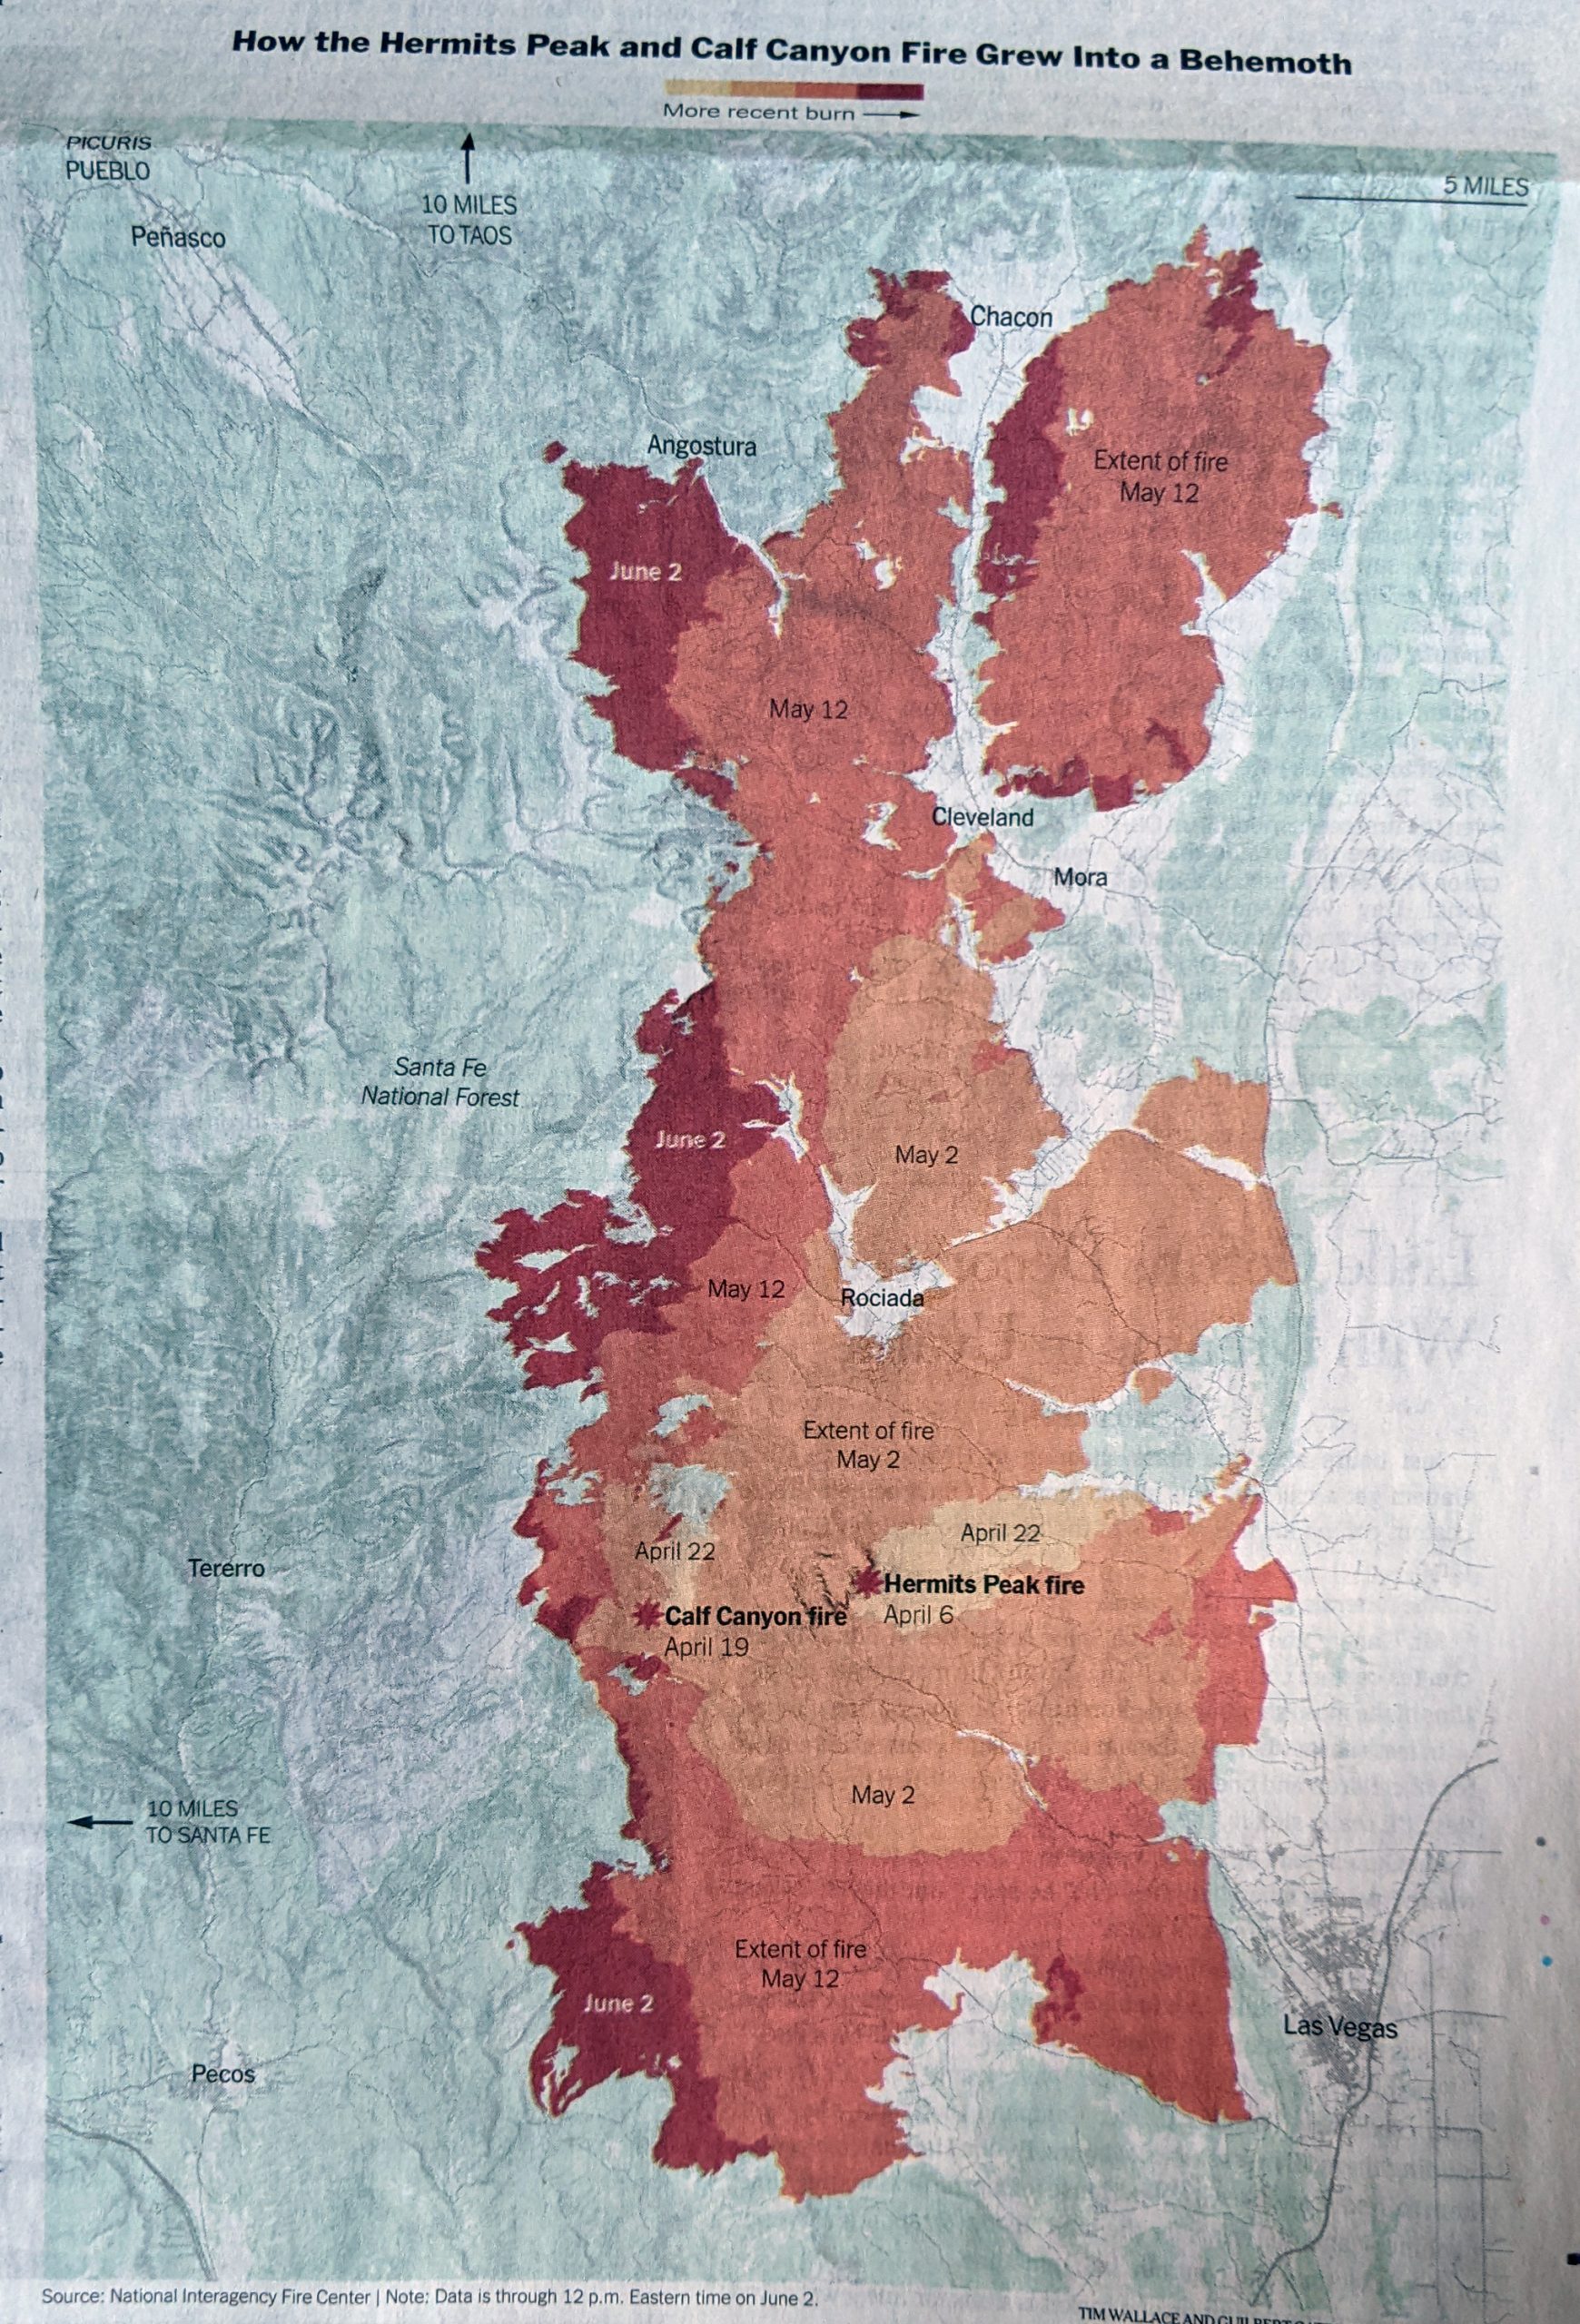
Finally we have the main graphic of the piece, which is a map of the spread of the Calf Canyon and Hermits Peak fire, which was two separate fires until they merged into one. The article does a good job explaining how part of the fire was actually intentionally set as part of a controlled burn. It just became a bit uncontrolled shortly thereafter.
Nope. Definitely not a place to be.

This reminded me of a piece I wrote about last autumn when the volcano erupted on La Palma. In that I looked at an article from the BBC covering the spread of the lava as it headed towards the coast. In that case darker colours indicated the earlier time periods. Here the Times reversed that and used the darker reds to indicate more recent fire activity.

Overall the article does a really nice job showing just what kind of problems New Mexico faces not just now from today’s environmental conditions, but also in the future from the effects of climate change.

Credit for the piece goes to Guilbert Gates, Nadja Popovich, and Tim Wallace.

I’ve Got the Seeing the Reds and Greens as One Blues

Today I want to highlight a print article from the New York Times I received about two weeks ago. It’s been sitting in a pile of print pieces I want to sit down, photograph, and then write up. But as we begin to return to normal, I need my second dining room chair back because at some point I’ll have guests over.

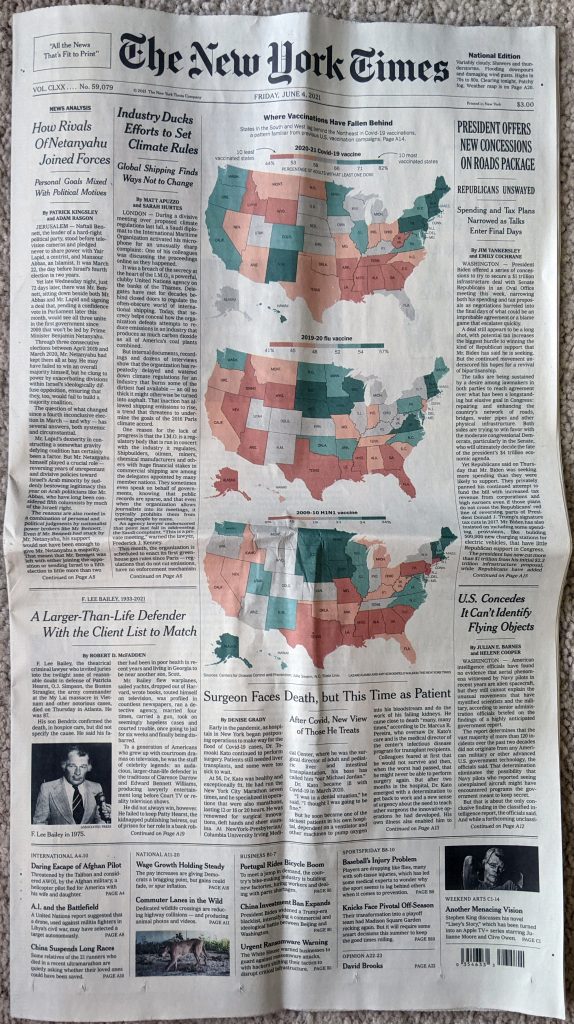
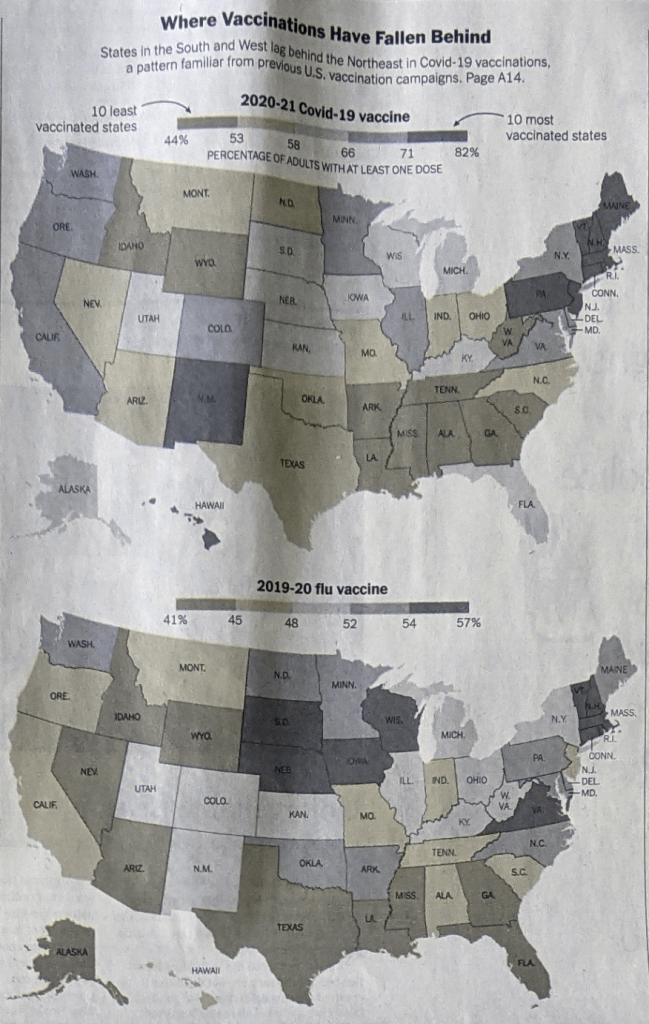
The article in question examined the rates of Covid-19 vaccination across the United States. And on the front page, above the fold no less, we can compare the vaccination rates for Covid-19 to those of the 2019–2020 flu and if you unfold it to its full-length glory we can add in the 2009–2010 H1N1 swine flu outbreak.

Front page graphics

First thing I want to address is the obvious. Look at those colours. Who loves a green-to-red scale on a choropleth? Not this guy. They are a pretty bad choice because of green-to-red colour blindness. (There’s two different types as well as other types of colour blindness, but I’m simplifying here.) But here’s what happen when I pull the photo into Photoshop and test for it. (This is a screenshot, because I’m not aware of a means of exporting a proof image.)

Reds and greens become yellows and greys.

You can still see the difference between the reds and greens. That’s good. And it’s because colour is complicated. In red-green colour blindness, the issue is sensitivity to picking up reds and greens. (Again, oversimplifying for the sake of a blog post.) Between those two colours in the spectrum we have yellow. To the other side of green we have blue.

So if a designer needs to use a red-green colour scheme—and any designer who has worked in data visualisation will have undoubtedly have had a client asking for the map/chart/whatever to be in red and green—there’s a trick to making it work.

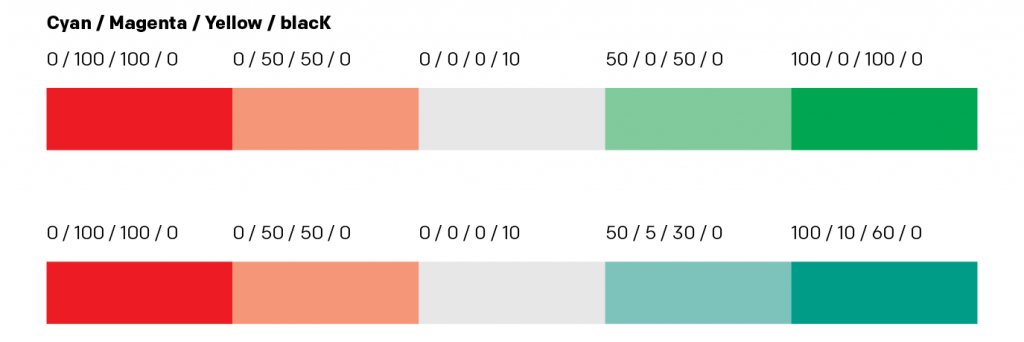
I don’t know if this is true, but growing up, I learned that green was the one colour the human eye evolved to distinguish the most. Now for a print piece like this, you are working in what we call CMYK space (cyan, magenta, yellow, and black). Red is a mixture of magenta and yellow. Green a mixture of cyan and yellow. If you remember your school days, it’s similar to—but not the same as—mixing your primary colours. So if you need to make red and green work, what can you do? First, you can subtract a bit of yellow from your green, because that exists between red and green. But then, and this is why CMYK is different from your primary school primary colours, we can adjust the amount of magenta. Magenta is not a “pure” red, instead it’s kind of purplish and that means has some blue in it. Adding a little bit of magenta, while it does add “red” into the green, it’s also adding more blue to the blue present in the cyan. Now you can spend quite a bit of time tweaking these colours, but very quickly I can get these two options.

Reds and greens.

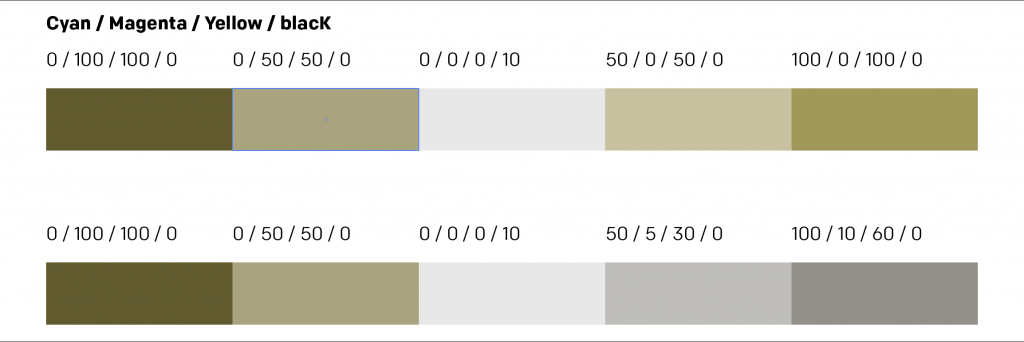
Great, you can still see them as both red and green. Your client is probably happy and probably accepts this greenish-blue as green, because we have that ability to distinguish so many types of green. But what about those with red-green colour blindness? Again, I can’t quite do a straight export, so the best is a screenshot, but we can compare those two options like so.

I can see the differences significantly more clearly here.

You can probably still tweak the green, but by going for that simple tweak, you can make the client happy—even though it’s still just better to avoid the red and green altogether—and still make the graphic work.

There’s a bit more to say about the rest of the article, which has some additional graphics inside. But that’ll have to wait for another day. As will clearing down the pile of print pieces to share, because that keeps on growing.

Credit for the piece goes to Lazaro Gamio and Amy Schoenfield Walker.

I’ve Got the Subtlest of Blues

As I prepared to reconnect and rejoin the world, I spent most of the weekend prior to full vaccination cleaning and clearing out my flat of things from the past 14 months. One thing I meant to do more with was printed pieces I saw in the New York Times. Interesting pages, front pages in particular, have been piling up and before recycling them all, I took some photos of the backlog. I’ll try to publish more of them in the coming weeks and months.

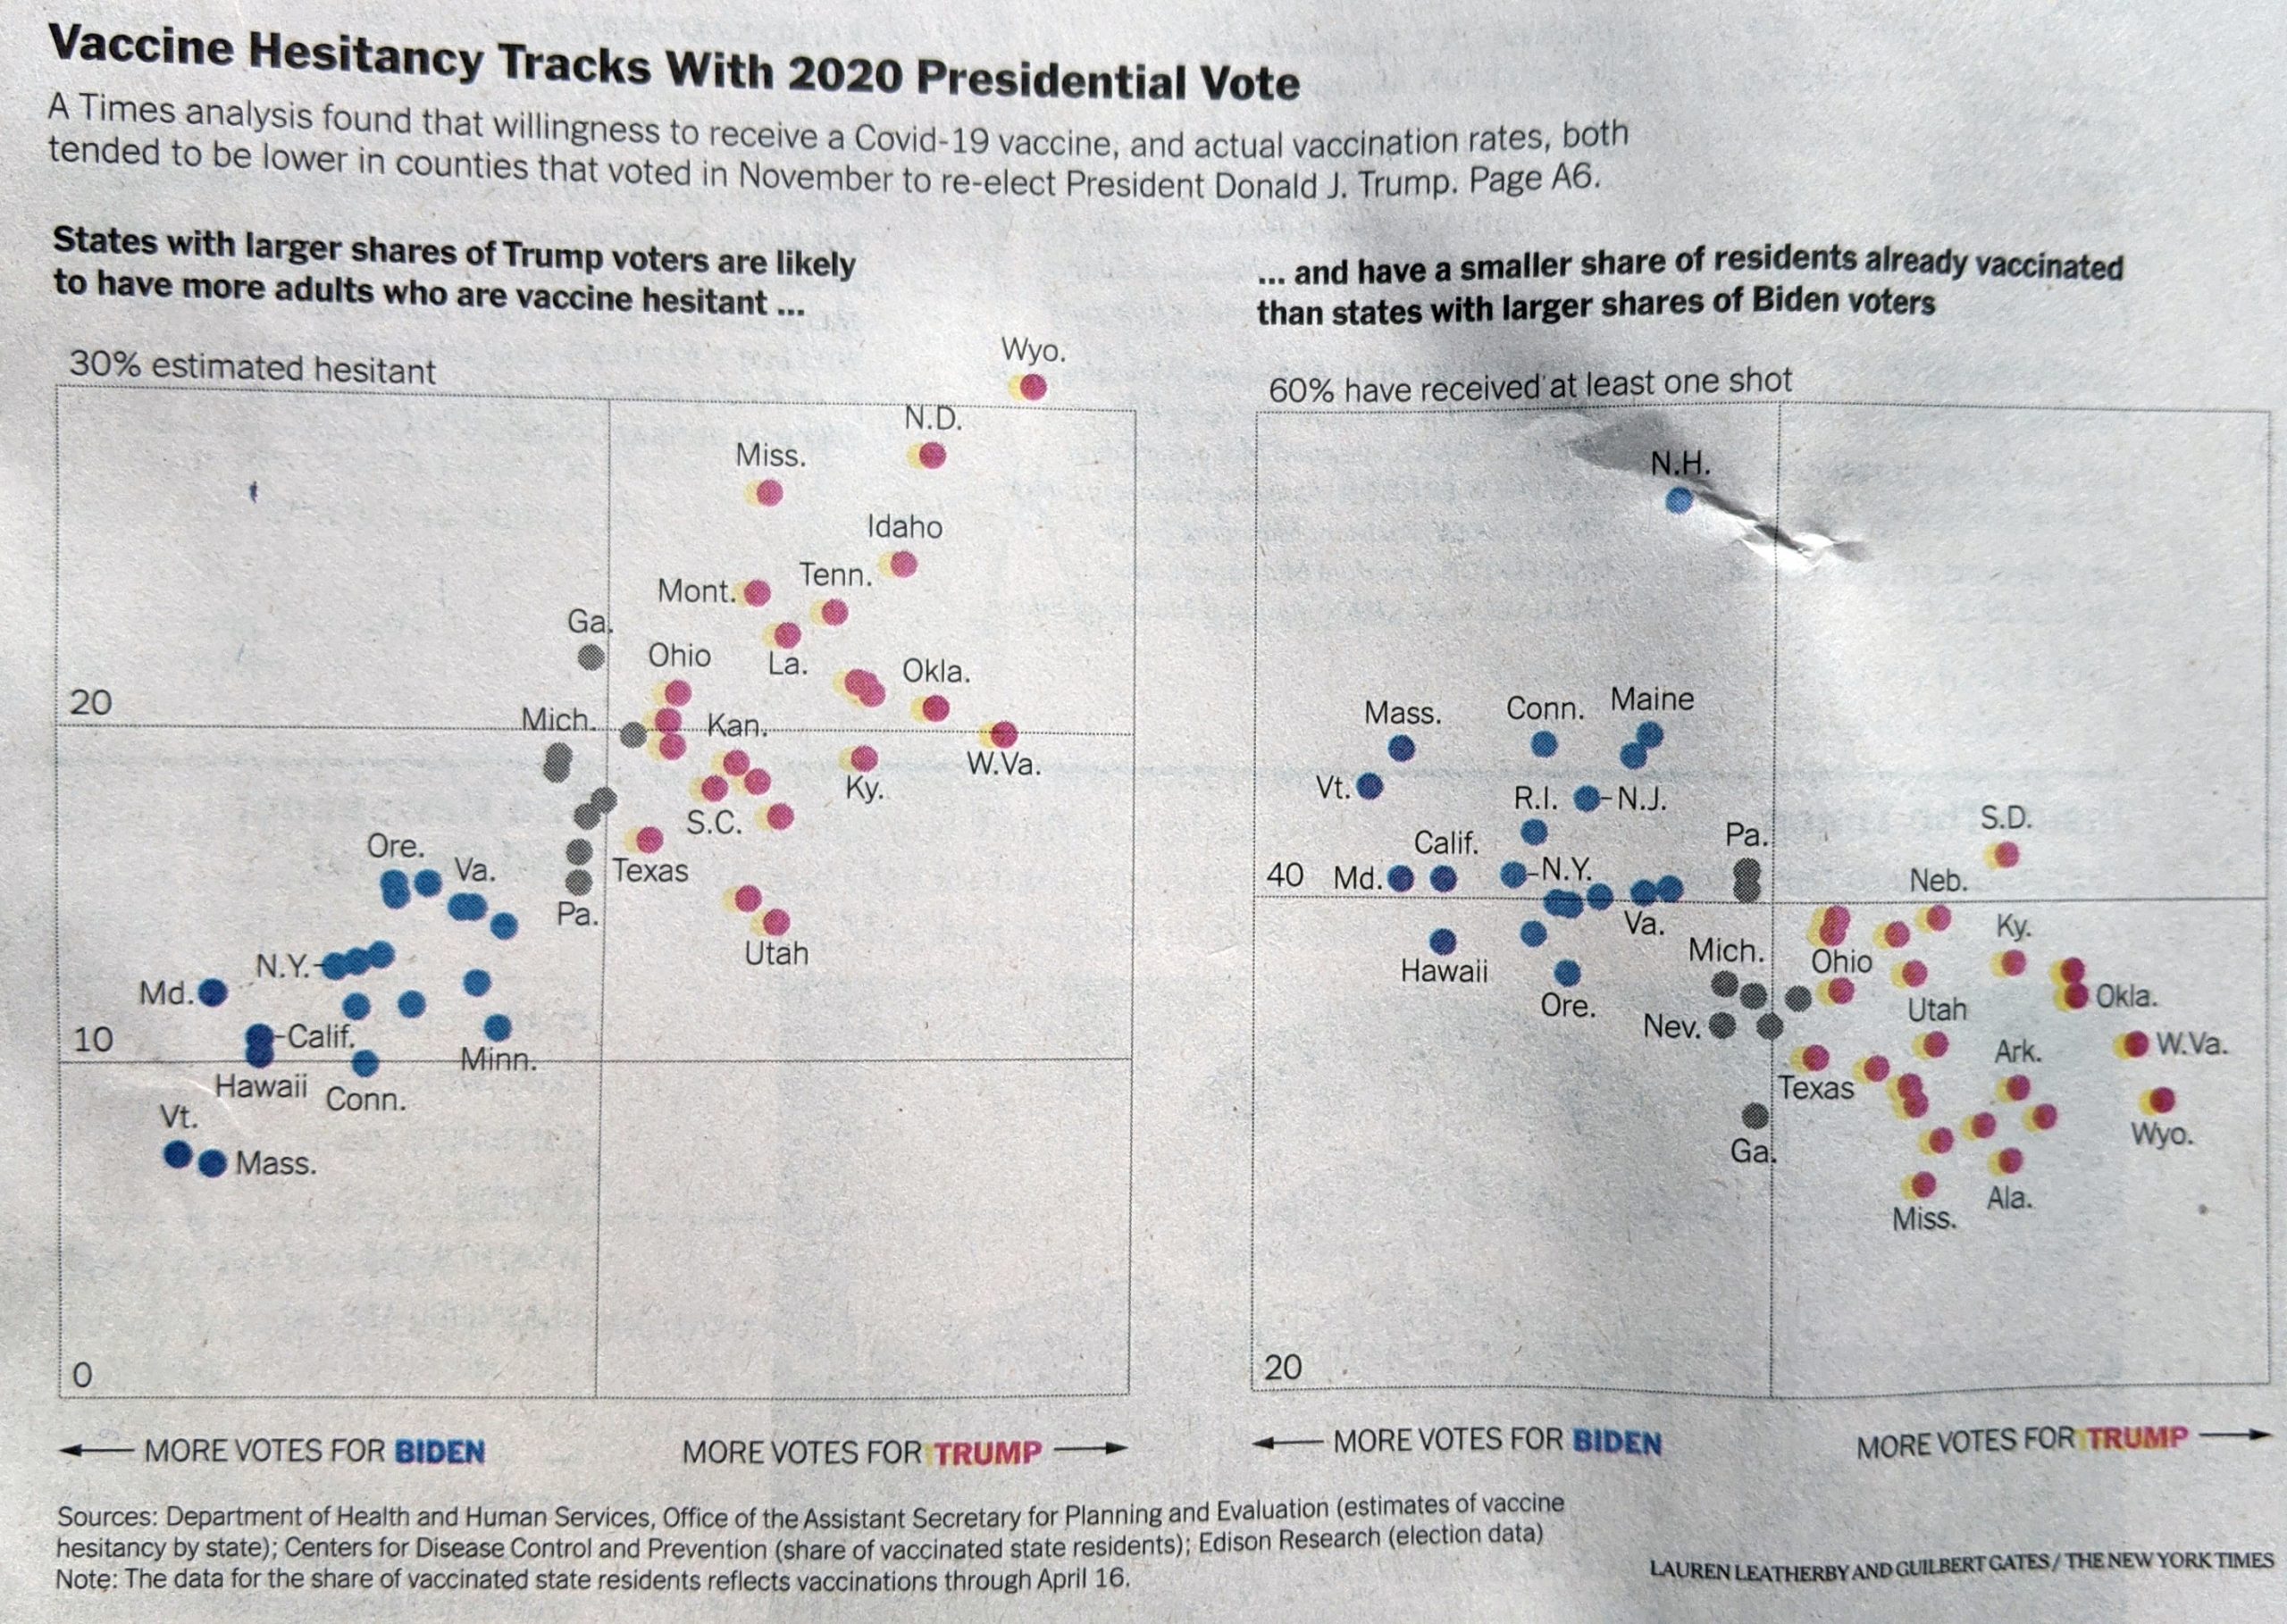
You may recall this time last month I wrote about a piece from the New York Times that examined the politicisation of vaccinations. I meant to get around to the print version, but didn’t, so let’s do it now.

Now in print…

I noted last time the use of ellipses for the title and the lack of value scales on the x-axis. Those did not change from the online version. But look at the y-axis.

For the print piece I noted how the labels were placed inside the chart. I wondered at the time—but didn’t write about—how perhaps that could have been a technical limitation for the web. But here we can see the labels still inside. It was a deliberate design decision.

Keeping with the labelling, I also pointed out Wyoming being outside the plot and it is here too, but I finally noted the lack of a label for zero on the first chart. Here the zero does appear, as I would have placed it. That does make me wonder if the lack of zero online was a technical/development issue.

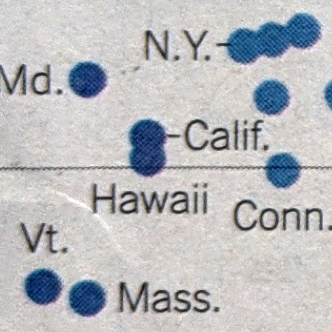
Finally, something very subtle. At first, I didn’t catch this and it wasn’t until I opened the image above in Photoshop. The web version I noted the use of tints, or lighter shades, for two different blues and two different reds. When I looked at the print, I saw only one red and one blue. But they were in fact different, and it wasn’t until I had zoomed in on the photo I took when I could see the difference.

I’ve got the blues…

The dots do have two different blues. But it’s very subtle. Same with the red.

So all in all the piece is very similar to what we looked at last month, but there were a few interesting differences. I wonder if the designers had an opportunity to test the blues/reds prior to printing. And I wonder if the zero label was an issue for developers.

Credit for the piece goes to Lauren Leatherby and Guilbert Gates.

2020 Census Apportionment

Every ten years the United States conducts a census of the entire population living within the United States. My genealogy self uses the federal census as the backbone of my research. But that’s not what it’s really there for. No, it exists to count the people to apportion representation at the federal level (among other reasons).

The founding fathers did not intend for the United States to be a true democracy. They feared the tyranny of mob rule as majority populations are capable of doing and so each level of the government served as a check on the other. The census-counted people elected their representatives for the House, but their senators were chosen by their respective state legislatures. But I digress, because this post is about a piece in the New York Times examining the new census apportionment results.

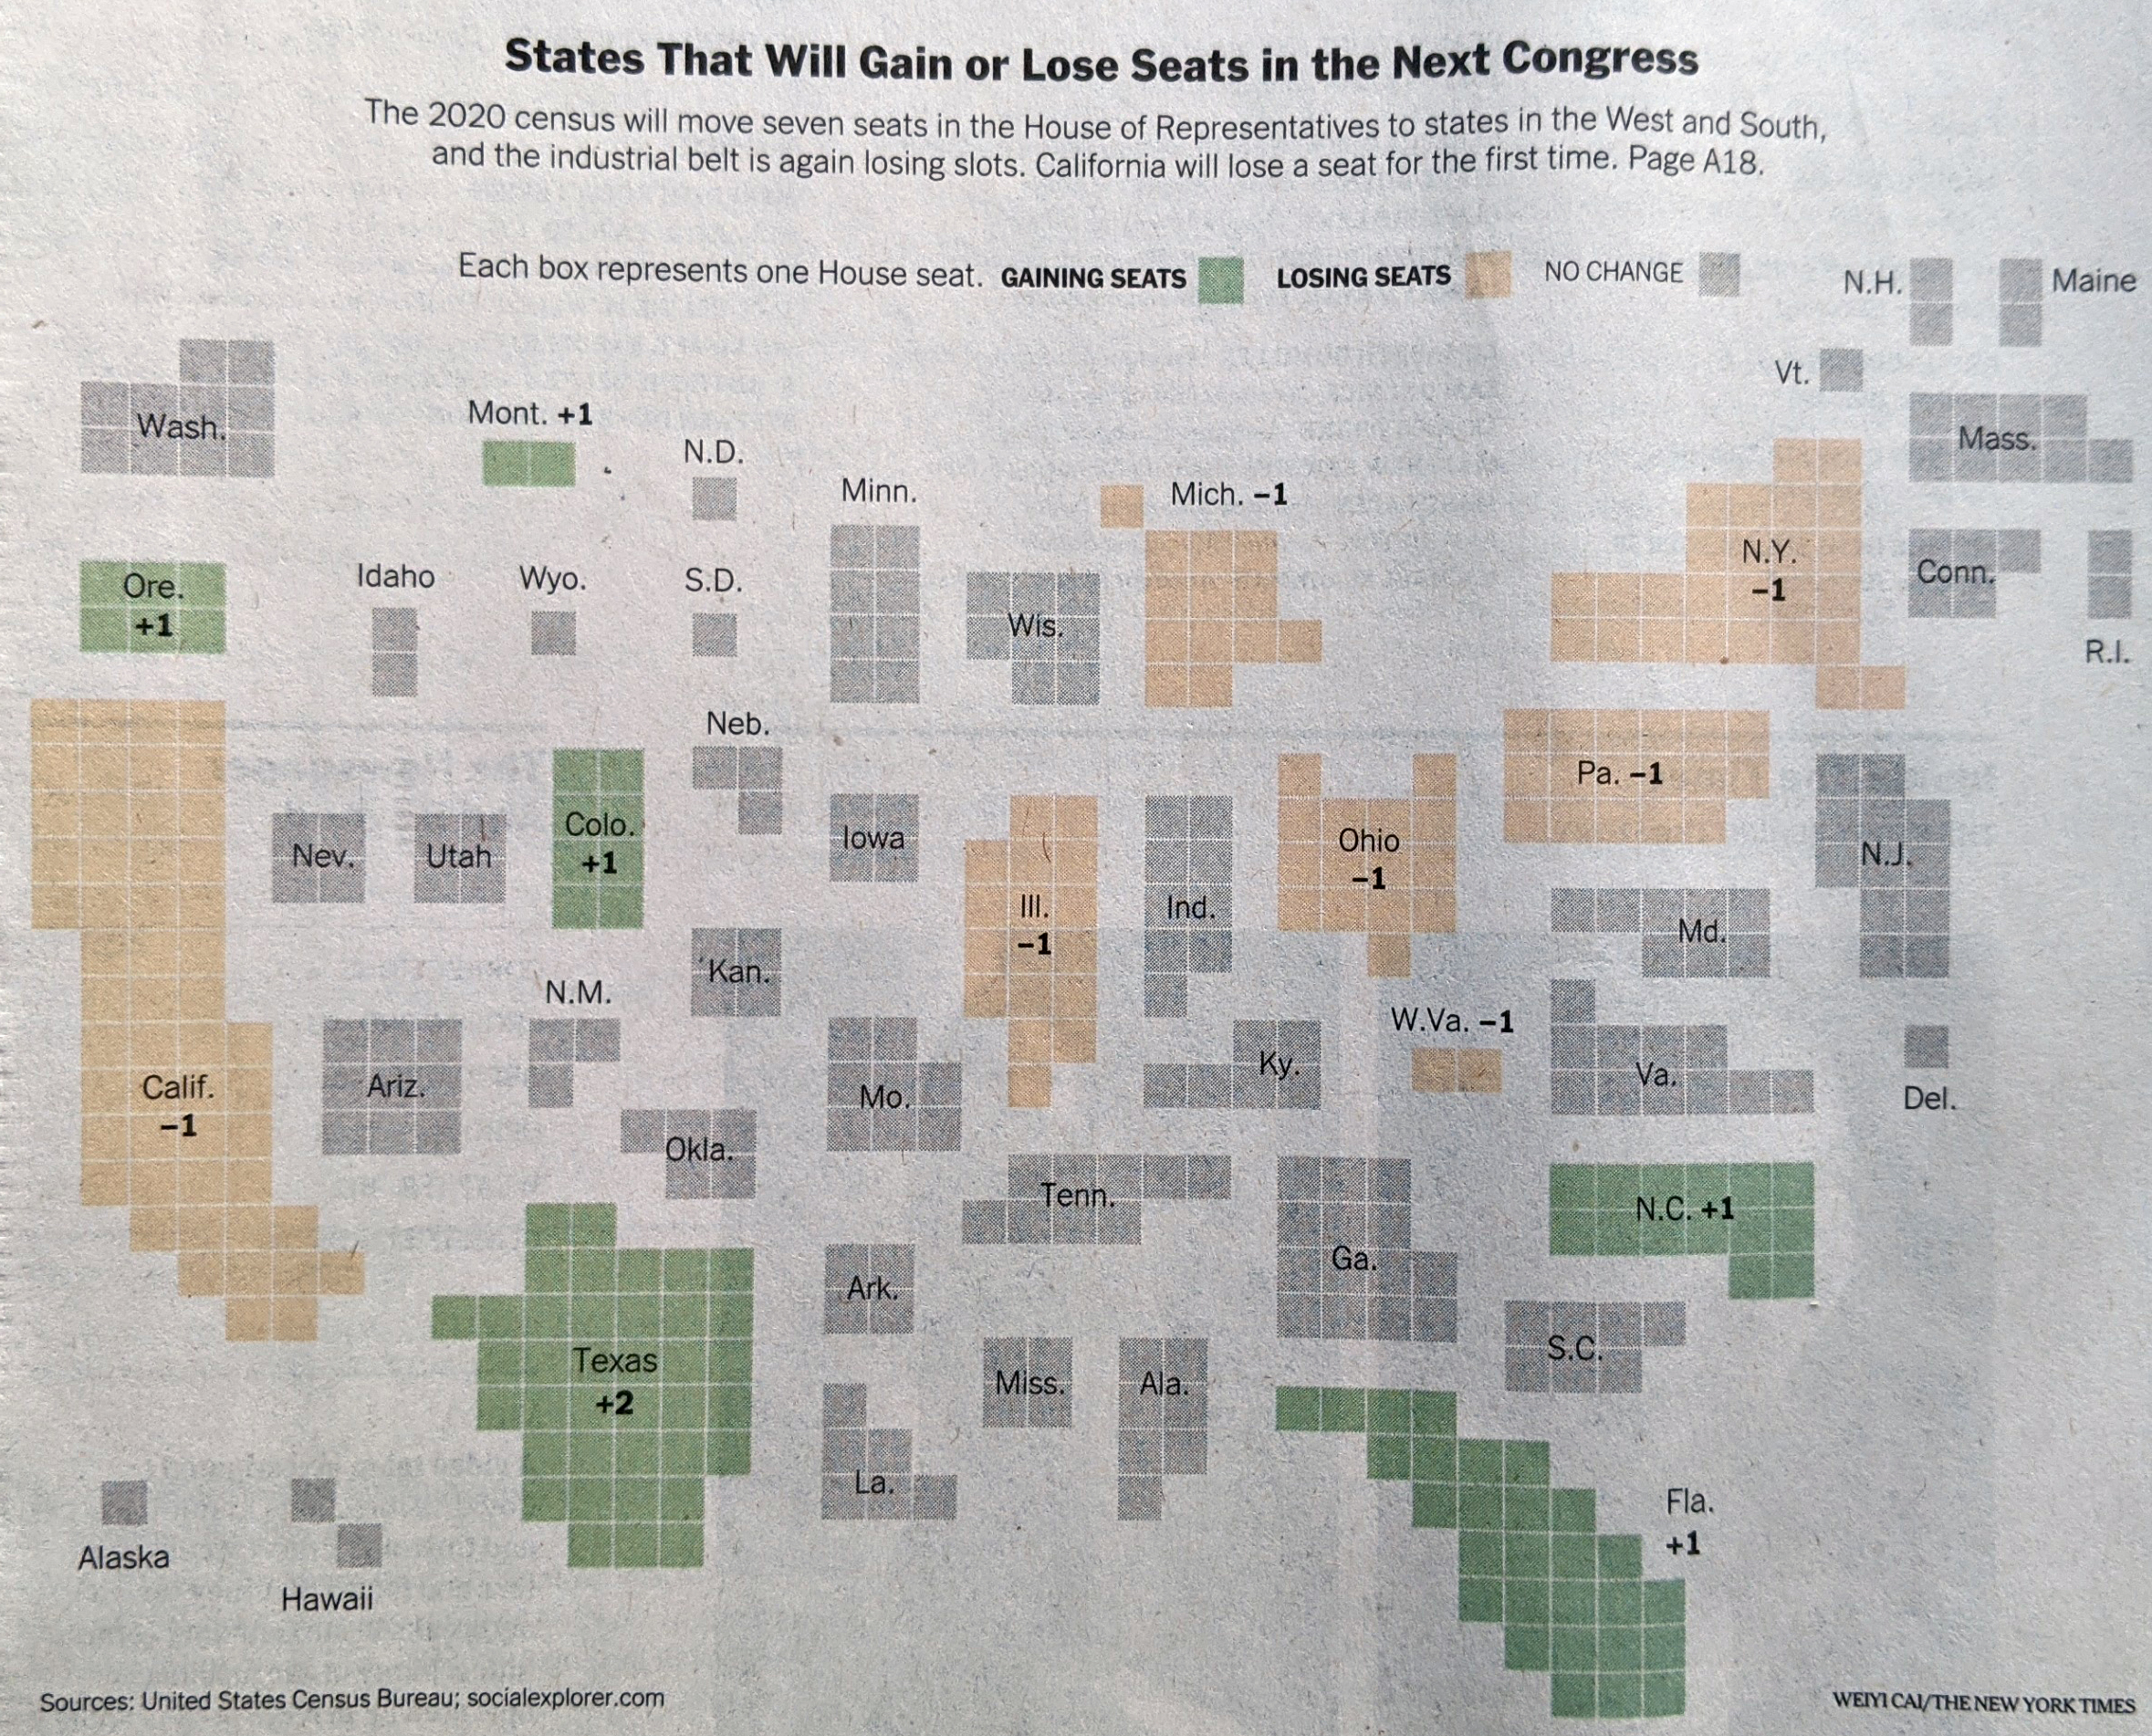
I received my copy of the Times two Tuesdays ago, so these are photos of the print piece instead of the digital, online editions. The paper landed at my front door with a nice cartogram above the fold.

A cartogram exploded.

Each state consists of squares, each representing one congressional district. This is the first place where I have an issue with the graphic, admittedly a minor one. First we need to look at the graphic’s header, “States That Will Gain or Los Seats in the Next Congress” and then look at the graphic. It’s unclear to me if the squares therefore represent the states today with their numbers of districts, or if we are looking at a reapportioned map. Up in Montana, I know that we are moving from one at-large seat to two seat, and so I can resolve that this is the new apportionment. But I am left wondering if a quick phrase or sentence that declares these represent the 2022 election apportionment and not those of this past decade would be clearer?

Or if you want a graphic treatment, you could have kept all the states grey, but used an unfilled square in those states, like Pennsylvania and Illinois, losing seats, and then a filled square in the states adding seats.

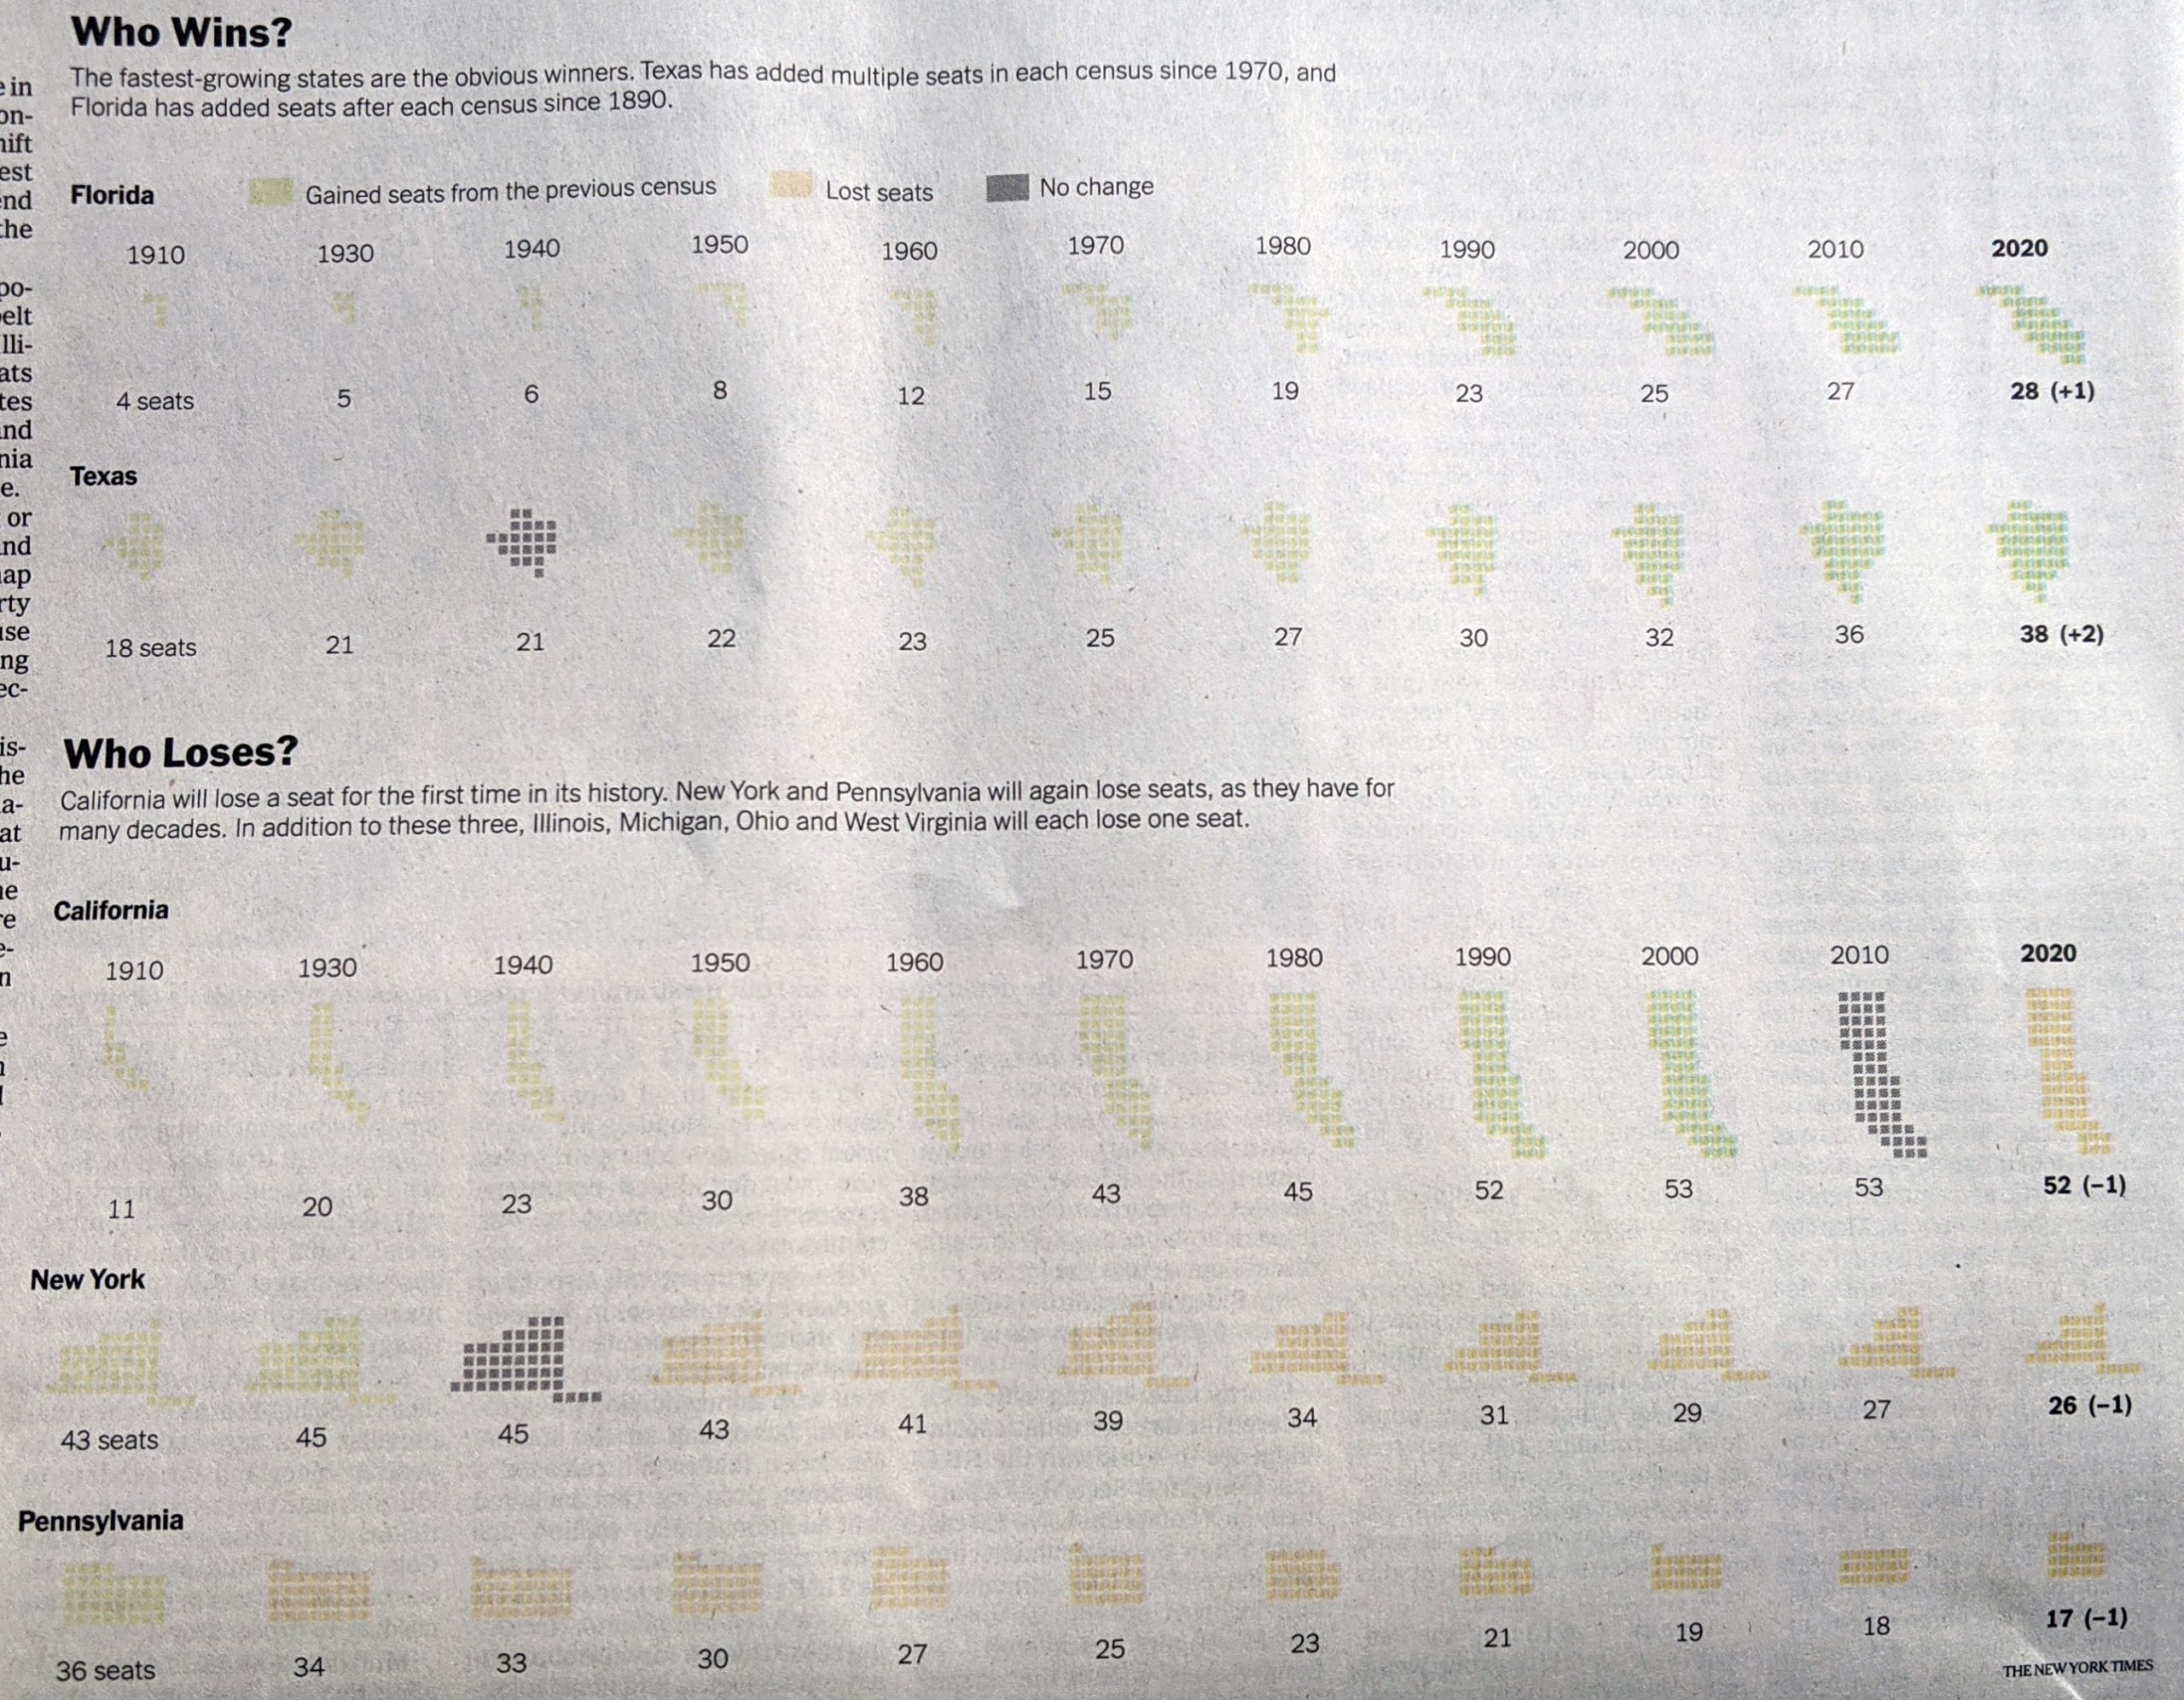
Inside the paper, the article continued and we had a few more graphics. The above graphic served as the foundation for a second graphic that charted the changing number of seats since 1910, when the number of seats was fixed.

Timeline of gains and losses

I really like this graphic. My issue here is more with my mobile that took the picture. Some of these states appear quite light, and they are on the printed page. However, they are not quite as light as these photos make them out to be. That said, could they be darker? Probably. Even in print, the dark grey “no change” instances jump out instead of perhaps falling to the background.

The remaining few graphics are far more straightforward, one isn’t even a graphic technically.

First we have two maps.

Good old primary colours.

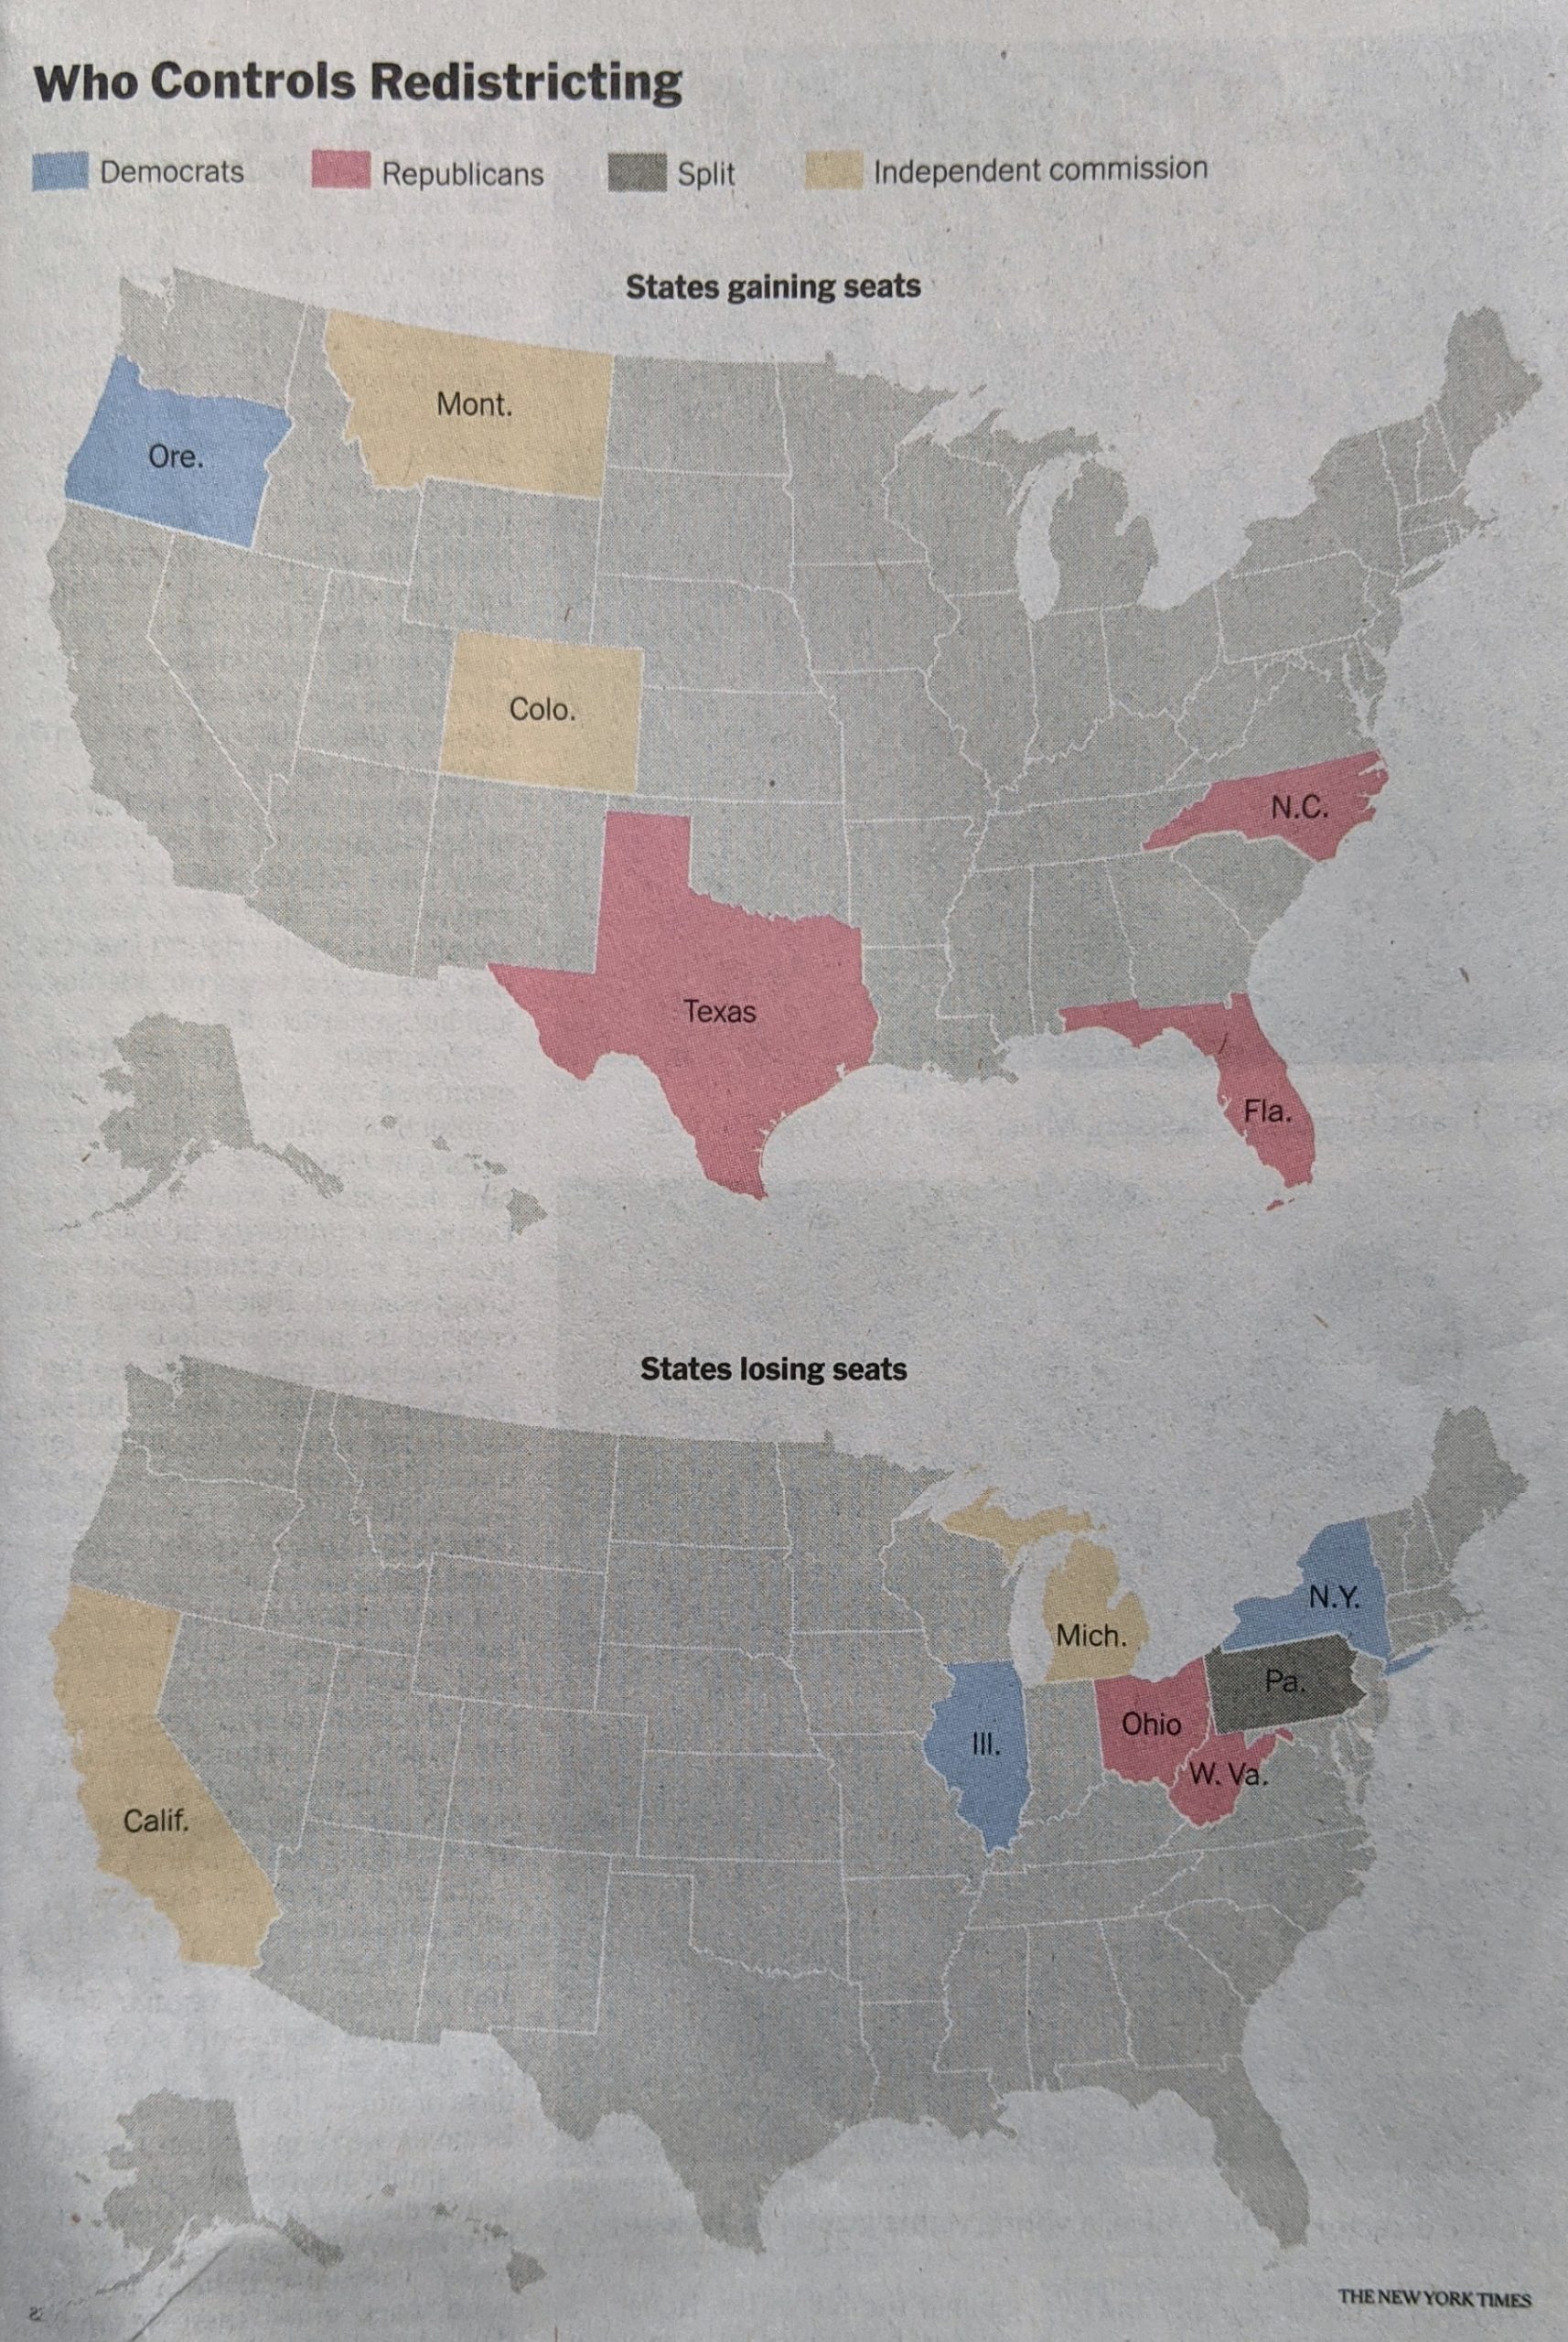
Nothing particularly remarkable here. The colours make a lot of sense, with red representing Republicans and blue Democrats. Yellow represents independent commissions and grey is only one state, Pennsylvania, where the legislature is controlled by Republicans and the governorship by Democrats.

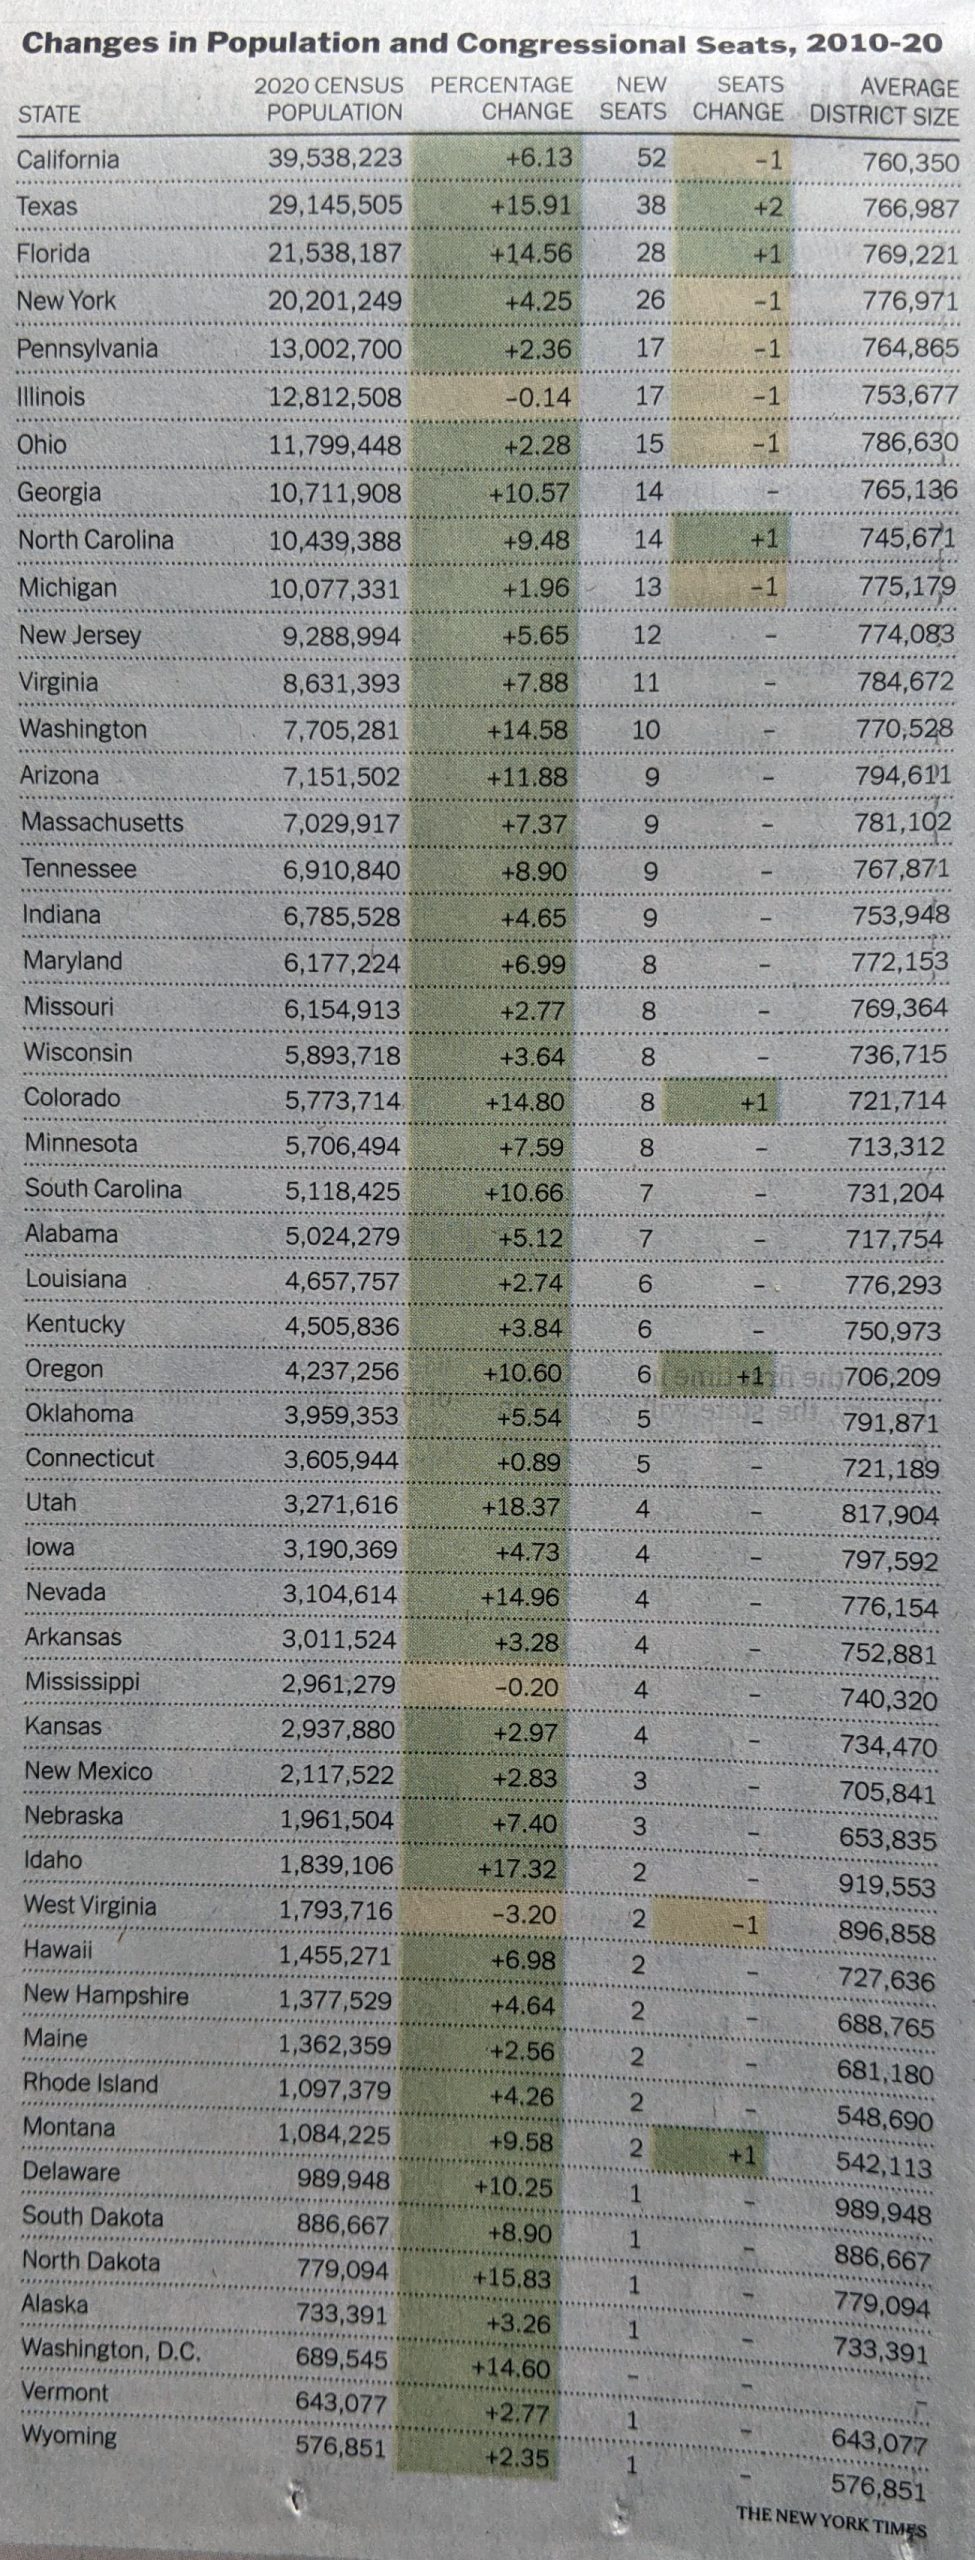
Finally we have a table with the raw numbers.

Tables are great for organising information. Do you have a state you’re most curious about, Illinois for example? If so, you can quickly scan down the state column to find the row and then over to the column of interest. What tables don’t allow you to do is quickly identify any visual patterns. Here the designers chose to shade the cells based on positive/negative changes, but that’s not highlighting a pattern.

Overall, this was a really strong piece from the Times. With just a few language tweaks on the front page, this would be superb.

Credit for the piece goes to Weyi Cai and the New York Times graphics department.

The May Jobs Report

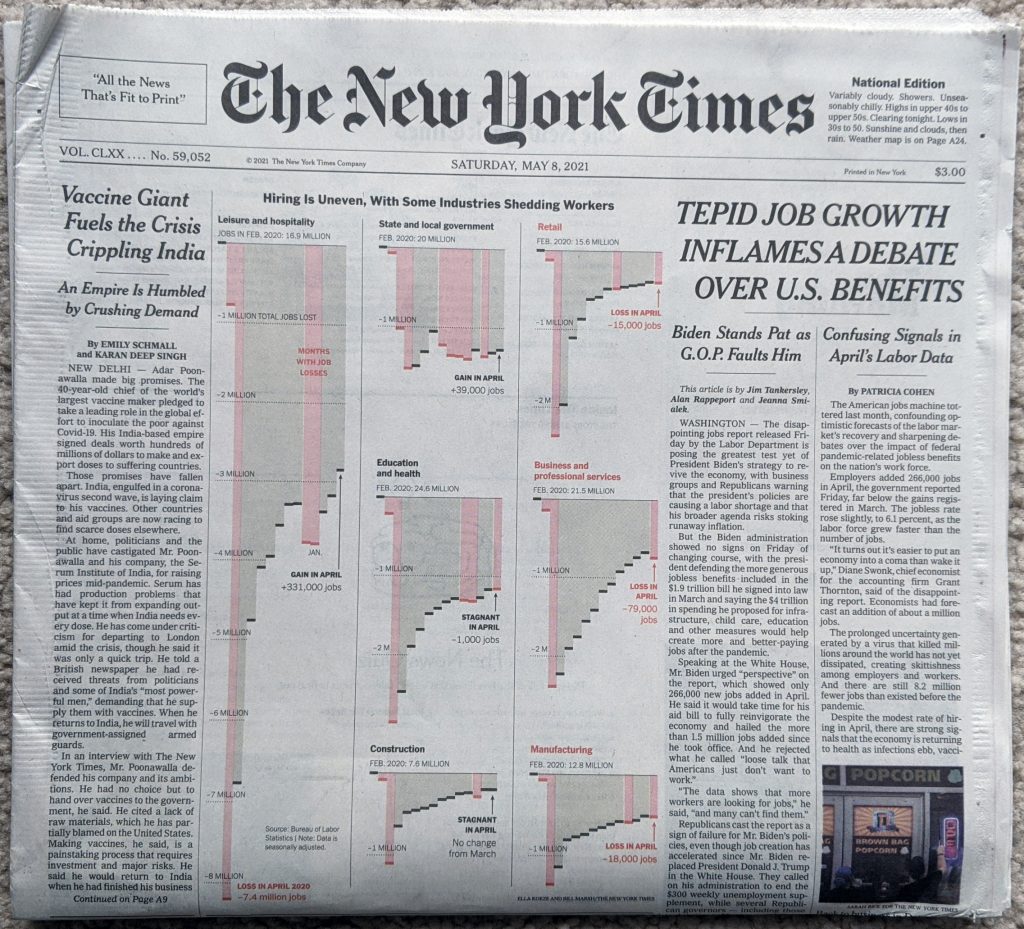
Last Friday, the government released the labour statistics from April and they showed a weaker rebound in employment than many had forecasted. When I opened the door Saturday morning, I got to see the numbers above the fold on the front page of the New York Times.

Welcome to the weekend

What I enjoyed about this layout, was that the graphic occupied half the above the fold space. But, because the designers laid the page out using a six-column grid, we can see just how they did it. Because this graphic is itself laid out in the column widths of the page itself. That allows the leftmost column of the page to run an unrelated story whilst the jobs numbers occupy 5/6 of the page’s columns.

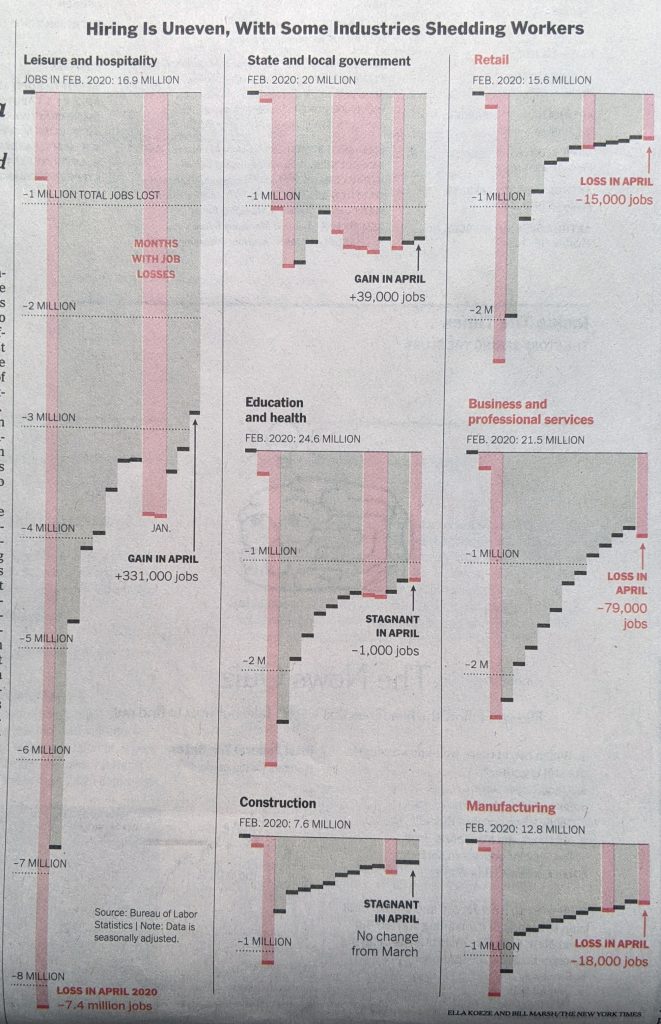
If we look at the graphic in more detail, the designers made a few interesting decisions here.

Jobs in detail

First, last week I discussed a piece from the Times wherein they did not use axis labels to ground the dataset for the reader. Here we have axis labels back, and the reader can judge where intervening data points fall between the two. For attention to detail, note that under Retail, Education and health, and Business and professional services, the “illion” in -2 Million was removed so as not to interfere with legibility of the graphic, because of bars being otherwise in the way.

My issue with the axis labels? I have mentioned in the past that I don’t think a designer always needs to put the maximum axis line in place, especially when the data point darts just above or below the line. We see this often here, for example Construction and Manufacturing both handle it this way for their minimums. This works for me.

But for the column above Construction, i.e. State and local government and Education and health, we enter the space where I think the graphic needs those axis lines. For Education and health, it’s pretty simple, the red losses column looks much closer to a -3 million value than a -2 million value. But how close? We cannot tell with an axis line.

And then under State and local government we have the trickier issue. But I think that’s also precisely why this could use some axis lines. First, almost all the columns fall below the -1 million line. This isn’t the case of just one or two columns, it’s all but two of them. Second, these columns are all fairly well down below the -1 million axis line. These aren’t just a bit over, most are somewhere between half to two-thirds beyond. But they are also not quite nearly as far to -2 million as the ones we had in the Education and health growth were near to -3 million.

So why would I opt to have an axis line for State and local governments? The designers chose this group to add the legend “Gain in April”. That could neatly tuck into the space between the columns and the axis line.

Overall it’s a solid piece, but it needs a few tweaks to improve its legibility and take it over the line.

Credit for the piece goes to Ella Koeze and Bill Marsh.

500,000 Deaths

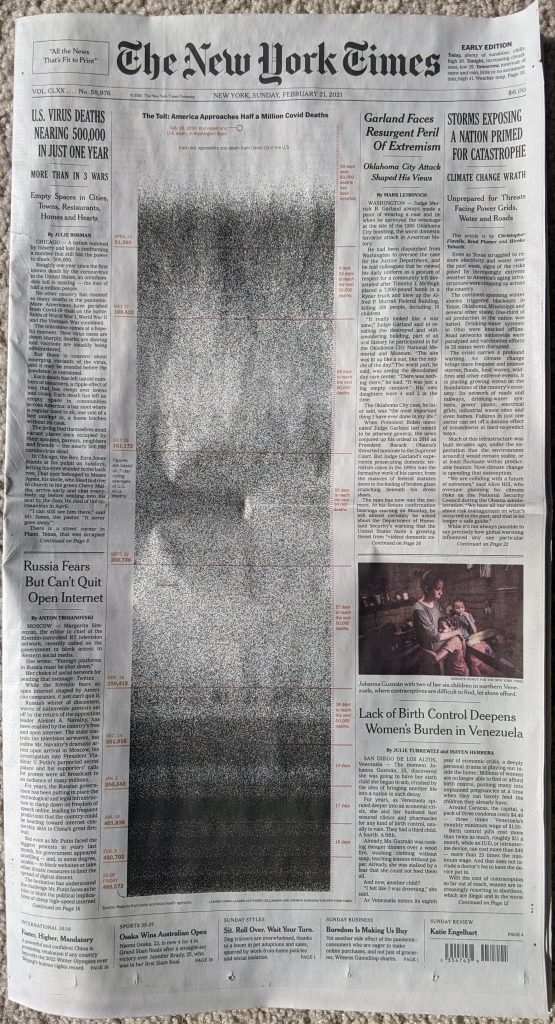
The United States surpassed 500,000 deaths from Covid-19. On Sunday, in advance of that sobering statistic, the New York Times published a front-page graphic that dominated the layout.

Sunday front page for the New York Times

Usually a front-page graphic will make use of the four-colour process and present richly coloured graphics. This, however, starkly lays out the timeline of deaths in the United States in black and white.

Meaningful graphics do not need to reinvent the wheel. This takes each life lost as a black dot and then, starting at the top in February, plots each day.

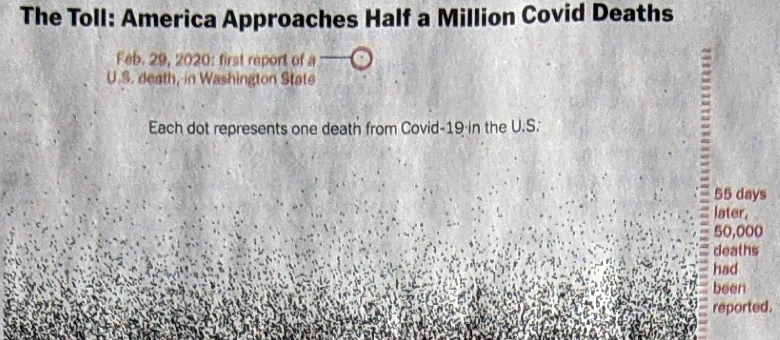
Detail of the graphic

The colour here serves as the annotation. The red circle drawing attention to the first reported death. And down the side the tick marks for days. Red lines indicate 50,000 death increments. The labels tell the story, we’ve needed fewer and fewer days to reach each subsequent 50,000 milestone.

As the first wave intensifies in March and April, the space fills with black dots. But as we enter summer and deaths fell, the space lightens. Late autumn and winter bring more death and you can see clearly towards the bottom of the chart, as we approach today, the graphic is nearly solid black.

If we want to look towards a hopeful point in the content, we can see first that it took 17 days then 15 to reach 400,00 deaths and 450,000 deaths, respectively. But it took 19 days to reach 500,000. As a nation we appear to finally be on the downward slope of this wave.

Returning to the piece, it’s a gut punch of simplicity in design.

Credit for the piece goes to Lazaro Gambio, Lauren Leatherby, Bill Marsh, and Andrew Sondern.

Tornado Alley Spread East

Last week the Philadelphia area experienced a mini tornado outbreak with three straight days of watches and warnings. Of course further west in the traditional Tornado Alley, far more storms of far greater intensity were wreaking havoc. But with tornado warnings going off every few minutes just outside the city of Philadelphia, it was hard to concentrate on storms in, say, Oklahoma.

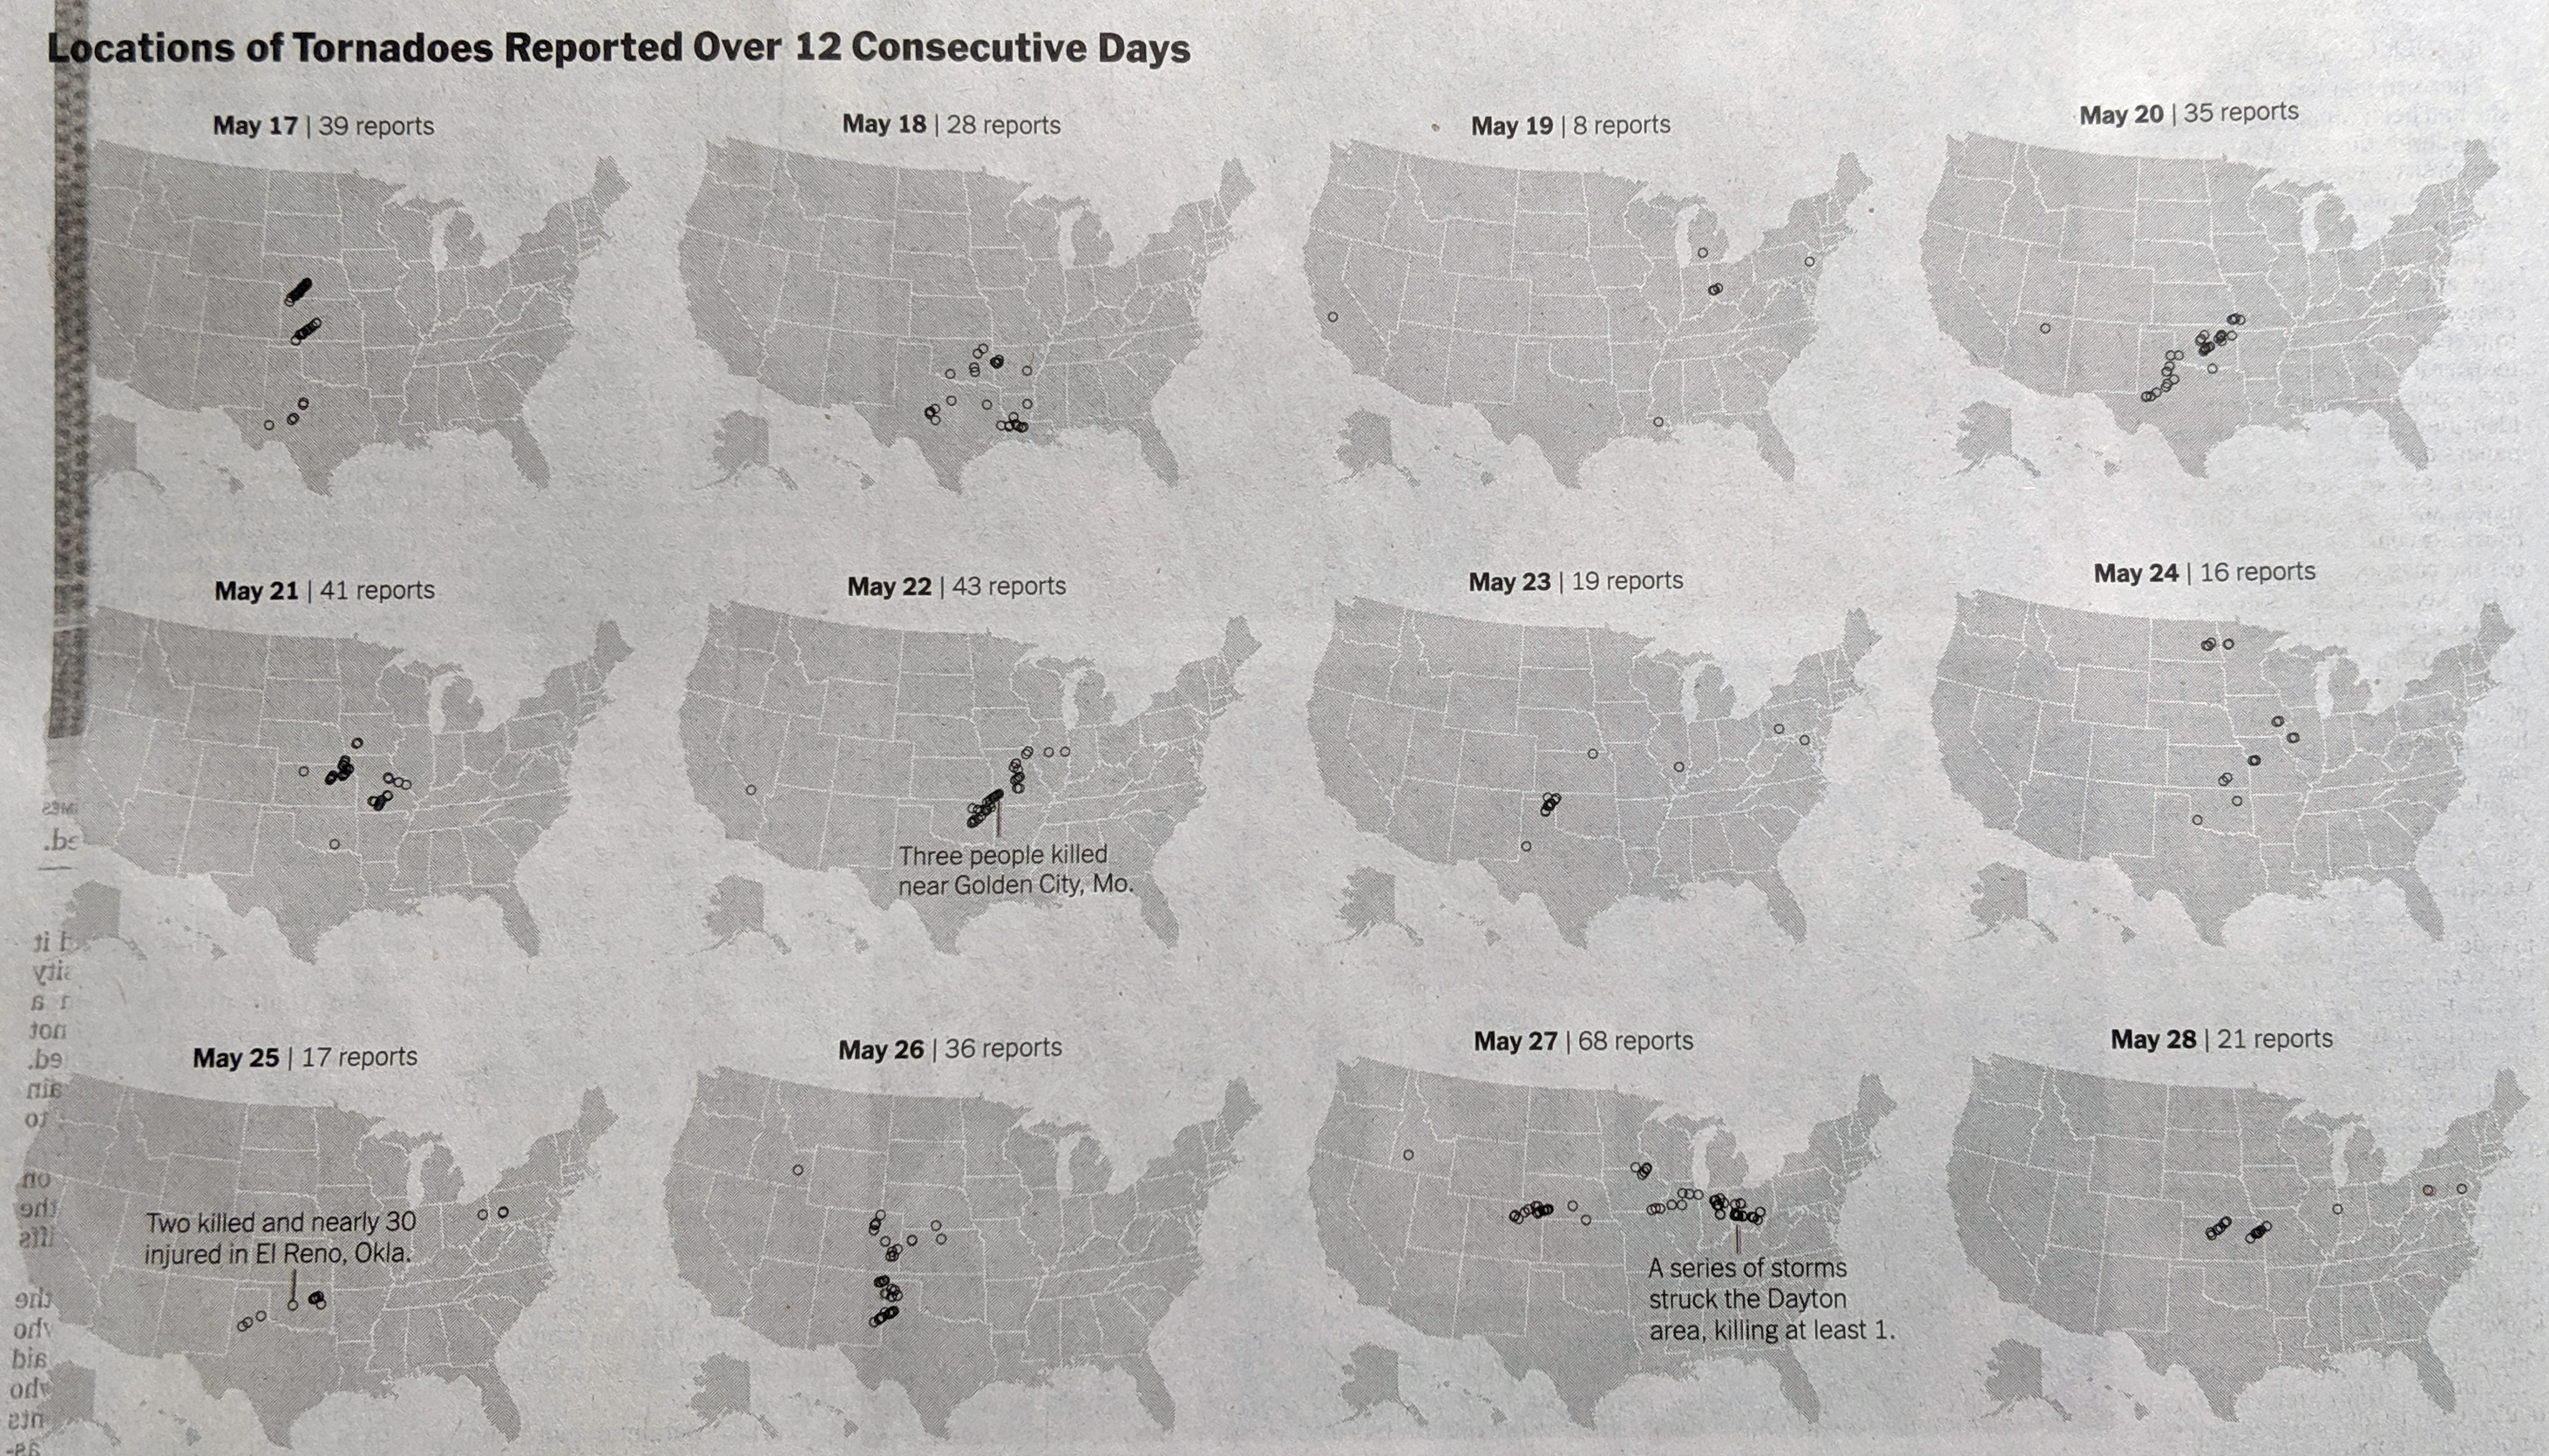
But the New York Times did. And they put together a nice graphic showing the timeline of the outbreak using small multiples to show where the tornado reports were located on 12 consecutive days.

Who remembers the film Twister?

Of course the day of that publication, 29 May, would see another few dozen, even in and around Philadelphia. Consequently, the graphic could have been extended to a day 13. But that would have been rather unlucky.

From a design standpoint, the really nice element of this graphic is that it works so well in black and white. The graphic serves as a reminder that good graphics need not be super colourful and flashy to have impact.

Credit for the piece goes to Weiyi Cai and Jason Kao.

The Summary of the Mueller Report

When Robert Mueller submitted his report a few weeks ago, some interested parties declared it a witch hunt that had wasted time and money. Except, it had done the opposite of that. It had laid bare Russia’s interference in our elections and the contacts between Russian government and quasi-government officials and Trump campaign officials. Said officials then lied about their contacts and, along with other crimes discovered during the course of the investigation, either pleaded guilty or were convicted. And while a few trials are still underway, we also now know 12 other cases have been referred to prosecutors but they remain under wraps.

At the time of submission, the New York Times was able to create this front page graphic.

There's some shady shit going on here.
There’s some shady shit going on here.

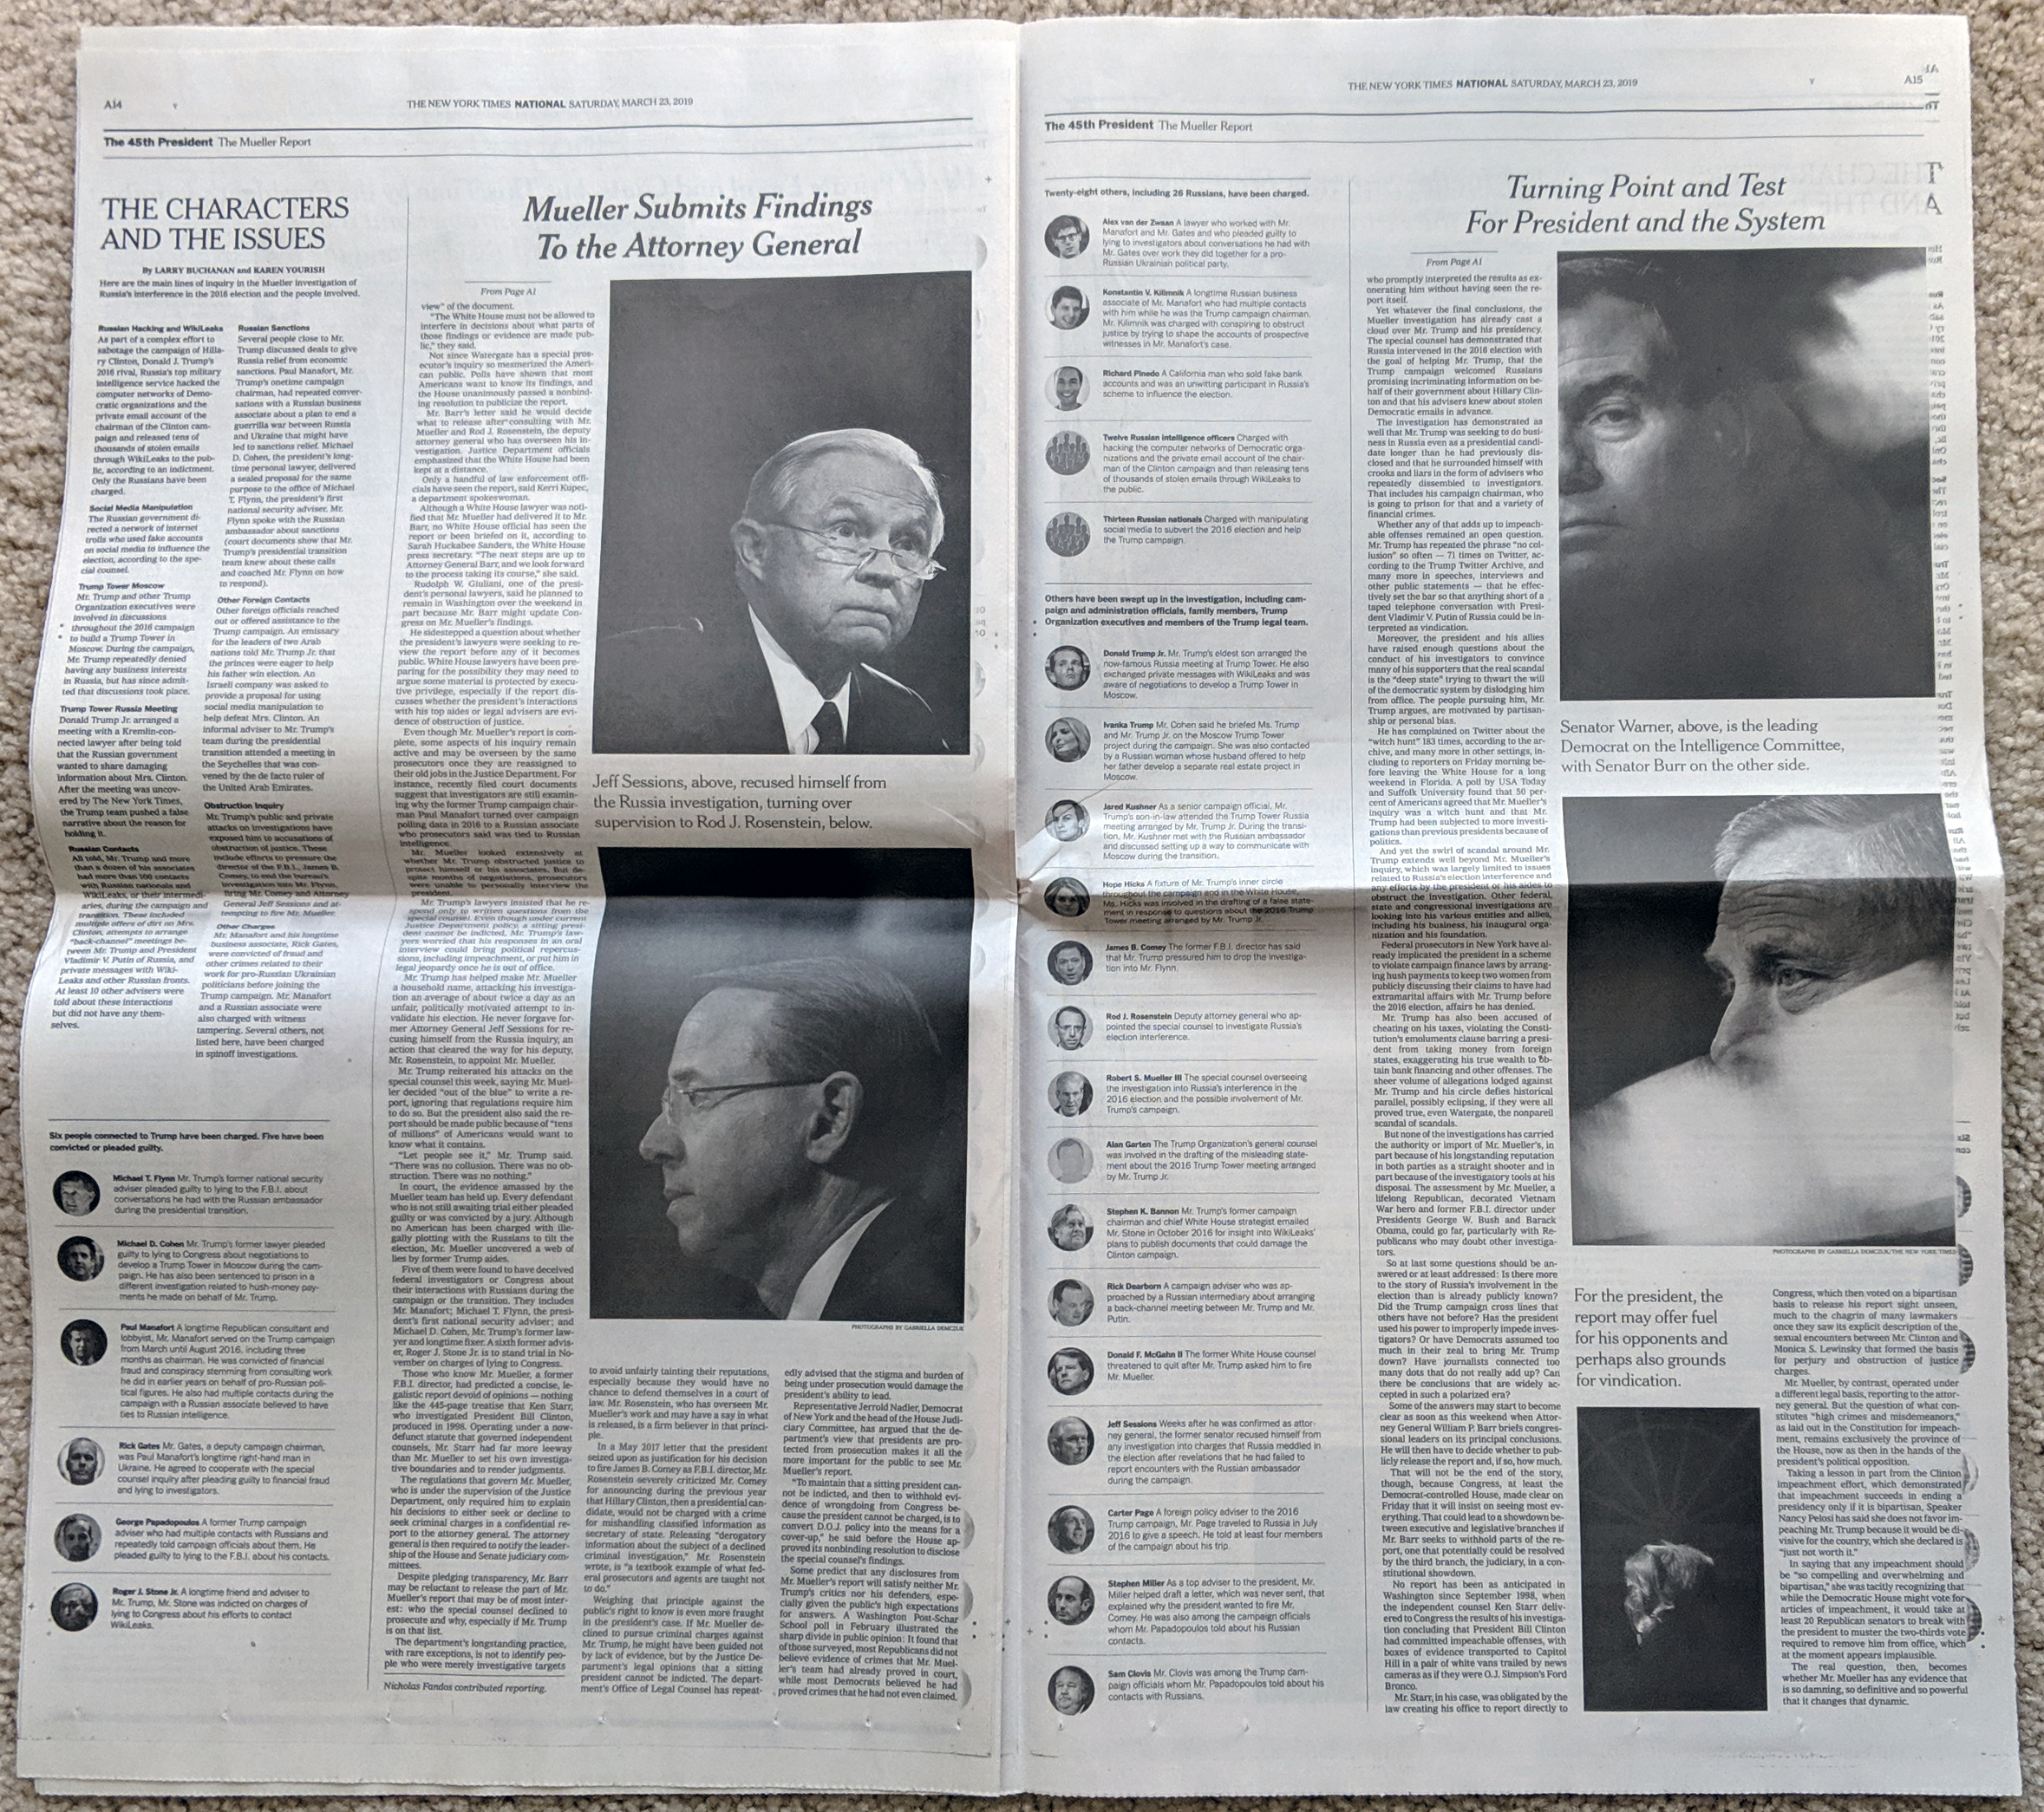
It highlighted the key figures in the report’s investigation and identified their current status. Many of those charged, essentially all the Russians, are unlikely to ever stand trial because Russia will not extradite them.

Inside the piece we had two full pages covering the report. The graphics were rather simple, like this, although as these were black and white pages, colouring the photographs was not an option. Instead, the designers simply used headers and titles to separate out the rogues’ gallery.

Not exactly the pages on which you want your name…

This wasn’t a complicated piece, but it made sense as one of the first pieces. For months we had been told the investigation was “wrapping up soon”, or words to that effect. Then, out of nowhere, it finally did. In one day, and crucially without the actual report yet, work like this reminded us that the report had, in fact, achieved its purpose.

Credit for the piece goes to the New York Times graphics department.

Mapping All the Buildings

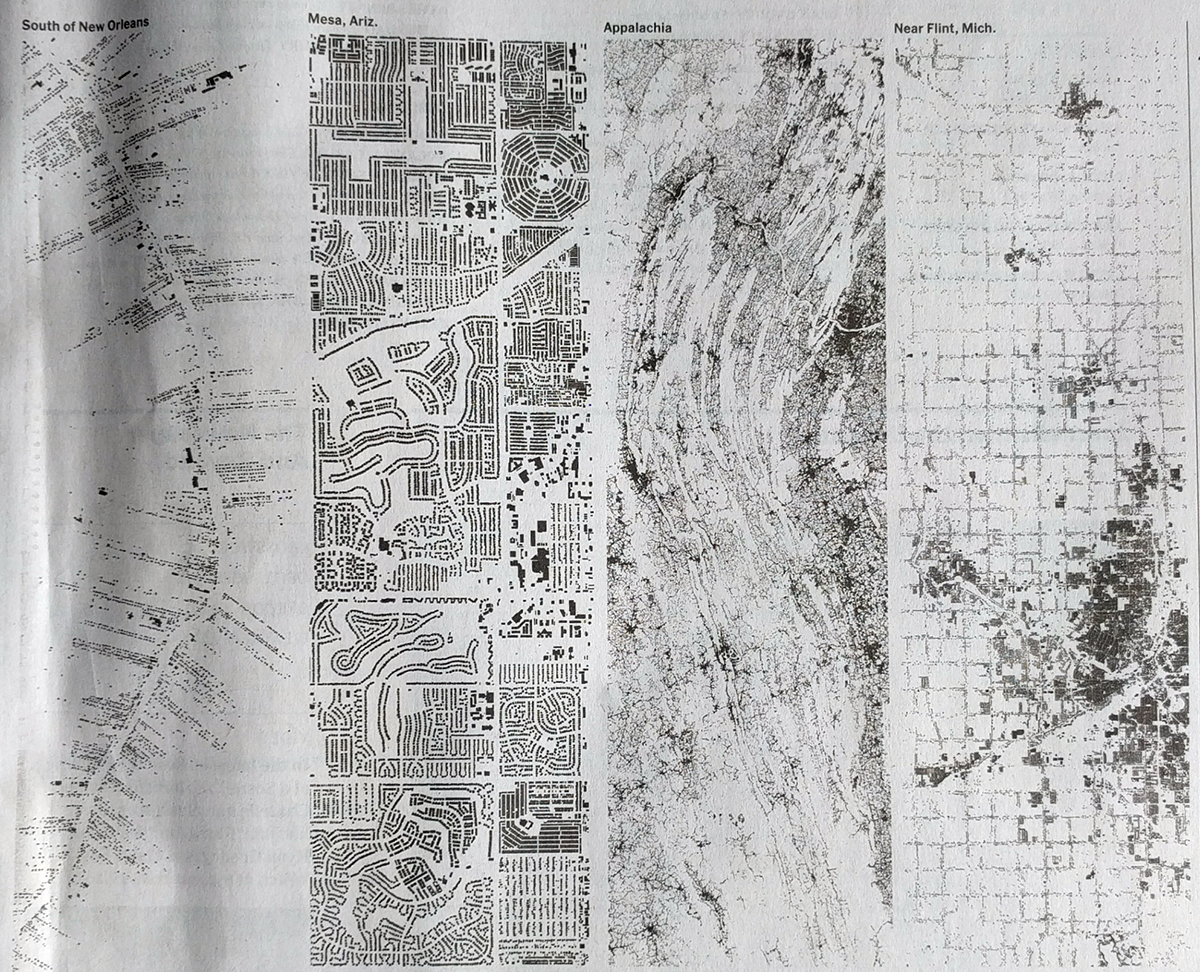
I wish I had more for this post. Saturday morning’s New York Times was delivered with this on the front page, above the fold. It promised a special section including graphics that showed every building in the United States with a pullout poster of a large major city.

I just wanted to see more…

I have been through my Sunday paper twice now and cannot find the maps. So while I would love to see the full work, and then probably share a bit of it with all of you, I cannot. Instead, we can only look at the above. Even there though, you can begin to get a sense of the different types of spatial arrangements our cities exhibit.

Credit for the piece goes to the New York Times graphics department.

Calendars

Throughout recorded history, calendars have profoundly impacted the development of human society. They allowed us to mark the rain or flood seasons to prepare for planting or reaping crops along the banks of rivers like the Nile. Calendars allowed us to account for the seasons and create the mythologies around them. We also have calendars for lunar cycles and other celestial objects.

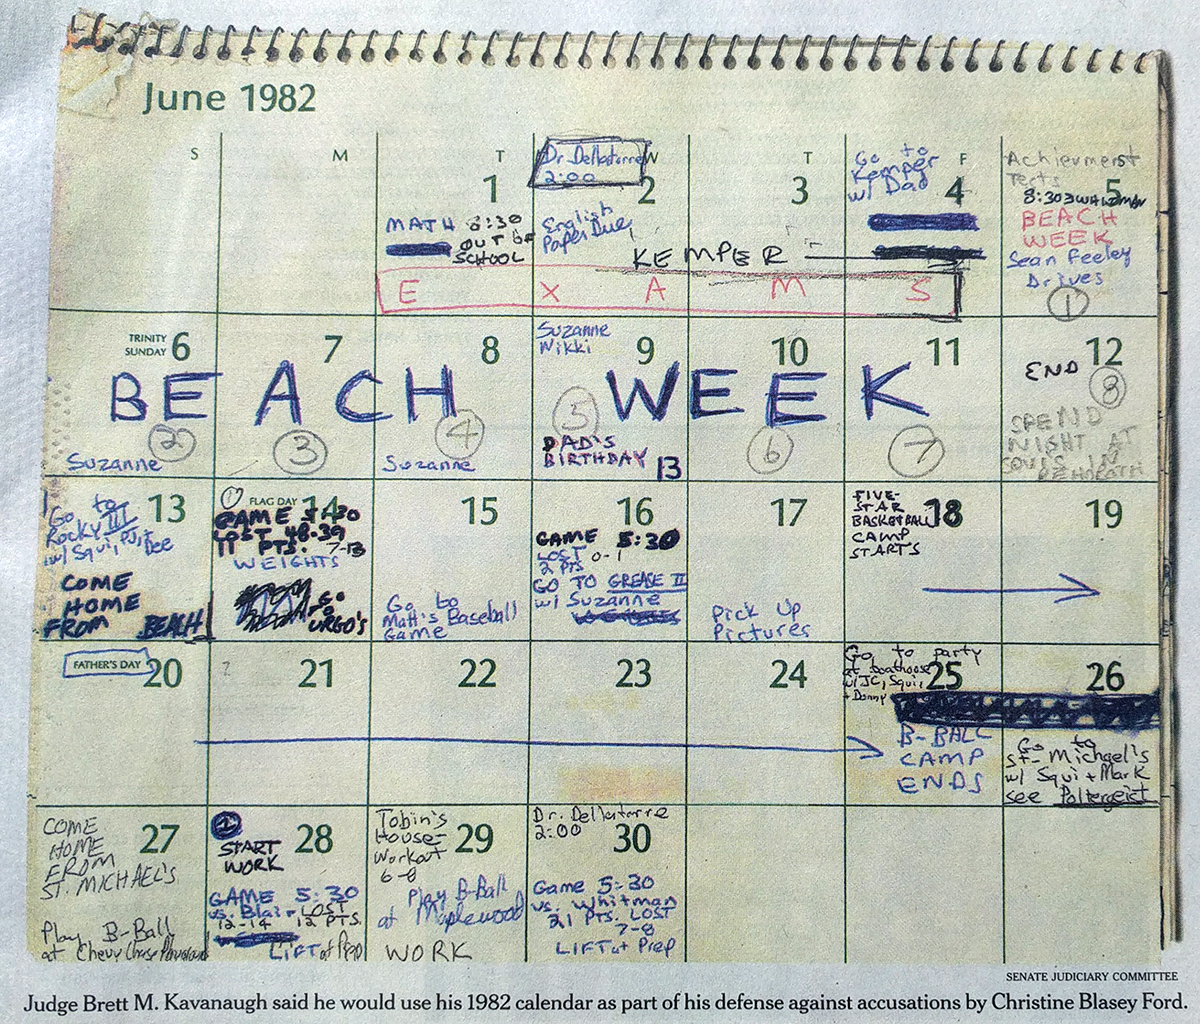
But the calendar looking to impact human history last week was this one:

But what was really happening on those dates…

That is the calendar of Brett Kavanaugh, nominee for the US Supreme Court. First, I find it remarkable that someone kept a calendar from 1982. Secondly, we are using this to corroborate or prove false allegations of sexual assault by said nominee.

The New York Times had this on their front page of Thursday’s print edition. And it did a great job of focusing the reader’s attention on arguably the most important story of the day.

As some of you are probably aware, the Senate Judiciary Committee, who must first vote on a Supreme Court nominee, interviewed one of the accusers. Republicans were forced to admit she is credible enough of a witness that instead of being confirming Kavanaugh, he is now being reinvestigated to see if these allegations are true.

Credit for the piece goes to Brett Kavanaugh.