
To celebrate, here’s a cropping from an infographic about breakups. From a whole series of graphics about breakups. You can thank me with some dead and rotting flowers.
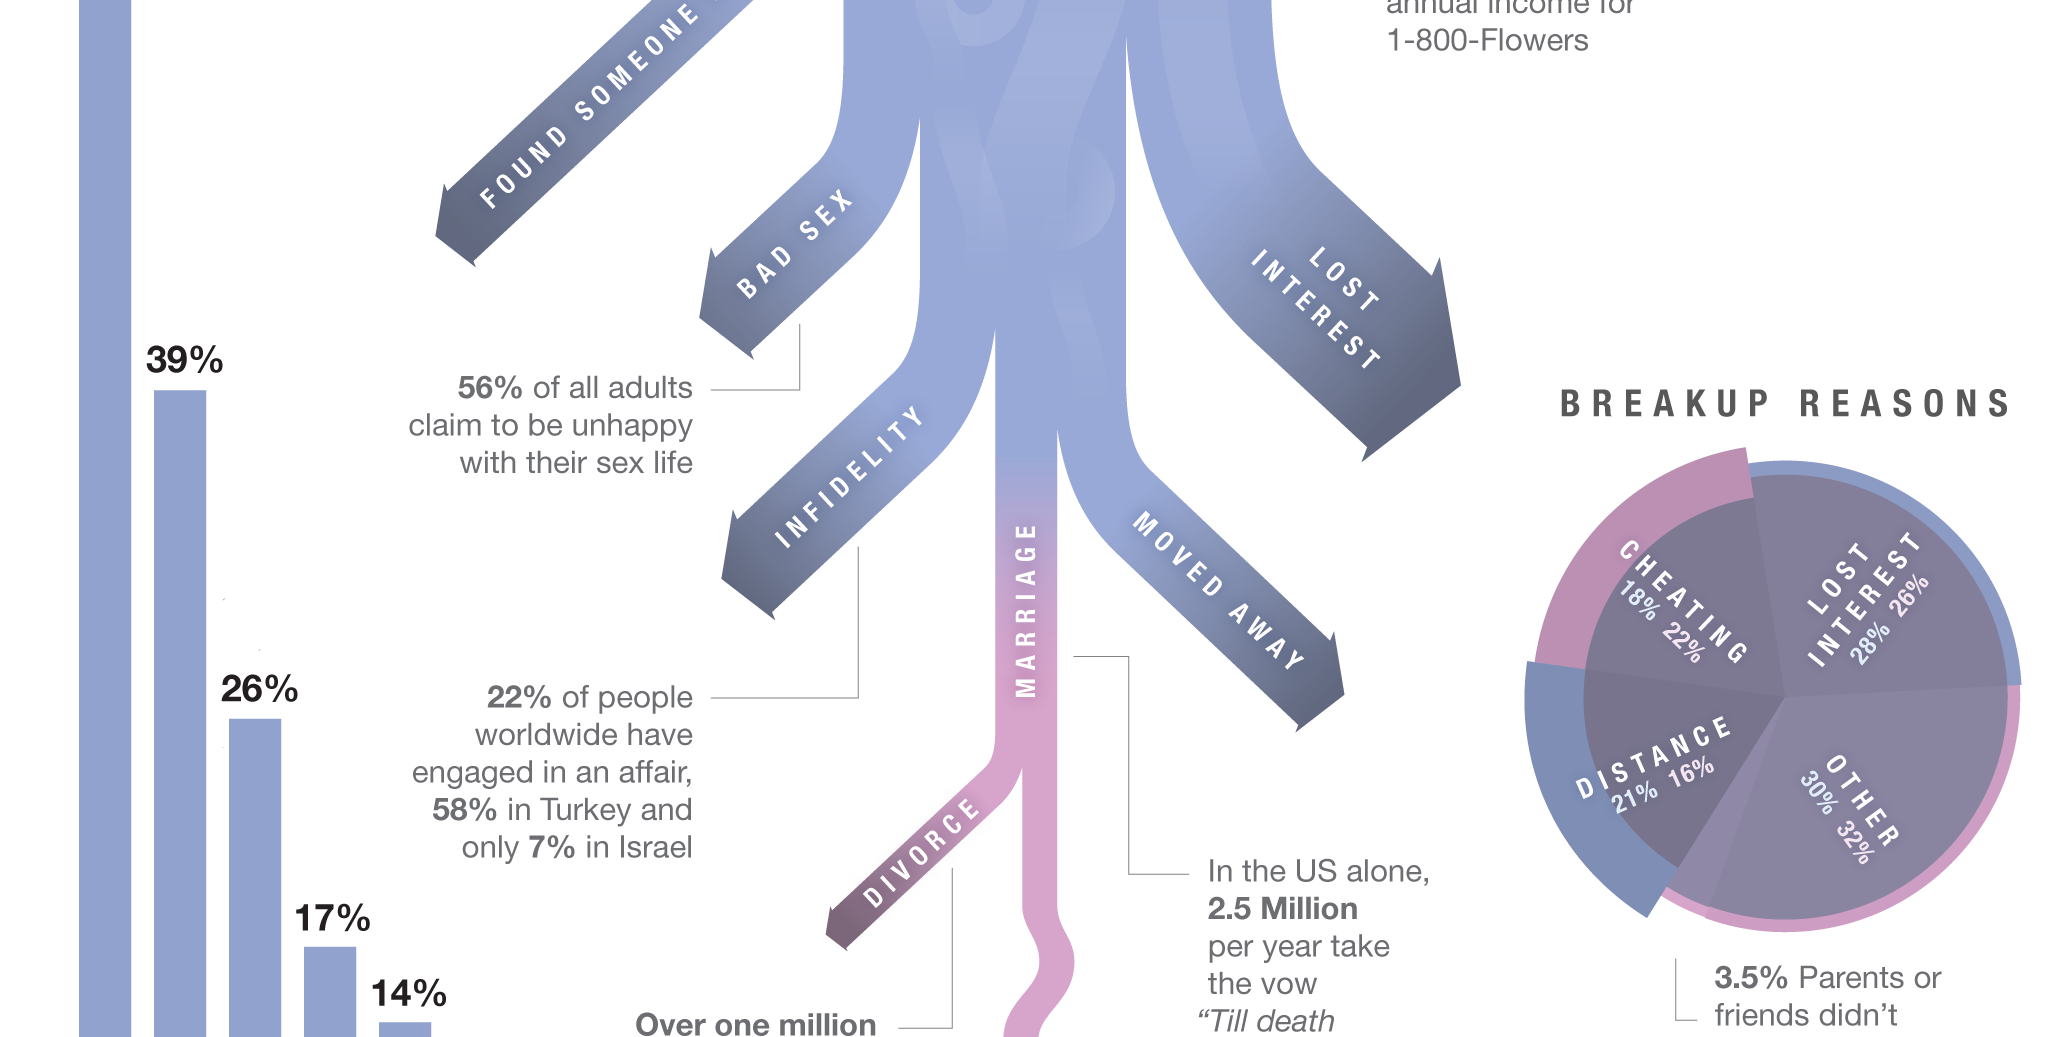
Credit for the piece goes to Lee Byron.
To celebrate, here’s a cropping from an infographic about breakups. From a whole series of graphics about breakups. You can thank me with some dead and rotting flowers.
Credit for the piece goes to Lee Byron.
Happy Friday, everyone. According to xkcd, I am failing the future test. That is to say, by 2019, I will be unable to communicate data through infographics or create data visualisations.
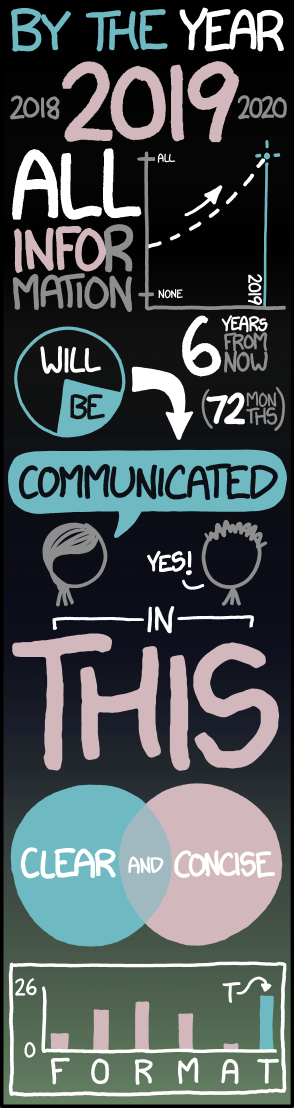
Credit for the piece goes to Randall Munroe.
Fear not, this graphic makes about as much sense as the title. The concept is actually a worthwhile exploration of the variation in caffeine across cups of coffee from different cafes and coffee shops. But, this visualisation fails at showing it.

Remember, pie charts show the piece amongst the whole. What is the whole in this case? A cup of coffee? No, the data labels indicate milligrams per fluid ounce. It appears as if 60mg./fl. oz. is the whole. A bit arbitrary that. So what happens if you lose the trite pie as a cup of coffee device and simply chart the values. Oh wait, that’s not very hard to do. (I also threw in what I believe to be the benchmark for an average cup of brewed coffee, though I could be wrong.)

Much clearer. More concise (I used less than the original’s dimensions).
Credit for the original piece goes to Dan Gentile.
Happy Friday, everyone. Today’s post comes via colleagues of mine in London, who shared with me the Guardian’s selection of 16 useless infographics. They are shit infographics. Well, at least one is. Check them out and you’ll understand.

Credit for the selection goes to Mona Chalabi. Credit for each infographic belongs to the infographic’s respective designer.
Monday was an odd day, both 1 April and the start of baseball. I had a tough decision to make: Do I post a serious baseball-related piece or a humourous April Fool’s Day one instead? If you recall, I went for the serious baseball option. But that leaves me with Friday, where I try to post work that is a bit on the lighter side of life.
So here is EagerPies, published by EagerEyes on 1 April. It’s in the style of the EagerEyes site, a blog with posts about data visualisation. This selection is EagerPies work to improve upon Minard and the layering of data sets. But if you worry about complexity, fret not for they realised that encoding data in transparency would be a step too far.

Credit for the piece goes to EagerPies.
Yesterday was National Pi Day. That’s Pi as in 3.14…not as in pie pie. Unless you celebrated Pi Day with pie. In which case, way to go, you. Me, I’m more traditional. I celebrated Pi Day with talk of pie charts. But at the Wonkblog over at the Washington Post, Sarah Kliff posted about several really impressive pie charts.
My favourite was the actual advertising done by the Economist back in Philly a few years ago. Their advert was printed atop a pizza pie box. It’s the double-whammy of Pi Day: pie charts atop a pizza pie.
The image below comes from a different site about the Economist ad campaign, found here, but the link goes to the celebration of pi with pie.

Thanks to my co-worker Eileen for passing on the tip.
Apparently the flu is going around. Boston has a city wide health emergency on its account. So if you’re wondering what to do on a sick day, well I shall allow you in all my magnanimity to use a pie chart. As Randall Munroe did.

With Palestine admitted to the United Nations as a non-member observer state, the Middle East tensions between Israel and Palestine have reached a new level. Regardless, Palestine may now have access to international institutions and is closer to being a recognised, sovereign state. Toronto’s National Post published a large infographic looking at the state of Palestine and how the two non-contiguous territories of the West Bank and the Gaza Strip compare to each other.

Credit for the piece goes to Richard Johnson.
The Washington Post brings us a look at the mess that is our Congressional representatives buying and selling stocks affected by the legislation they write, discuss, and upon which they vote. None of the charts in this piece are of themselves particularly complex—we are looking at a pie chart after all—but they do come together to tell a story of…wholly ethical behaviour…

Credit for the piece goes to Wilson Andrews, Emily Chow, David Fallis, Dan Keating, Laura Stanton, Sisi Wei, and Karen Yourish.
Nobody likes people cheating the unemployment system for benefits. Especially Canadians apparently. So this is a proposal to encourage the unemployed to start working.

Credit for the piece goes to Steve Murray.