Kiss Me, I’m Irish

Or just shake my hand, because today marks the second St. Patrick’s Day spent in isolation. I am lucky, of course, because two years ago I spent the holiday in Dublin. One of those bucket list kind of things. There I ran into a(n American) friend who was coincidentally in town. Then the next day I took the train to Cork to visit another friend. If you don’t count weddings, I think that was the last big trip I took.

Two years hence, I am here in my flat alone on a holiday meant to be spent with family and friends. But in the last year, I made significant progress on my Irish genealogy. For part of that progress I took two additional DNA tests. So this St. Patrick’s Day seems like a good time to reflect on those tests.

For those that don’t know, I do a lot of genealogy work as a hobby. Primarily I focus on paper records, but DNA is an important piece of the puzzle. In a sense, it is the only record that cannot lie. It will reveal your biological connections to family that may have been otherwise lost. And it cannot be faked.

But that’s only true for your genetic matches. Those are the real power of taking a DNA test. I would bet, however, that most people initially take the tests for the ethnicity estimates. On a day like today, how Irish are you? How Irish am I?
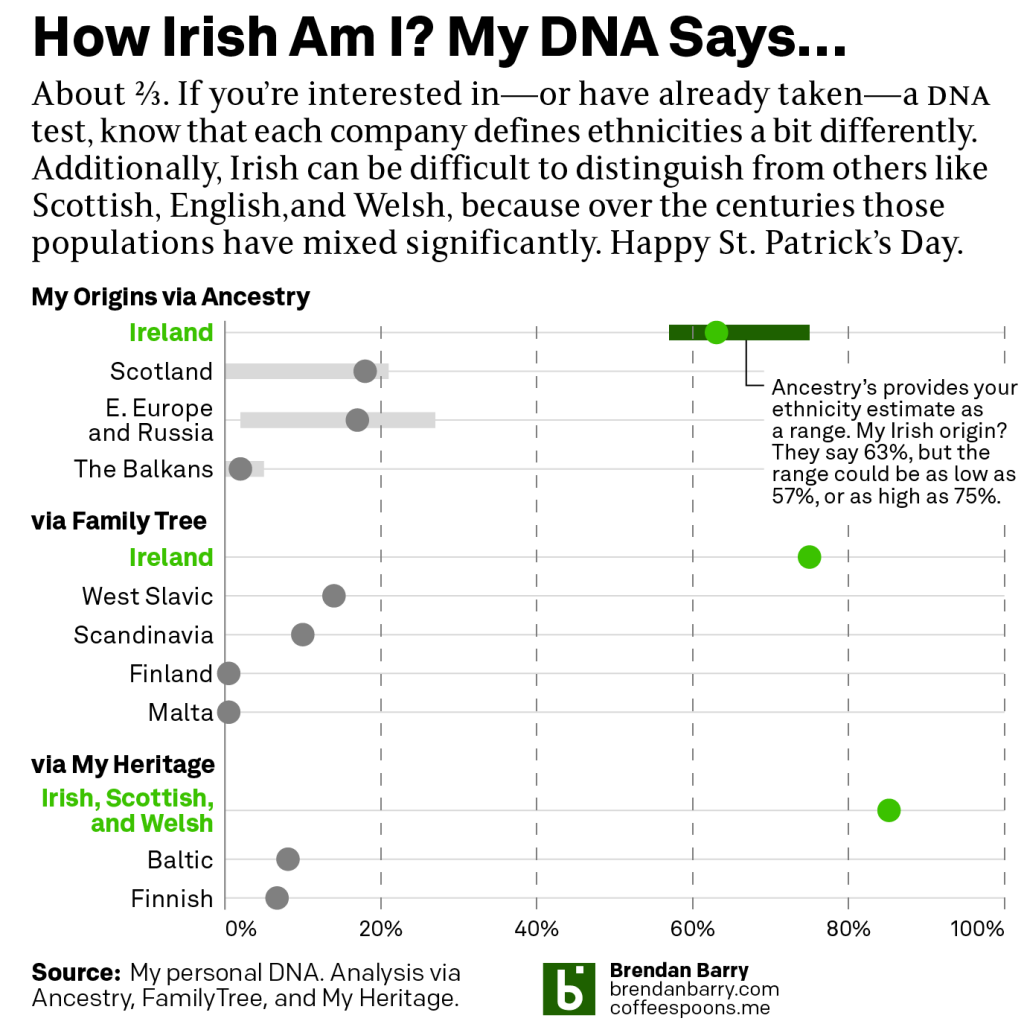
That’s a lot of green.

Not surprisingly, I’m pretty Irish.

Of course, if you look at me, those Irish values do not quite equal each other. So what’s the deal? After all, the underlying DNA does not change from spit tube to cheek swab.

The first thing to know is that in one sense, ethnicity is, like so many things, a social construct. Super broadly, every individual is unique—except twins. Of course humans have spread across the globe and in that spread, certain regions have evolved incredibly slight differences between the populations. In addition to those genetic differences, the populations created civilisations and cultures. An ethnicity, in a sense, is a group of people who share that culture, civilisation, and genetic similarities vis-a-vis genetic differences across the world.

Importantly, within those groups, we still have differences. The Irish, for example, are known for freckles and red hair. But not all Irish have those traits. Instead, again super broadly, we say that for a group of people, a certain percentage will share a certain set of features. Consequently, within an ethnic group, you will still have variations and outliers. In some cases because generations ago a traveller from a different group entered the gene pool for some reason or another. And while the offspring might identify entirely with their new civilisation and culture, their genes don’t lie and a DNA test would reveal their traits from their ancestor’s foreign gene pool.

The second point to make is that Ireland is a fairly modern creation. Ireland did not exist as a sovereign state until 1922. Before then, the idea of Ireland existed. The country, however, did not. A better example would be German or Italian. Neither Germany nor Italy existed until the 1870s and 1860s, respectively. If you have “German” ancestors who arrived in Philadelphia in 1848, you don’t have German ancestors. You have ancestors from one of the various principalities or bishoprics comprising the German Confederation. Italy had the Venetian Republic, the Kingdom of the Two Sicilies, and many others. Being Irish, German, or Italian is thus a modern construct.

The third point is that identifying anyone as any of these ethnic groups requires a baseline for a comparison. To do that, you need a reference population in the area you are going to define as Ireland, Germany, or Italy. But humans have migrated throughout history. Ireland was conquered by the English. Germans…well, let’s just say Germans have a history with conquering parts of Europe. And so you can see exchanges of genetic information among populations pretty easily. And over time, those genetic populations evolve.

Take those three points and add them together in admixture test and your results are really only good back to about 500 years. And even then, you may find yourself belonging to something incredibly vague and all-encompassing because, especially as with France and Germany, there’s been too much mixture to get so granular as to fit ourselves within the borders of modern political states.

In the above results, you can see my “Irishness” varies from 63% to 75%. Though, as far as I know 21/32 (66%) of my 3xgreat-grandparents arrived from Ireland. That’s why I say I’m 2/3 Irish. But, genetically, I may be more or less because those 21 might have English or Scottish ancestors. Ancestry says I may be 18% Scottish, but whilst I have ancestors who lived in Scotland, I’m not aware of any ancestors born and raised for multiple generations in Scotland.

And then that’s just how Ancestry defines it. Compare that to my results from My Heritage. Because of the aforementioned difficulty in separating out certain population groups, they lump the Irish, Scottish, and Welsh together. Add my Ancestry Irish and Scottish together and I have 81%, not far from My Heritage’s 85% estimate. Then look at my results from Family Tree. They estimate me as 75% Irish, but add in the 10% Scandinavia and I’m up to 85%.

That brings me to my last point about DNA tests. It’s probably fair to say that I’m something like 80–85% genetically from the British Isles/North Sea region. What about the other 15–20%?

You will often hear you receive half your DNA from each of your parents. And they get half from each of theirs and so on and so forth. I’ve had conversations with folks who take that to mean they get 25% from each grandparent and 12.5% from each great-grandparent et cetera. But that’s not quite true.

You do receive 50% of your DNA from your father and the other 50% from your mother. But that 50%, well that’s a sort of random sample from the share your parents received from their parents.

My maternal grandfather was 100% Carpatho-Rusyn. For generations, his ancestors lived, reproduced, and died in the Carpathian Mountains. If we received exactly half from each previous generation, I should expect 25% of my DNA from my grandfather. But Ancestry, which has the best representation of this small ethnic group, says it’s 17% (though they give it as a range of being between 2 and 27%). In other words, I’m missing seven percentage points.

And so if you take a DNA test and you know you have a great-great grandparents of Irish descent, you may only see a small fraction in your results. If your connection to Ireland (or anywhere else) is even further back, the result becomes smaller still. In fact, beyond 5–7 generations back, you may not even inherit any genetic material from a specific ancestor in your family tree.

But ultimately, for today, as I wrote in one of my very first posts here on Coffeespoons, back in 2010, on St. Patrick’s Day, we’re all at least a little bit Irish.

Hopefully next year we’ll be able to celebrate in person.

Credit for the piece is mine.

Armistice Day

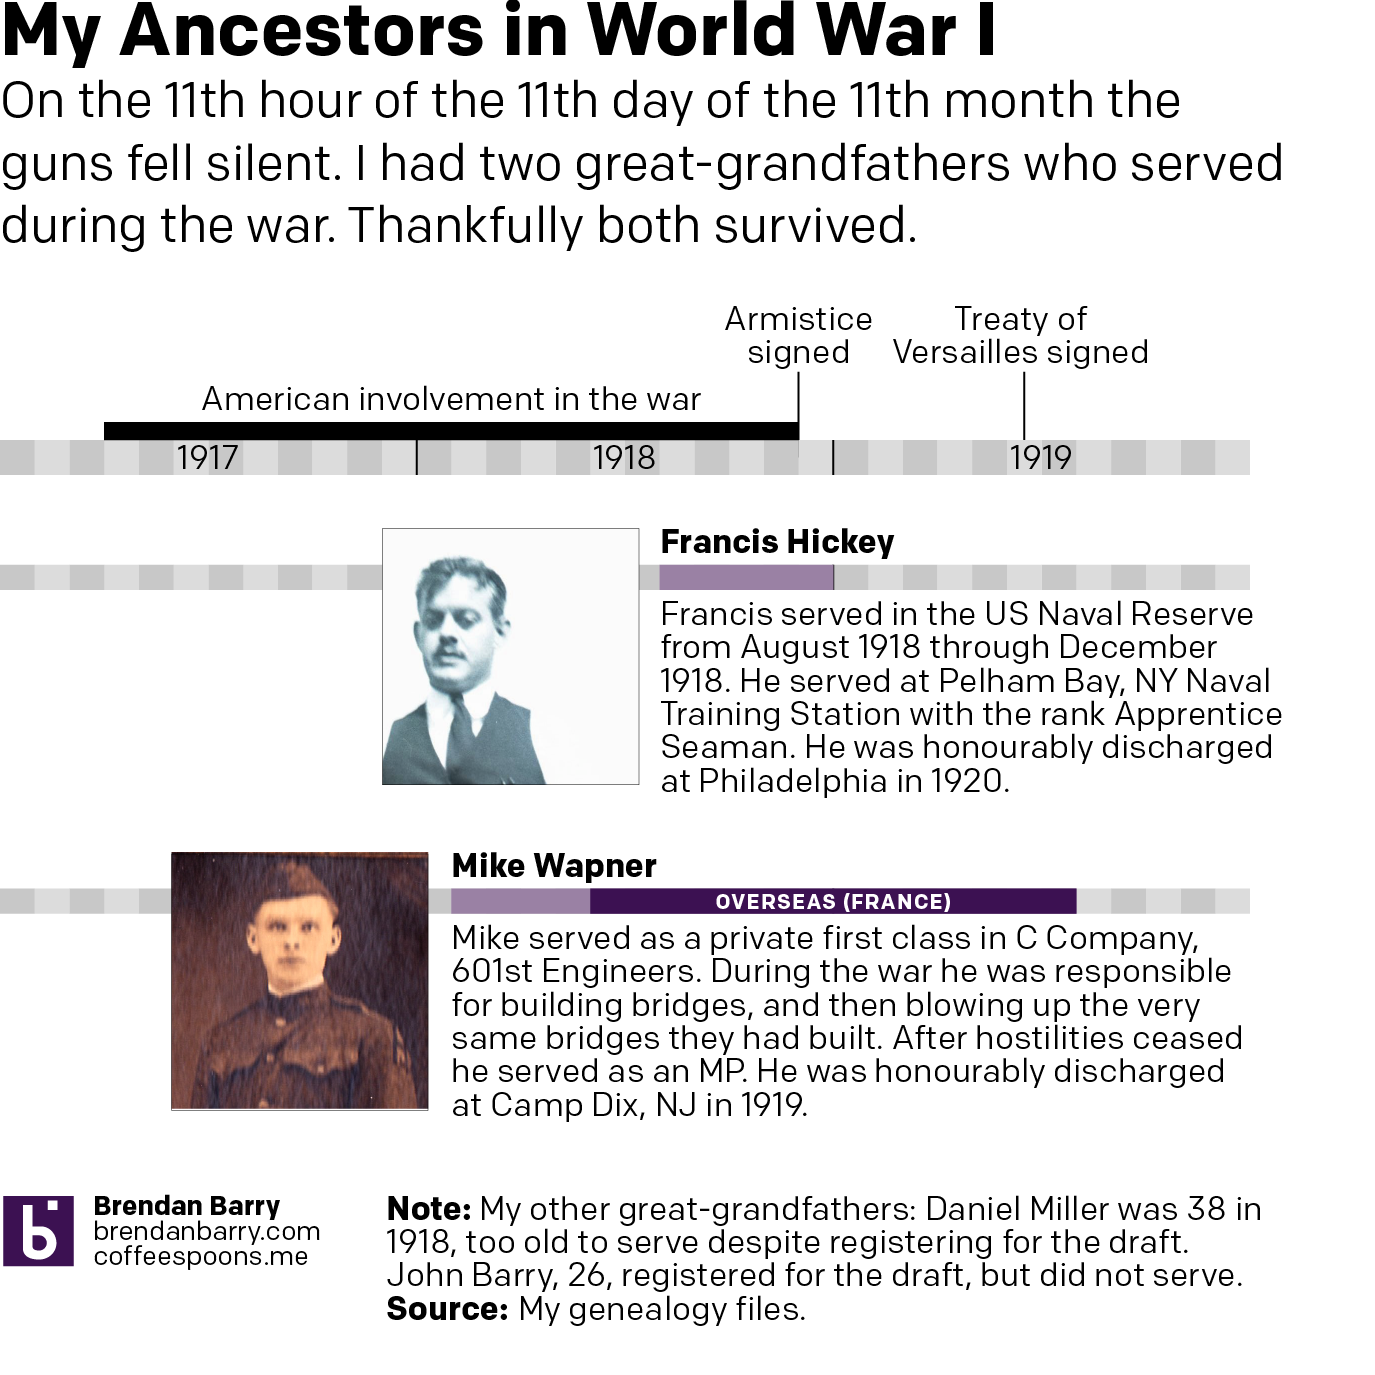
Yesterday was Armistice Day, a bank holiday hence the lack of posting. So I spent a few hours yesterday looking at my ancestors to see who participated in World War I. It turned out that on my paternal side, my one great-grandfather was too old and the other was both the right age and signed up for the draft, but was not selected.

And so the only two that served were my maternal great-grandfathers. One served a few months in the naval reserve towards the end of the war. My other great-grandfather served for a year, a good chunk of it in France. This I largely knew from my great aunt, who had told us stories about how he had told her about blowing up bridges they had just built to prevent Germans from capturing them. And then how after the war he served as military police, arresting drunk American soldiers in France. But I had never realised some of the documents I had collected told more of the skeletal structure like units and ranks. Consequently, I decided to make this graphic.

All the timelines
All the timelines

Credit for the piece goes to me.

Where Is That Pesky Mason–Dixon Line?

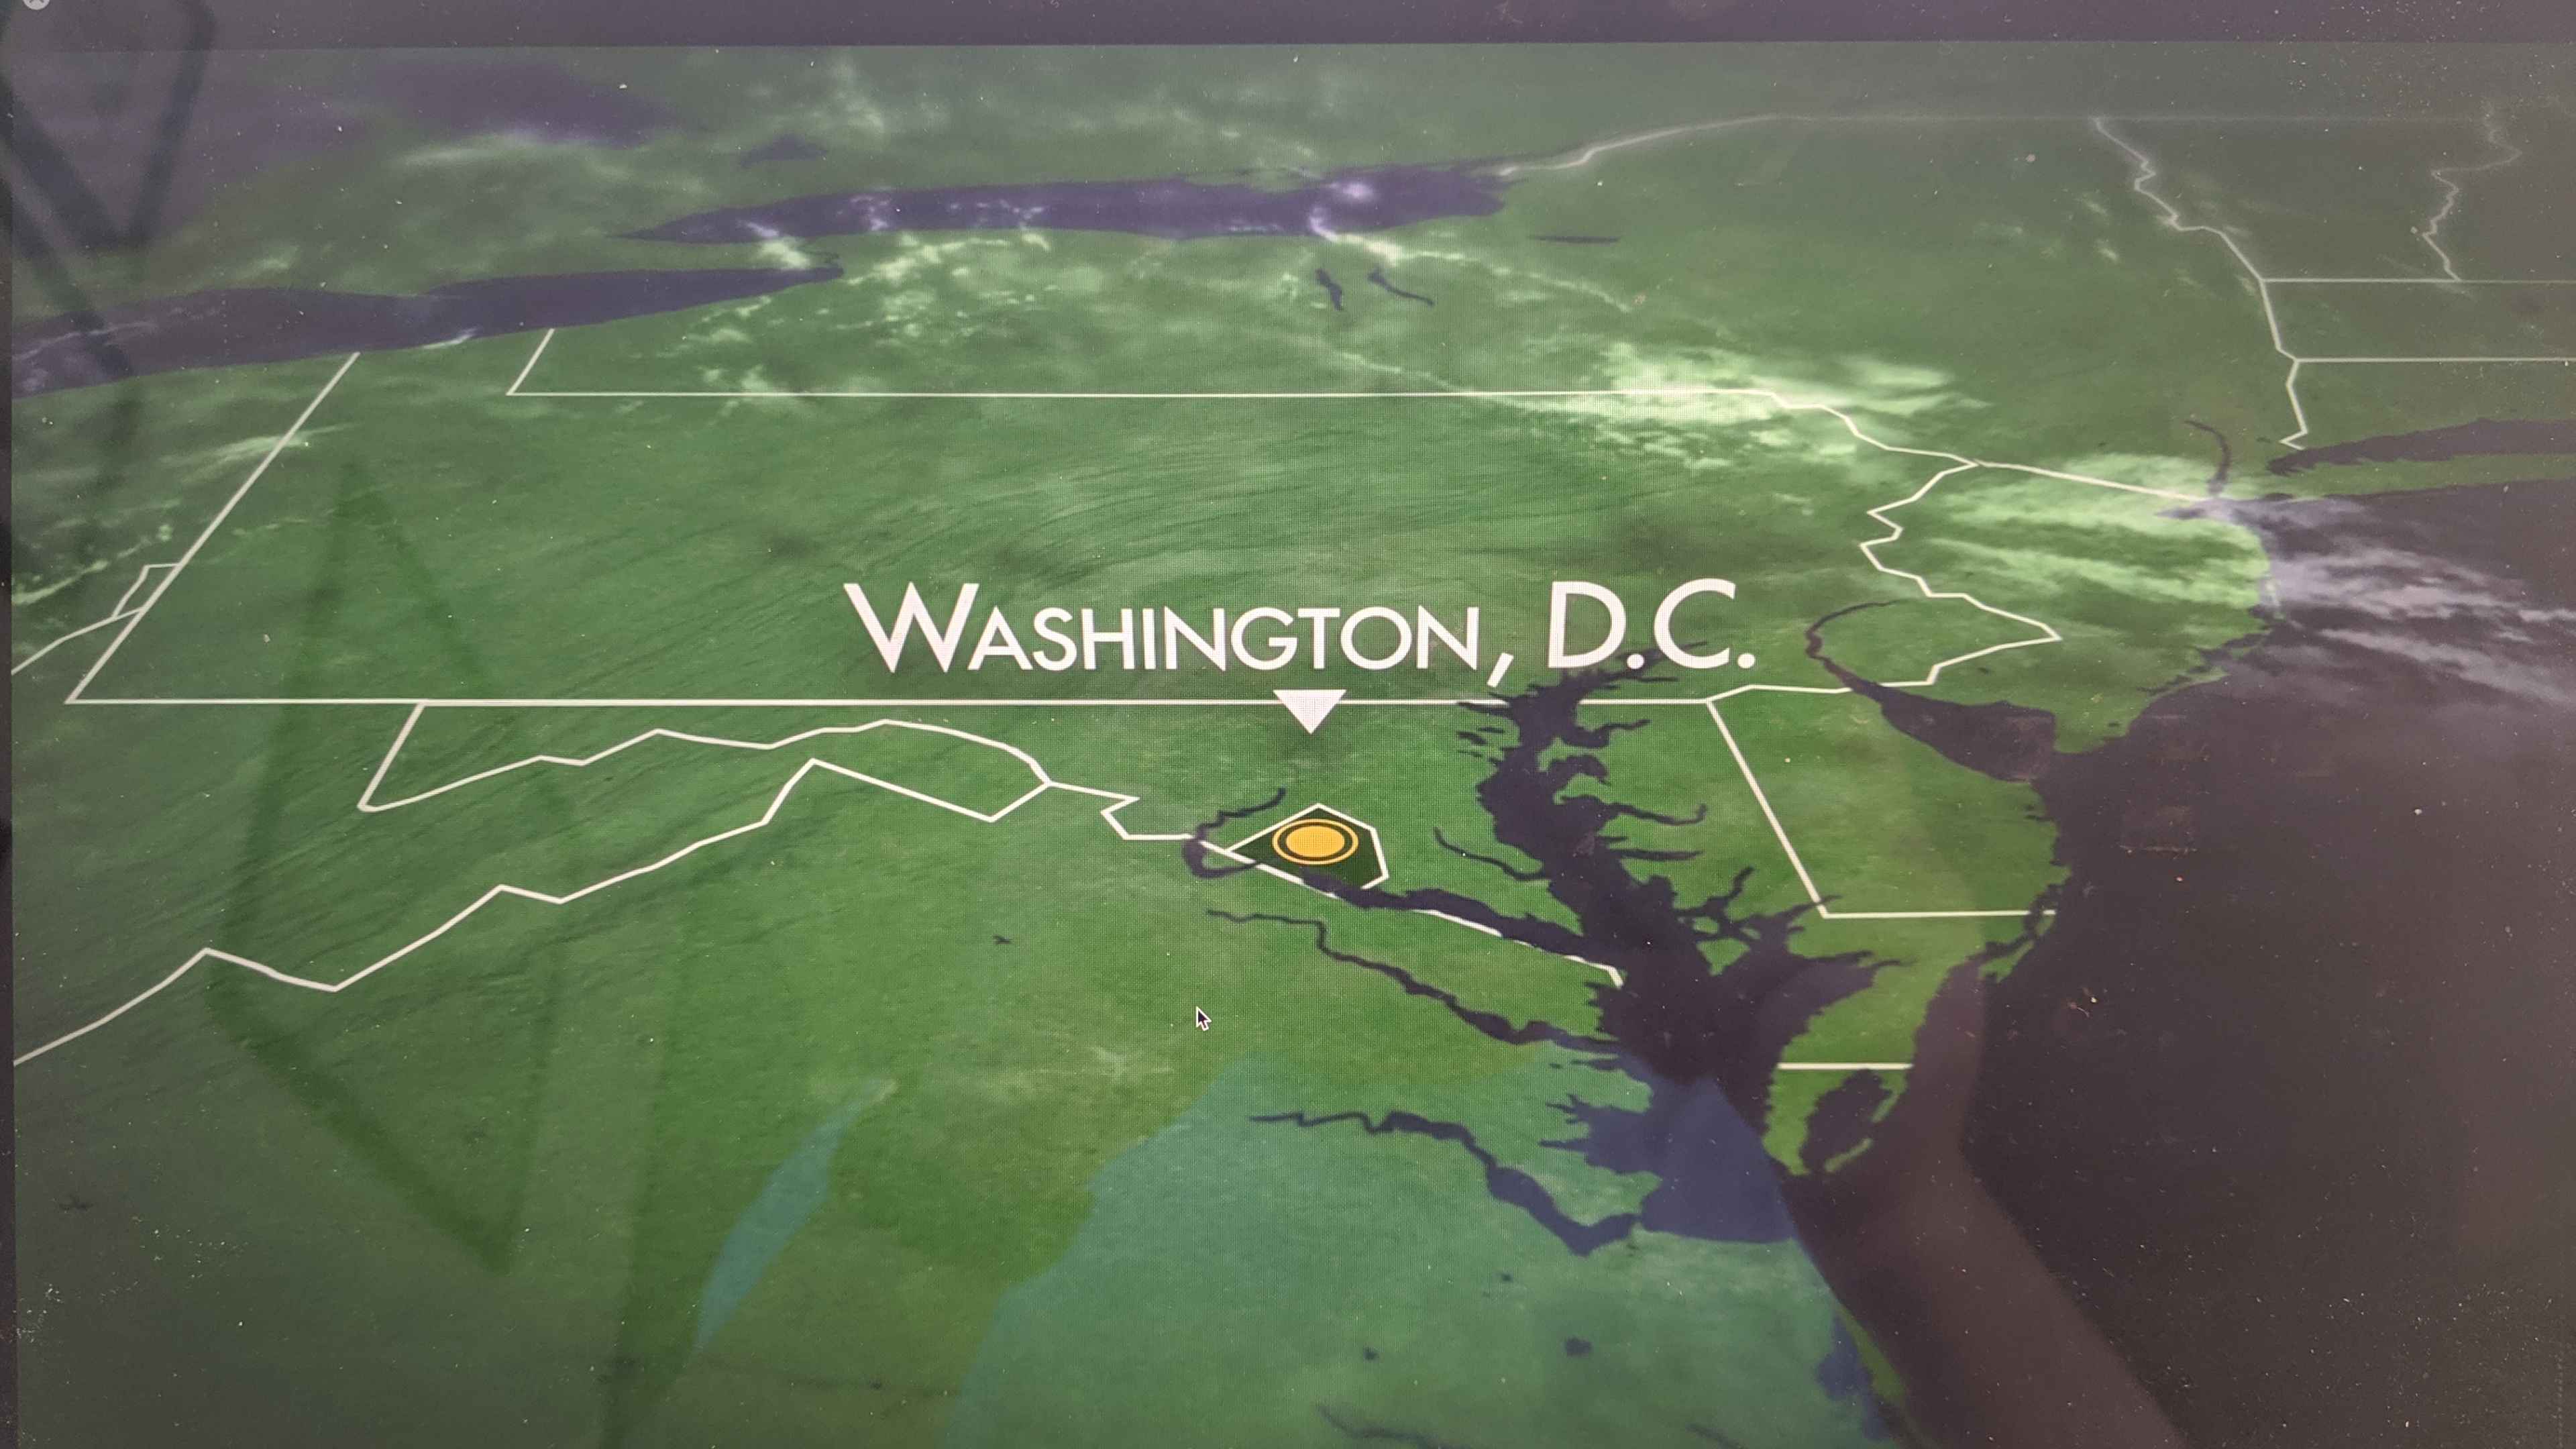
It’s no big secret that genealogy and family history are two of my big interests and hobbies. Consequently, on rainy days I sometimes like to enjoy an episode or two of Who Do You Think You Are (I prefer the UK version, but the American one will do too) or Finding Your Roots. So I decided to watch one last night about Megan Mullally of Will & Grace fame. Long story short, her family has a connection to Philadelphia (only one block away from where I presently live) and so I paid a bit of attention to the map.

Now, DRM prevented me from taking a straight screenshot, so this is a photo of a screen—my apologies. But there is something to point out.

Mason and Dixon would be disappointed

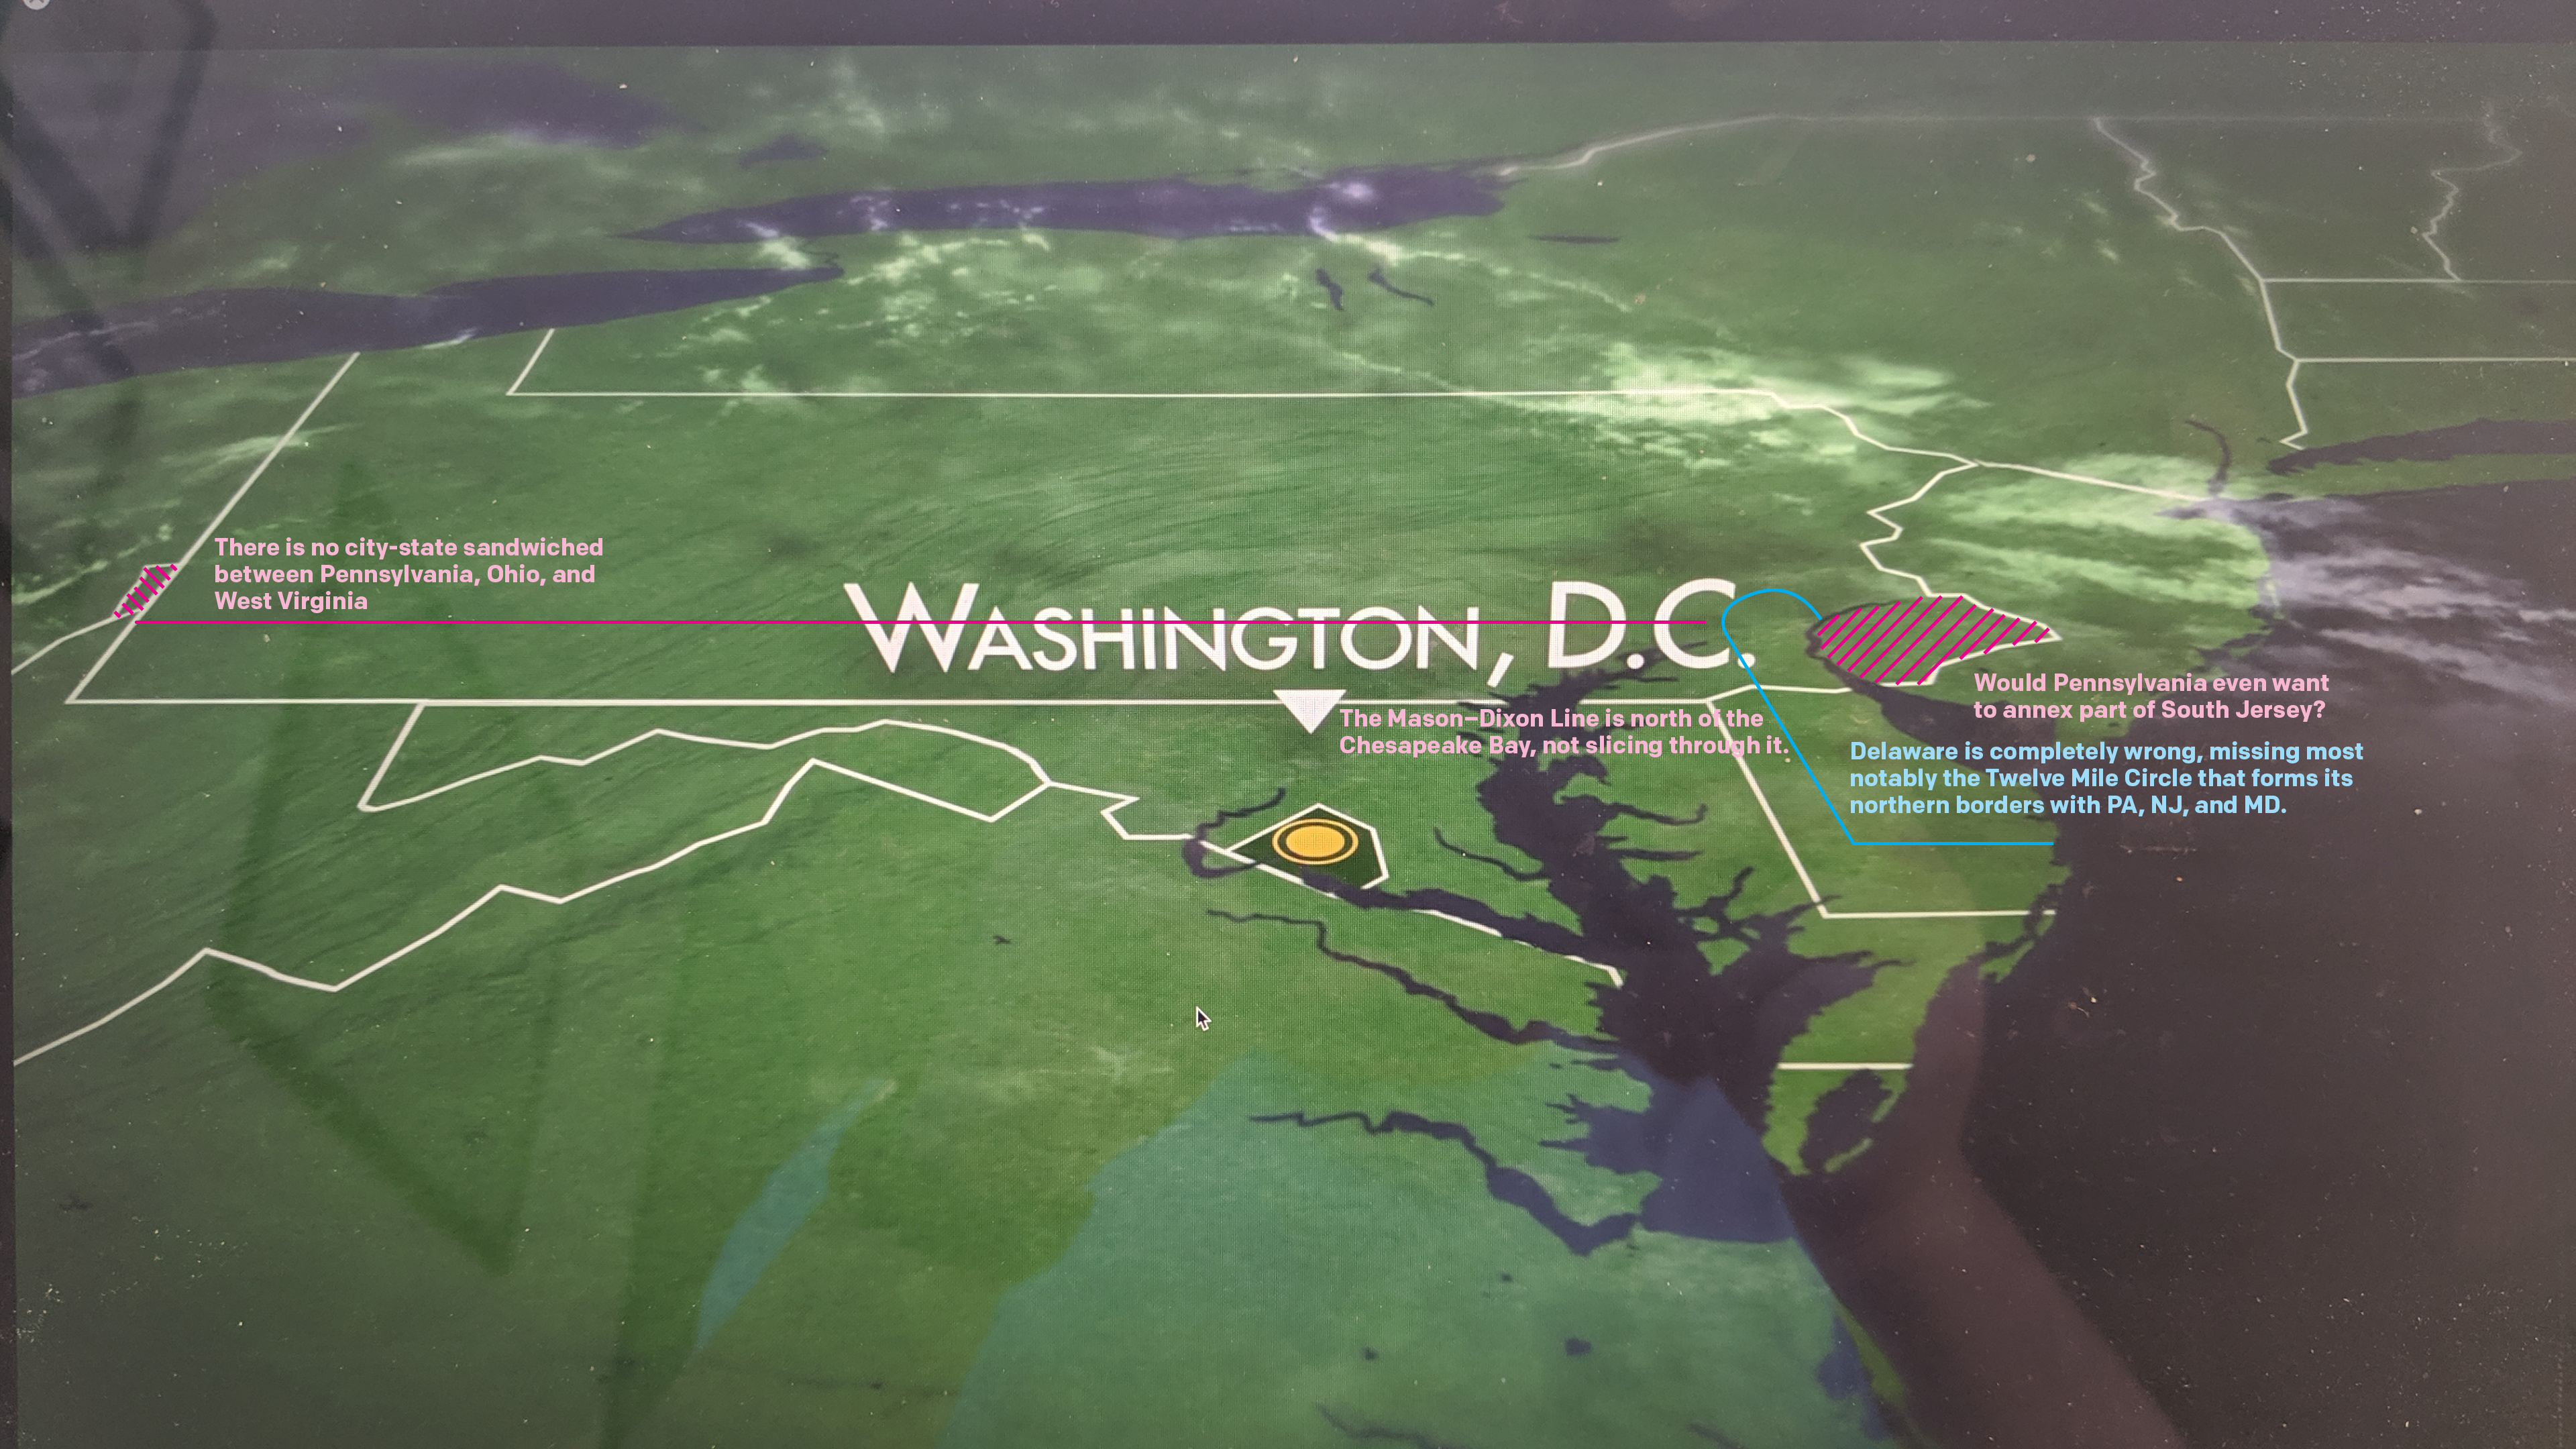
The borders are wrong. So I made a quick annotation pointing out the highlights as it relates to Pennsylvania.

So many mistakes…
So many mistakes…

Credit for the piece goes to the Who Do You Think You Are graphics department.

The annotations are mine, though as for their geographic accuracy, they are approximate. I mean after all, I’m using Photoshop to put lines on a photograph of a laptop screen.

The Roaming Life of Rev. Dr. Stephen Remington

As many of you are aware, one of my personal interests is in genealogy and my family history. And sometimes, data visualisation can help make sense of my research. This past weekend, I was looking through some of my notes on my great-great-great-great-grandfather, a man named Stephen Remington.

One of the outstanding questions is who was his wife, a woman named Eliza Ann. Her surname might be either Garretson or Caustin. So I used a timeline of Stephen’s residences to see if any his residences overlapped with similar surnames. It sort of did, but not until after the year he married her. So still more work is needed.

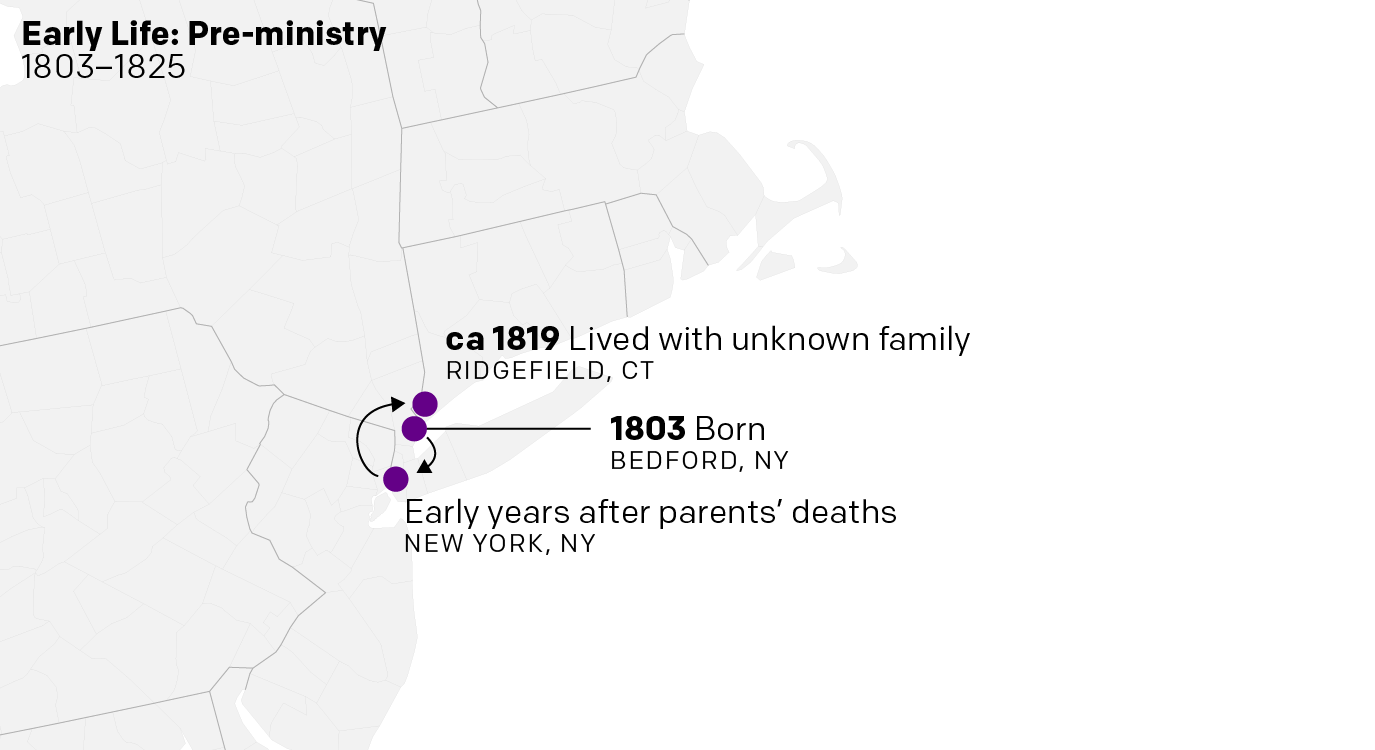
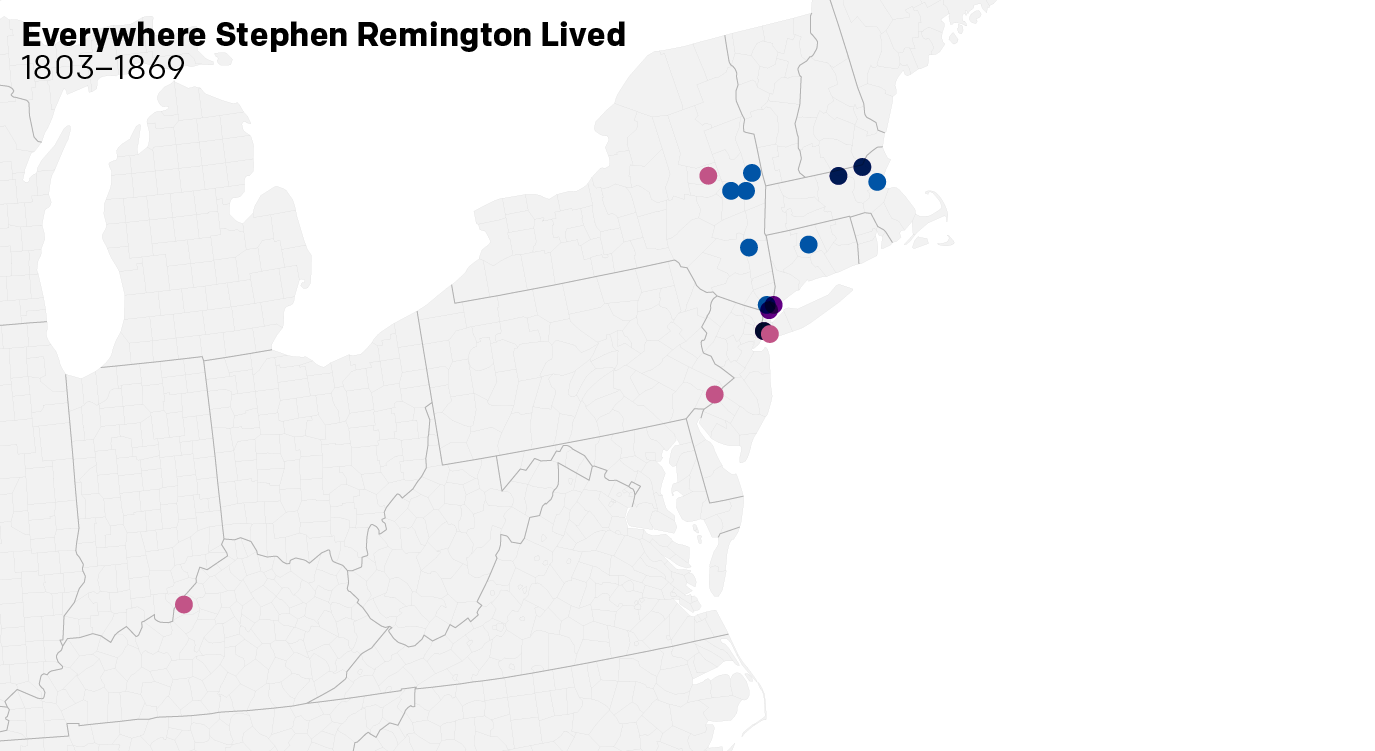
But then I decided with a few tweaks I could actually plot out where he lived, because he lived all over. His earliest years are a bit of a mystery, because his parents are both unknown and they both died during Stephen’s youth.

Ridgefield was home to a small cluster of Remingtons. Were they related?

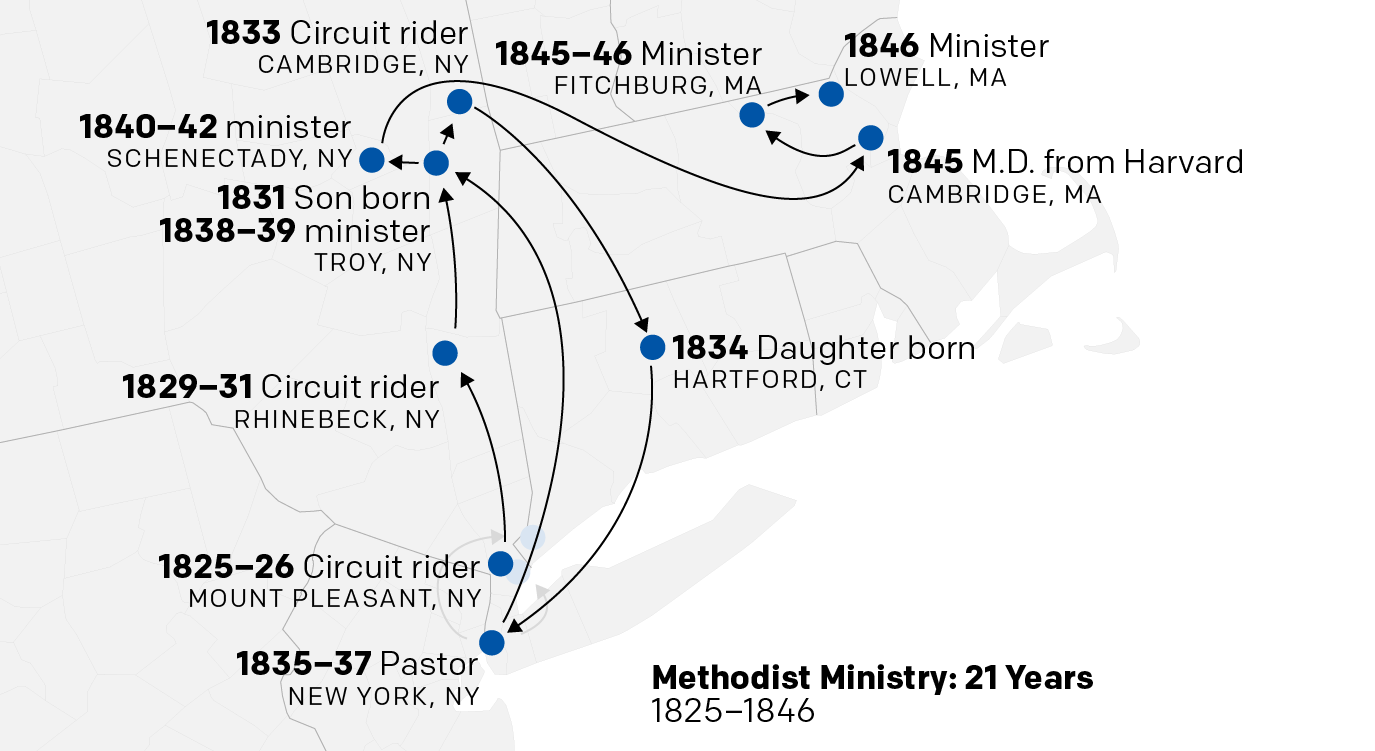
In his earlier years he was what was called a circuit rider. Before there were large, dense settlements of people, the rural and frontier people relied upon essentially travelling ministers. The ministers had a responsibility for a small (sometimes large) area. And early in Stephen’s life his circuit riding kept pushing him north up the Hudson River with occasional postings back to New York City.

Rhinebeck is the town demanding my closer attention for Eliza's sake.
Rhinebeck is the town demanding my closer attention for Eliza’s sake.

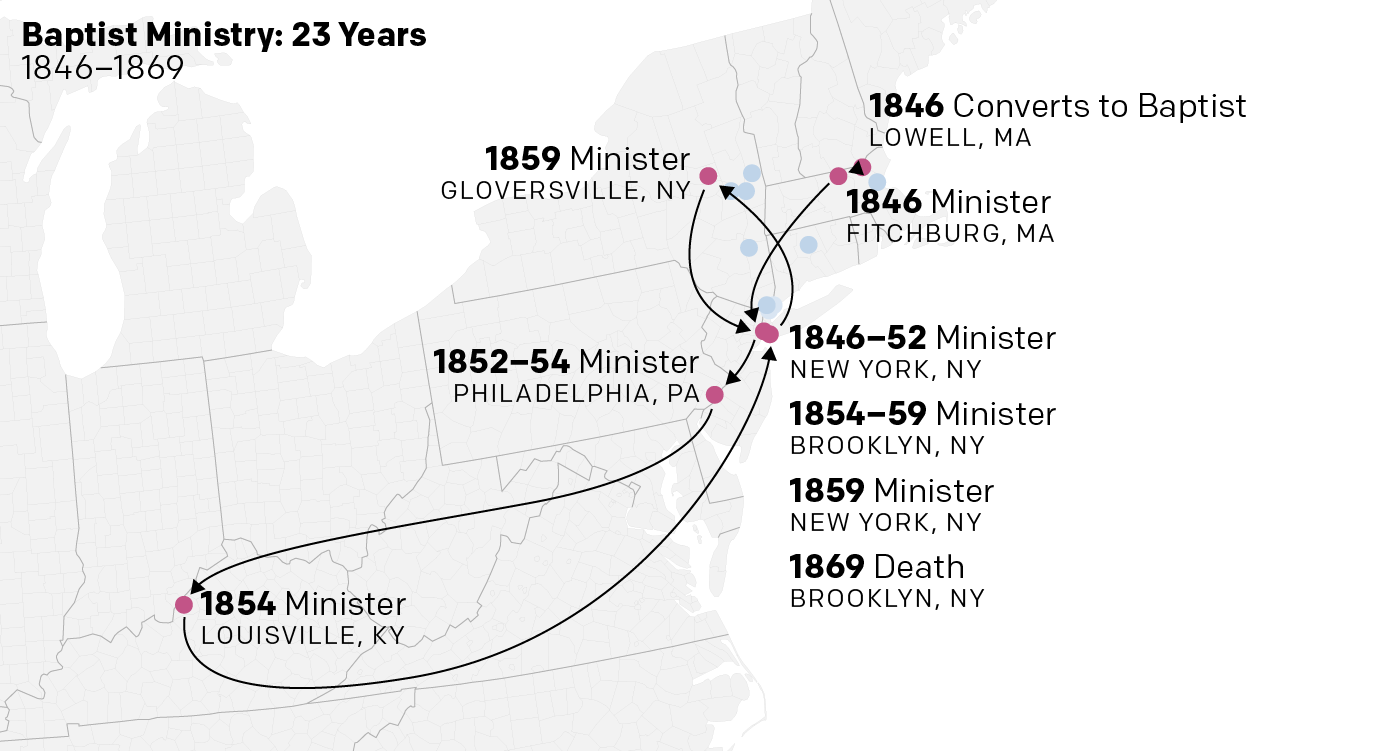
Eventually, however, he ended up preaching in Massachusetts, where he separately earned his medical doctorate from Harvard University. He practiced medicine on the side for years. Then in 1846 he converted from the Methodist church to the Baptist church. He wrote about it in a notable book/pamphlet: Reasons for Becoming a Baptist.

From then he became an itinerant pastor, never staying at a single congregation for more than five years or so. He travelled from New York to Philadelphia to Louisville for several months then back to New York.

Evidently his time in Louisville was short, possibly because of anti-slavery views.

He preached as a Baptist for twenty-plus more years before finally settling in Brooklyn, where he died at the age of 66. He lived all over the mid-Atlantic, especially the Hudson River Valley. And while he returned to places over the years, notably New York City, he appears to have never stayed in one place longer than maybe five years.

That was a lot of places for Stephen to hang his hat.

As for Eliza, she died in 1850. But I wonder if she may be related to a cluster of Garretsons that lived in Rhinebeck, which included the famous Reverend Freeborn Garretson, a circuit riding Methodist minister.

The daughter born in Hartford is my direct ancestor. She eventually married a man in New York City with the surname Miller. Then, after having a son (my next direct ancestor), she upped and moved to Wisconsin and married another man with the surname Miller, who was not related to the first. There is talk of a divorce, but no record of it. Could she have been a bigamist? That’s a story for another day.

The Great Migration Map

Yesterday in a post about Angela’s forced journey from Africa to Jamestown I mentioned that the Pilgrims arrived at Plymouth Bay just one year later in 1620. From 1620 until 1640 approximately 20,000 people left England and other centres like Leiden in the Netherlands for New England. Unlike places like Jamestown that were founded primarily for economic reasons, New England was settled for religious reasons. Consequently, whereas colonies in Virginia drew young men looking to make it rich—along with slaves to help them—New England saw entire families moving and transplanting parts of towns and England into Massachusetts, Rhode Island, Connecticut, and New Hampshire.

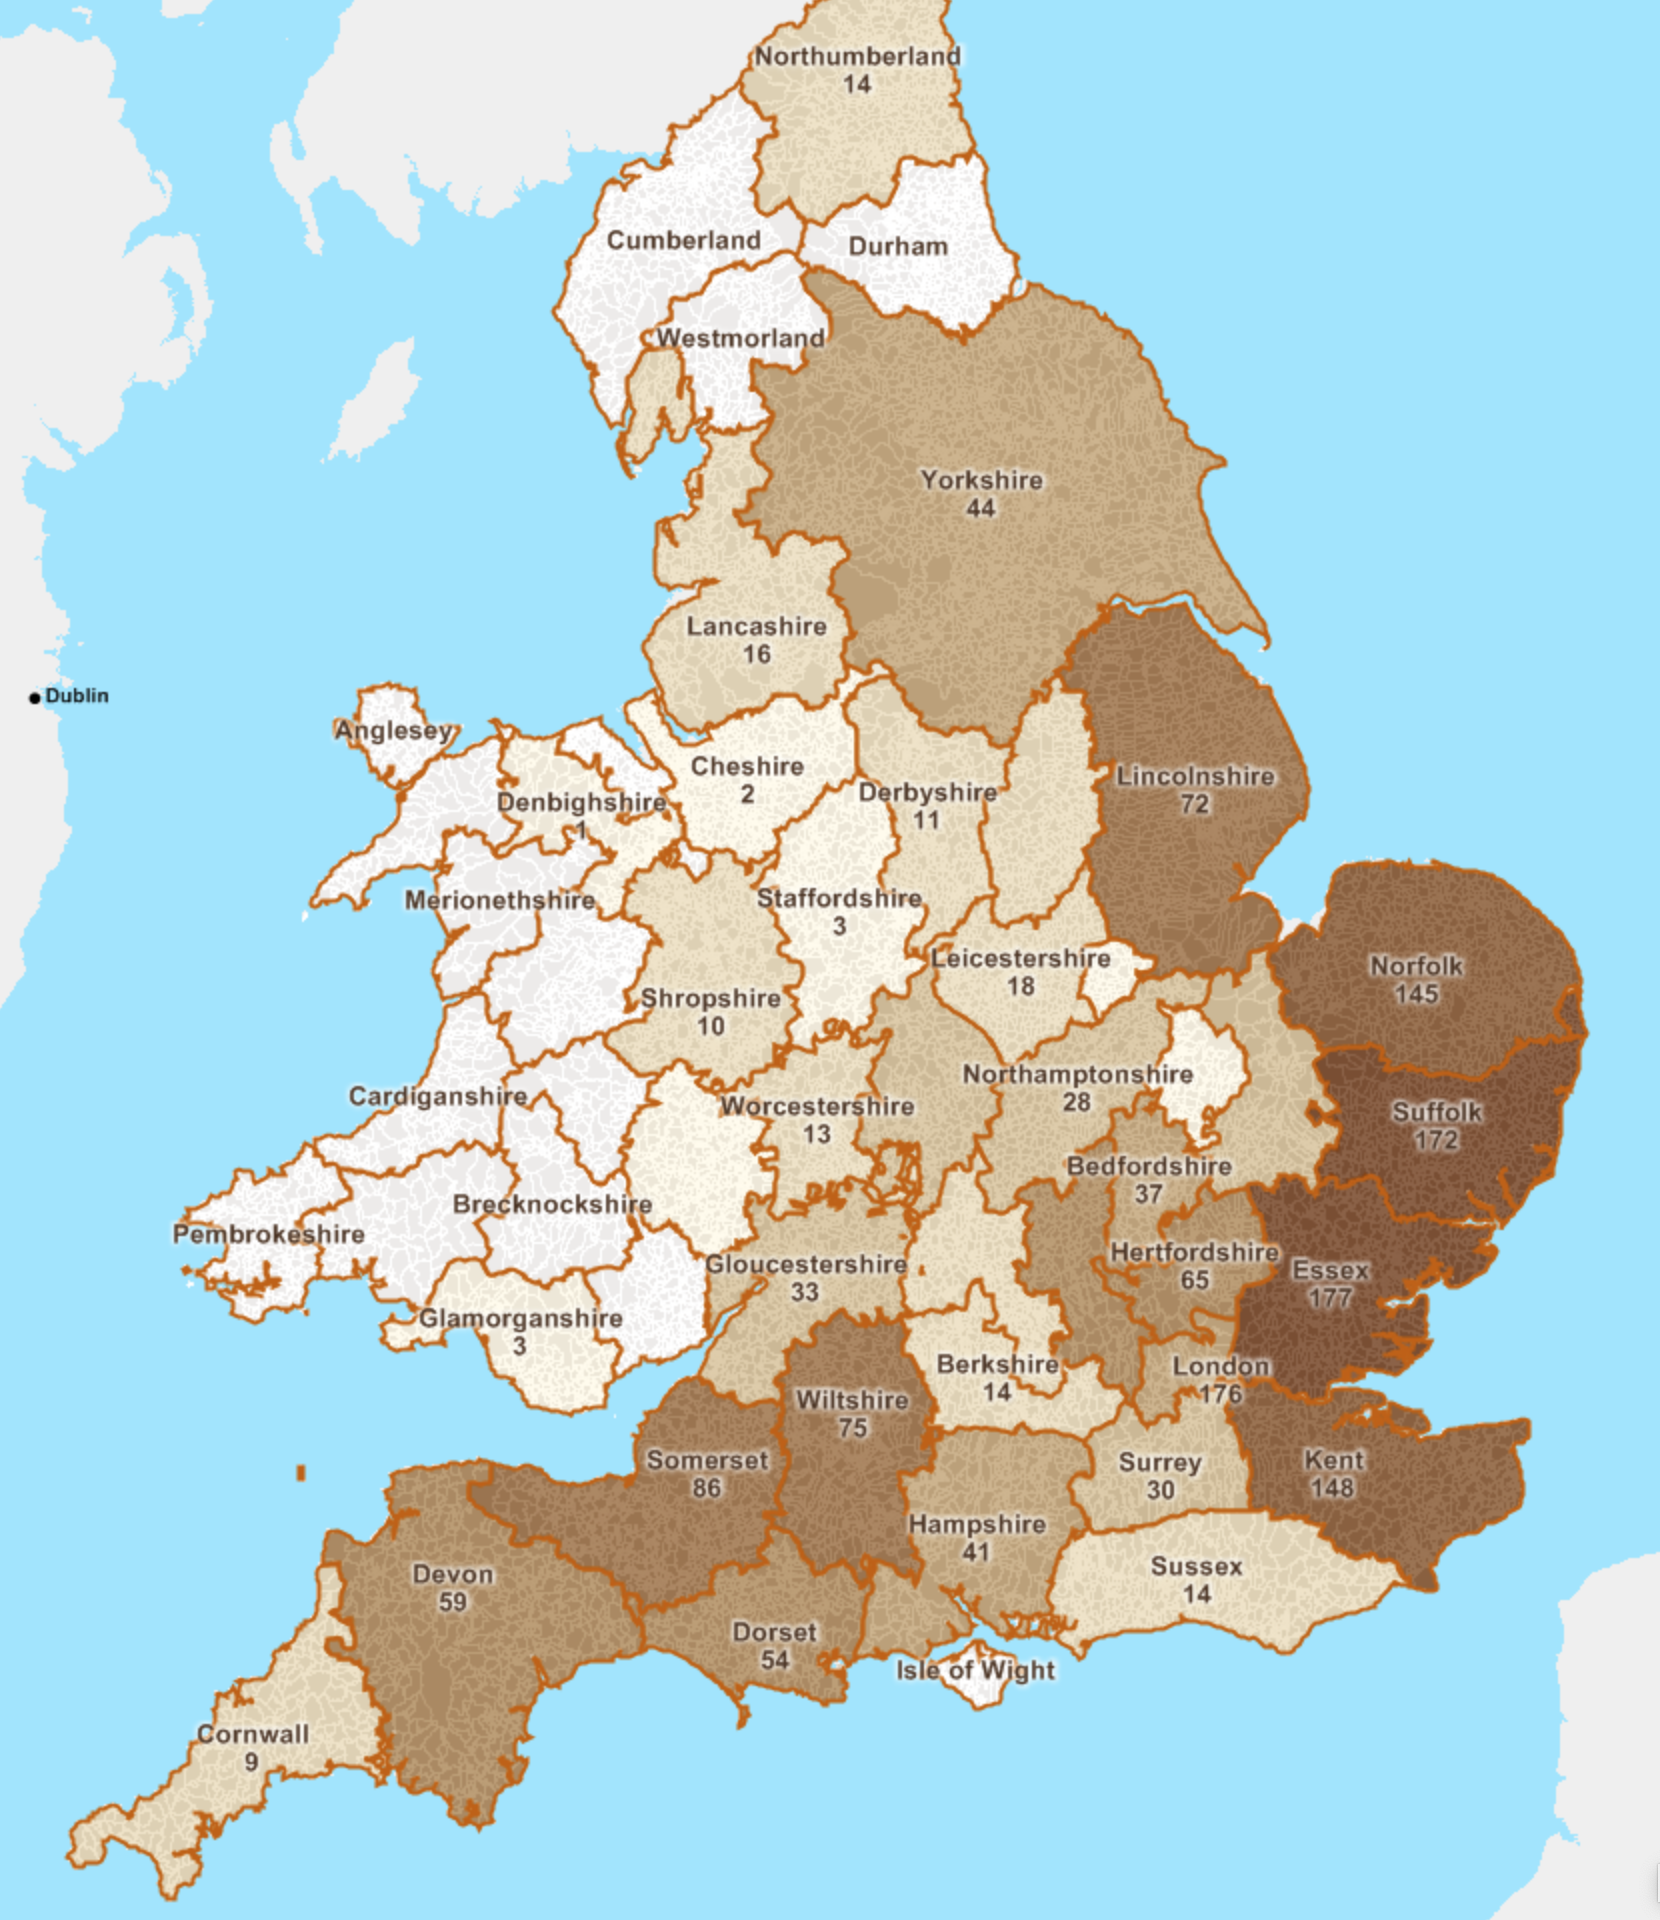
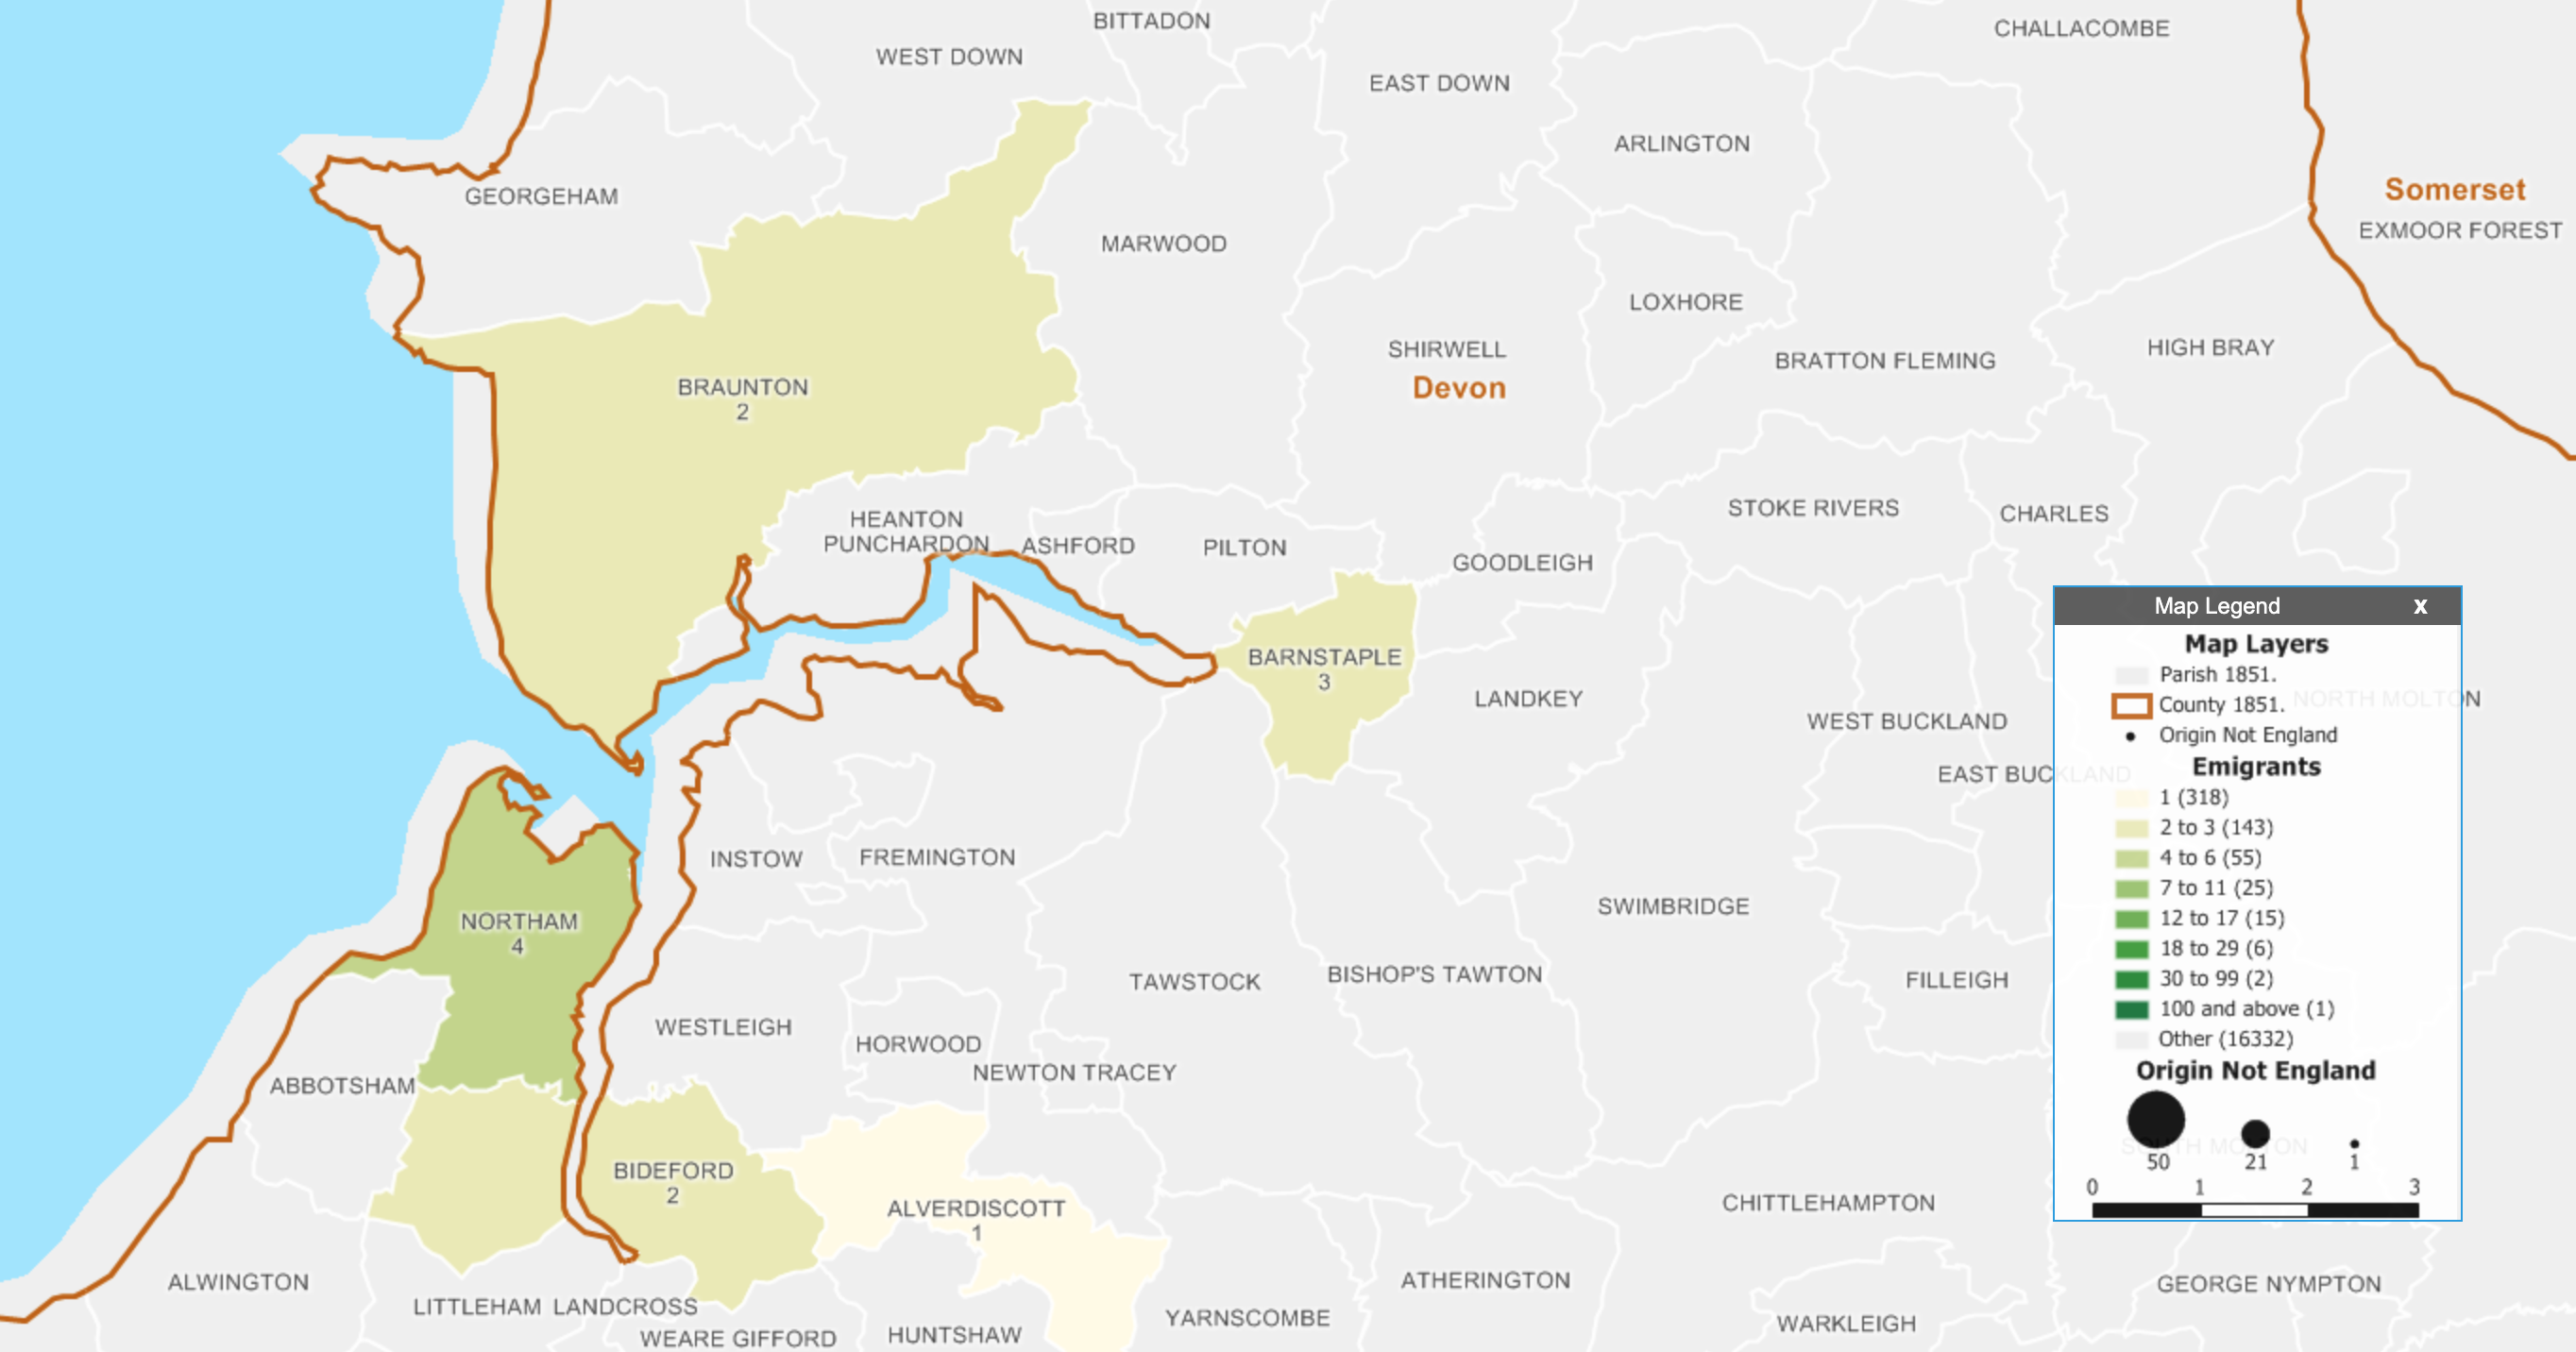
New England kept fantastic records and we know thousands of people. But we do not know whence everyone arrived, but we do know a few thousand. And this mapping project from American Ancestors attempts to capture that information at the English parish level. At its broadest level it is a county-level choropleth that shows, for those for whom we have the information, the majority of the migration, called the Great Migration, came from eastern England, with a few from the southwest.

Quite a few from Norfolk, Suffolk, and Essex

You can also search for specific people, in which case it brings into focus the county and the parishes within that have more detail. In this case I searched for my ancestor Matthew Allyn, who was one of the founders of Hartford, Connecticut. He came from Braunton in Devon and consequently appears as one of the two people connected to that parish.

Devon did not have nearly as many people emigrate as the eastern counties

But was Thomas related to Matthew? We don't know.
But was Thomas related to Matthew? We don’t know.

Overall, it’s a nice way of combining data visualisation and my interest/hobby of genealogy. The map uses the historical boundaries of parishes prior to 1851, which is important given how boundaries are likely to change over the centuries.

This will be a nice tool for those interested in genealogy and that have ancestors that can be traced back to England. I might be biased, but I really like it.

Credit for the piece goes to Robert Charles Anderson, Giovanni Flammia, Peter H. Van Demark.

My Family Shrub?

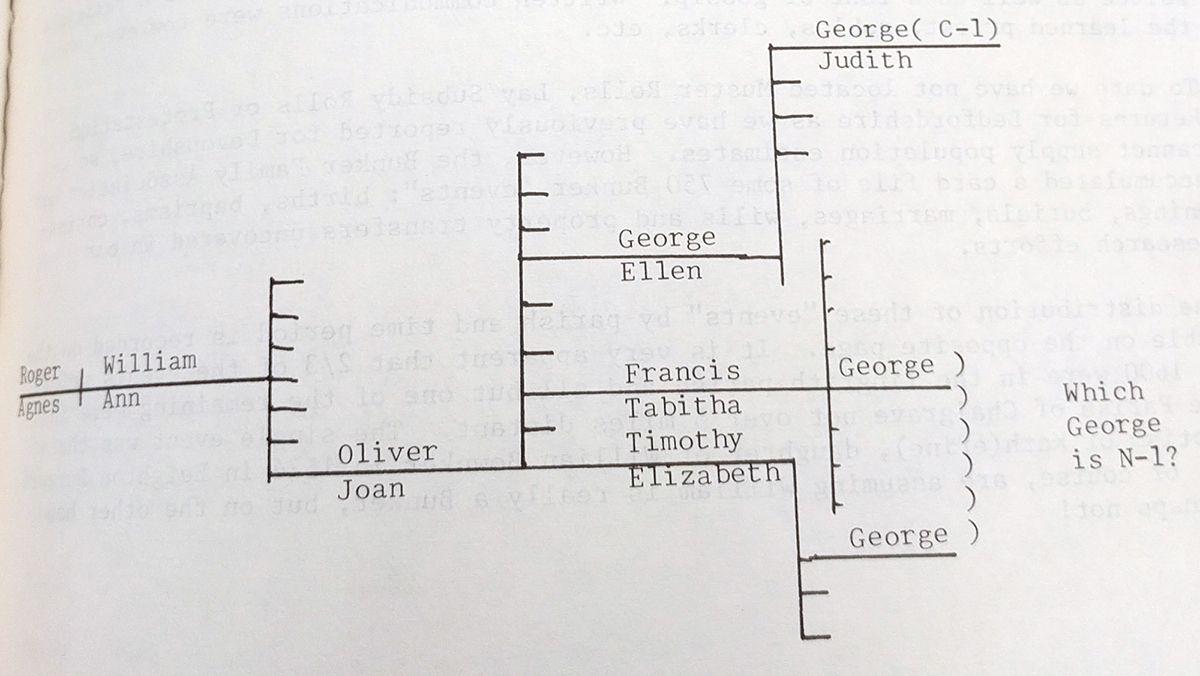
One of the main objectives of my long weekend in Boston is to research my family history. Usually when you do that kind of research you see familiar visualisation forms: trees. And in this book on a New England ancestral family, I saw trees. But the problem is history is never as neat and clean as we would prefer it to be. Or at least as I would prefer it to be. And this is the tree I discovered for my ancestor George, the guy labelled N-1.

People need to stop naming their kids the same old names. It can make my research a pain in the arse.

Normally family trees are direct lines of descent. But here the problem is that the current research cannot clearly state who the parents are of George. He can be one of two Georges, one the son of Francis and Tabitha and the other of Timothy and Elizabeth. So instead of a single trunk, we have more of a shrub-like set of parallel branches with lots of leaves.

But what I really liked about this graphic is that, one, it appears to have been made by being typeset on a typewriter instead of some fancy design software (the book was printed in 1984). And then for the researcher like me, the author took care to remove the names of people inconsequential for this particular line of enquiry. It shows the Georges of interest, including the known cousin labelled as C-1, and their parents but omits siblings. It is a very nice touch. (And made my life easier.)

Credit for the piece goes to Henry L. Bunker.

Gowanus, Brooklyn

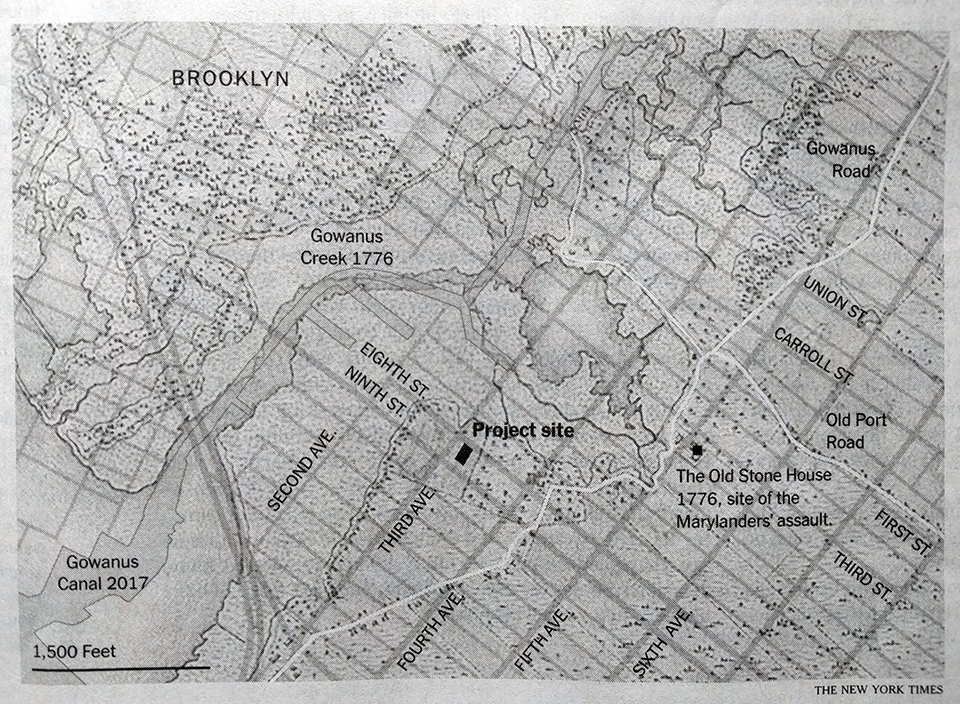
This past weekend I was reading an article in the New York Times about how a diary from the 19th century may indicate a plot in Gowanus Brooklyn destined for development may contain an old slave burial ground. You may recall how this author’s hobbies include genealogy and family history—how I would love to find a 19th century diary. Then, given this interest and the article, it was fantastic to find a map in the article.

Brooklyn in black and white

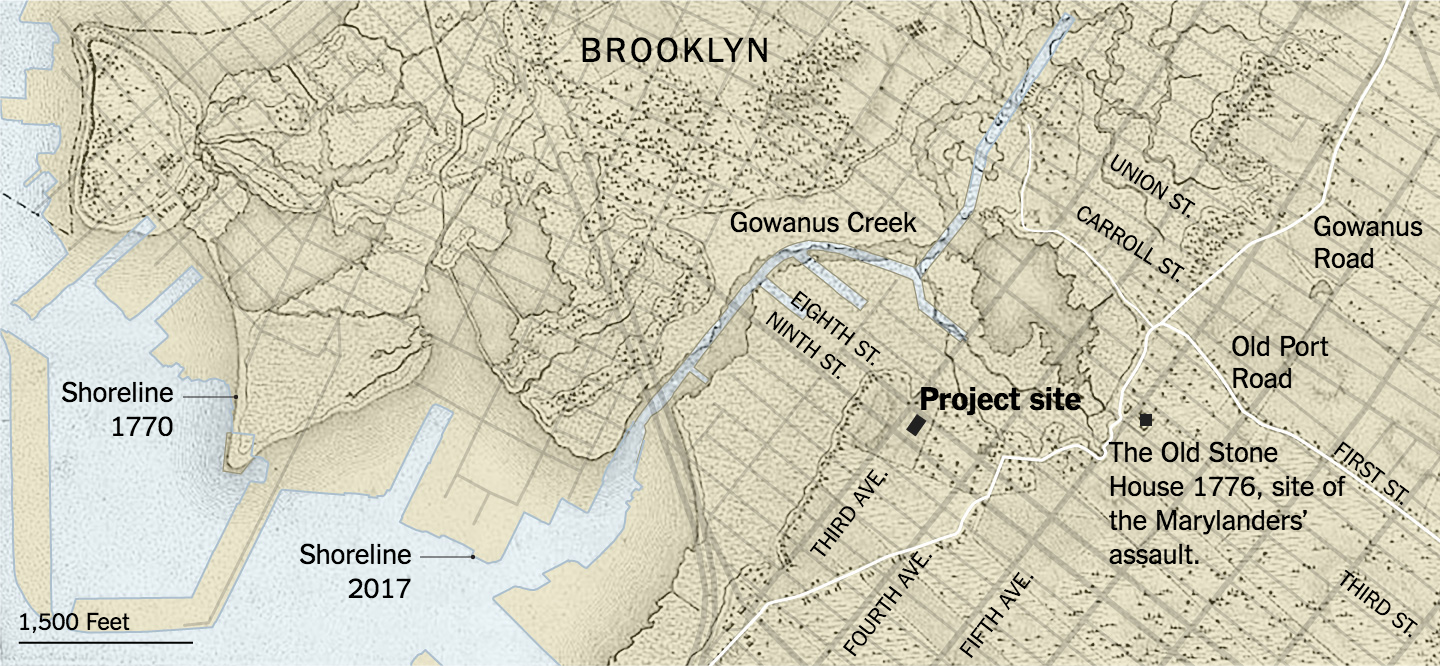
Suffice it to say the map held my fascination for long enough that I saved the paper to post about it today. I was curious about two things, however, one, did the graphic have a credited author—it did not in the print edition—and two, was there a neat interactive version in the online version? The online version is simply a colour version of the map.

Brooklyn, now in colour

But the colour version does one thing that really helps make the graphic complete. In the print edition, there is no clear idea what the different layers are and it did take me a moment or two to understand the overlay. But the online version calls out specifically the map of the area from two different time periods.

Maps like these are my favourite. They blend history and the present. After all the places we live have often been lived in for centuries and they bear the marks of that inhabitance.

As to the first question, credit for the piece goes to Joe Burgess.

The Spellecy’s Wisconsin Land Grant

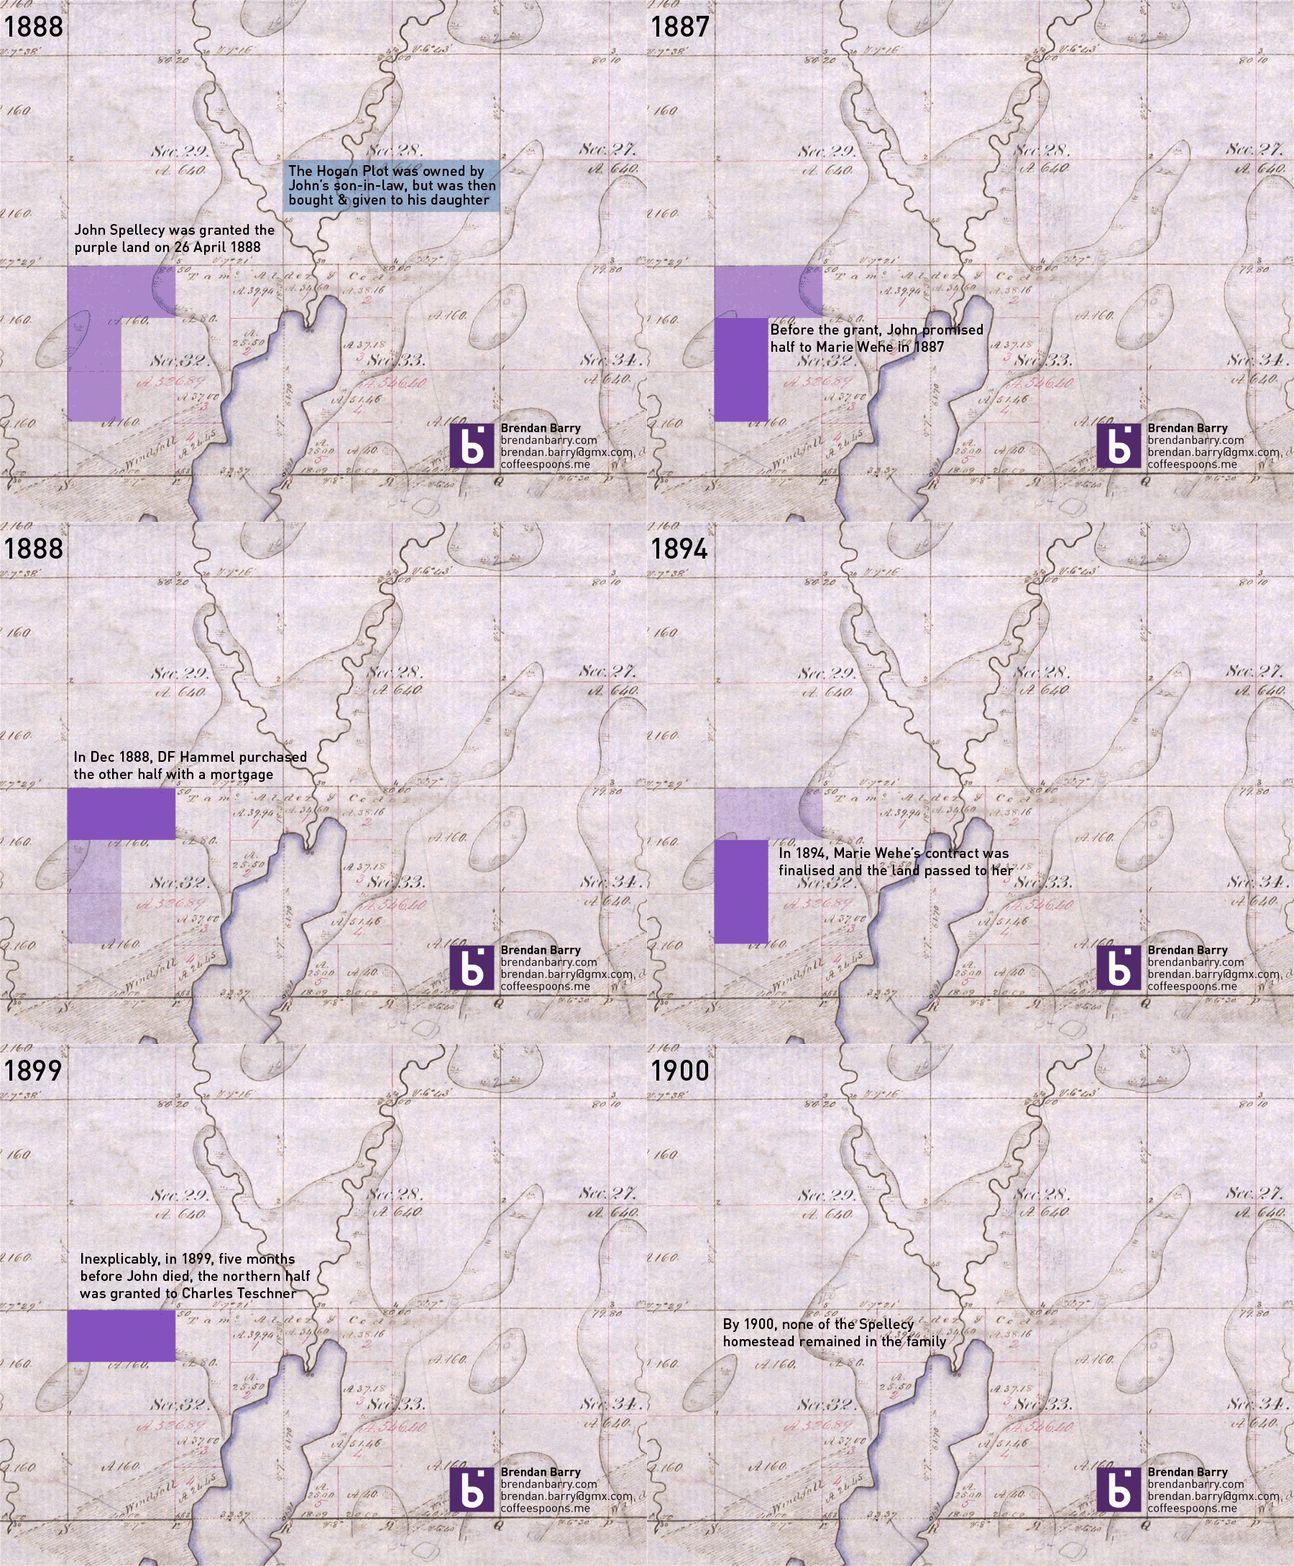
I have returned from my trip up north to Minnesota and Wisconsin. Unfortunately, from the research side it was not the most successful of trips. I did find some records, but none that answered any of the big questions I had. If anything, I now have far more questions. Most of the information I learned deals with the homesteaded land that John Spellecy received in 1888, at the young age of 70. It turns out by the time he was given the land by the US government, he had already made one contract to sell a portion of it. And so to make some semblance of it, I made this animation to show how the land grant disappeared over only a 12 year period.

How the Spellecy plot disappeared

For the curious, the background image is a digitisation of the US government’s original land survey. The A.160 denotes 160 acres, the maximum allowed by a homestead claim.

Researching the Family History in Ashland, Wisconsin

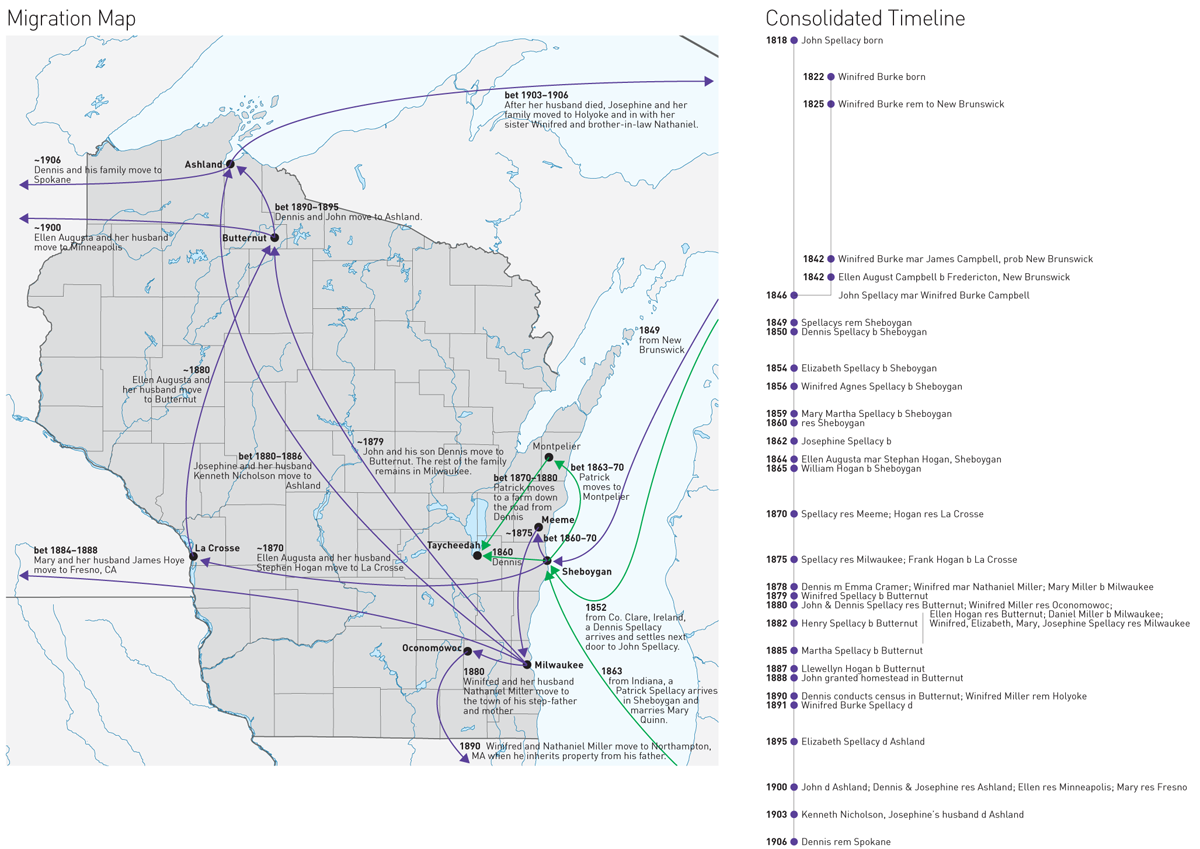
I’m presently off in the northern reaches of Wisconsin, Ashland in particular, researching part of my family’s history. To aid me in understanding just how this frontier-following family moved over one century, I put together a crude map and a timeline to give me context (and jog my memory) while searching through files in the courthouse.

The movements of the Spellacy family

I am calling the map a migration map. It shows the locations where family members moved to in 1849: Sheboygan (from New Brunswick, Canada). And then how they quickly began to disperse, but slowly head north to Ashland County, before most ultimately headed to the West Coast. (My direct ancestors are that group near the bottom that move back to the in-laws original home of western Massachusetts.)

What I struggle with keeping in mind is that here we are looking at a perfectly rendered and understood map of modern Wisconsin. But in 1849, the state was but one year old and most of the towns to which this family would be going were only a decade or so old and still very much frontier towns without amenities. (Which is why I imagine the women of the family stayed in Milwaukee until the settlements in the north were, well, settled.)

To the right is a timeline. The details are not terribly important and in fact it is poorly designed. But, it was quick to make and will hopefully help me keep the names straight and the places for which I am looking top-of-mind.

Put the two together and you have an example of how I create visualisations for myself just to help me with my own work and research.