One of the things I have been following closely the last few months has been the protests in Hong Kong. The city is one of China’s few Special Administrative Regions—basically the former British colony of Hong Kong and the former Portuguese colony of Macau, two cities bordering mainland China and separated by the Pearl River estuary.
Long story short, but since 1997 Hong Kong should enjoy 50 years of a legal system that is more aligned to that of its former status of a British colony than that of mainland China. But increasingly since Xi Jinping took power, he has been eroding those rights and the youth of Hong Kong have taken to the streets to protest, a right they enjoy but not the rest of mainland Chinese.
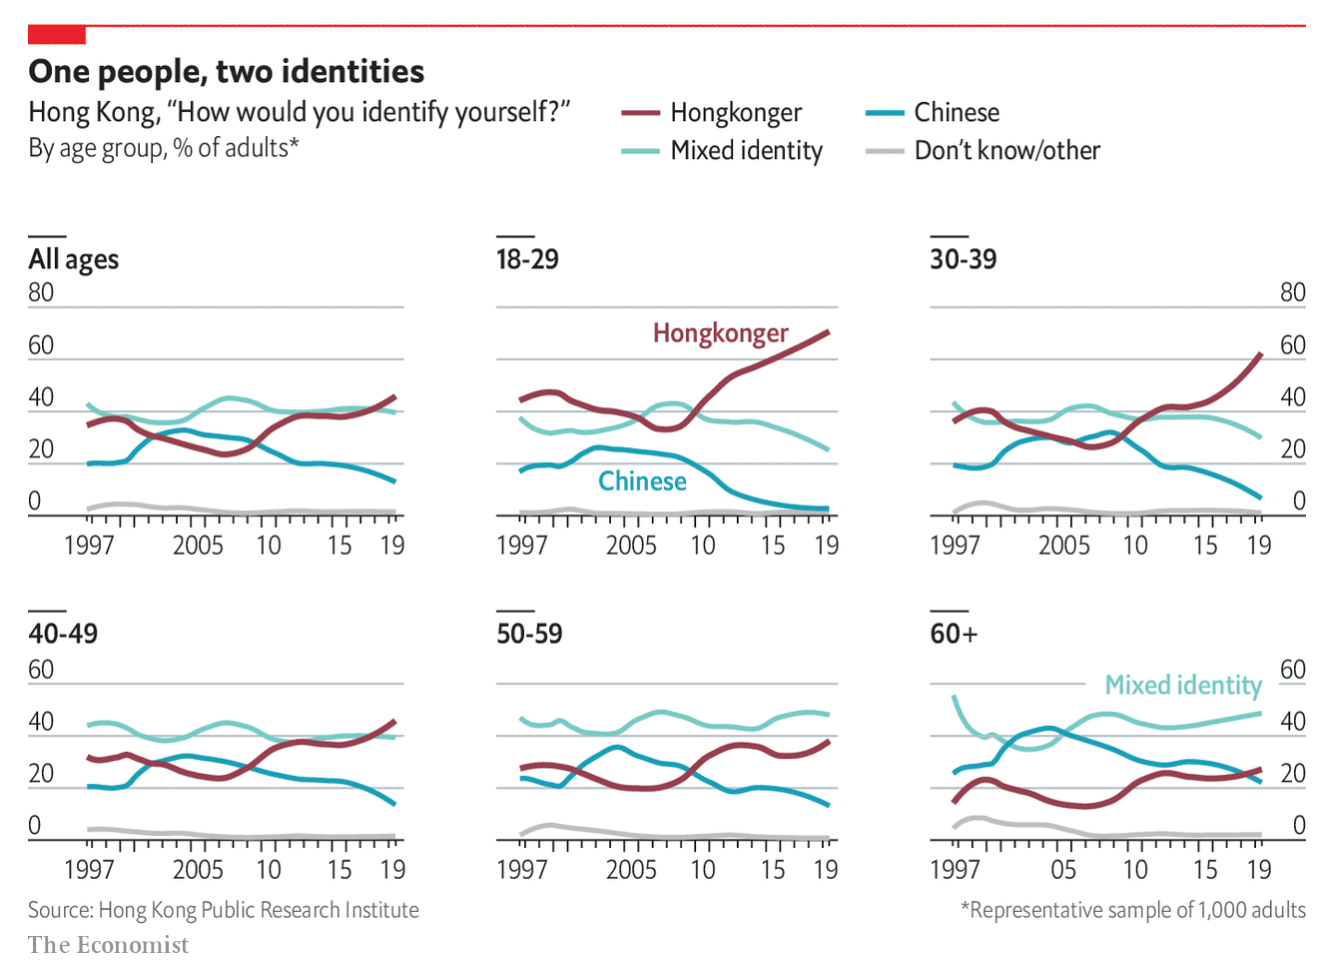
And so we have a survey looking at the identity by which those people living in Hong Kong choose to identify.
And it’s not Chinese.

From a news perspective, this poses problems for a Beijing-based Chinese government that is making pains to promote a greater Chinese identity throughout the world, least of all by pushing for a reunification with Taiwan by force if necessary. A generation of several million Hong Kongers and the way they raise their children, in addition to their friends and supporters abroad, weakens the authority of Beijing.
Hence the threat of a Tiananmen Square style crackdown on Hong Konger protestors.
Alas, the United States has been far more concerned with its trade dispute than it has been the democratic and human rights of several million people. At least, that is the impression given by the White House.
But, as to the design, I do not love the spaghettification of the line charts. Though I do appreciate that the Hong Kong identity has been separated by the maroon-coloured line. I wonder if labelling the lines in the small multiples is necessary given the decision to include the legend at the top of the chart.
The other tricky thing with this type of chart is that the data series is a population cohort. And yet the data is based on a time series. And so the cohorts vary over time. It might not be entirely clear to the audience that this (appears to be)/is a sample of people of an age at a particular date. How do those people change over the years? It’s hard to see that trend by separating out the data.
Overall, it’s a solid piece. And it’s important given the gravity of the protests in Hong Kong.
Credit for the piece goes to the Economist Data team.


