This Is Not My Populous State

With the release of the 2020 US Census’ topline data, we can see which state populations increased and which few decreased. And in that we can sort, or resort, states by population. The Washington Post did this a few weeks ago with an interactive ranking chart in a nice online article. (I’d be curious what the print version was, alas I only receive the New York Times.)

The piece begins with a nice intro motion graphic that selects states and shows how their ranking among the other states (plus the District of Columbia, DC), has evolved since 1920.
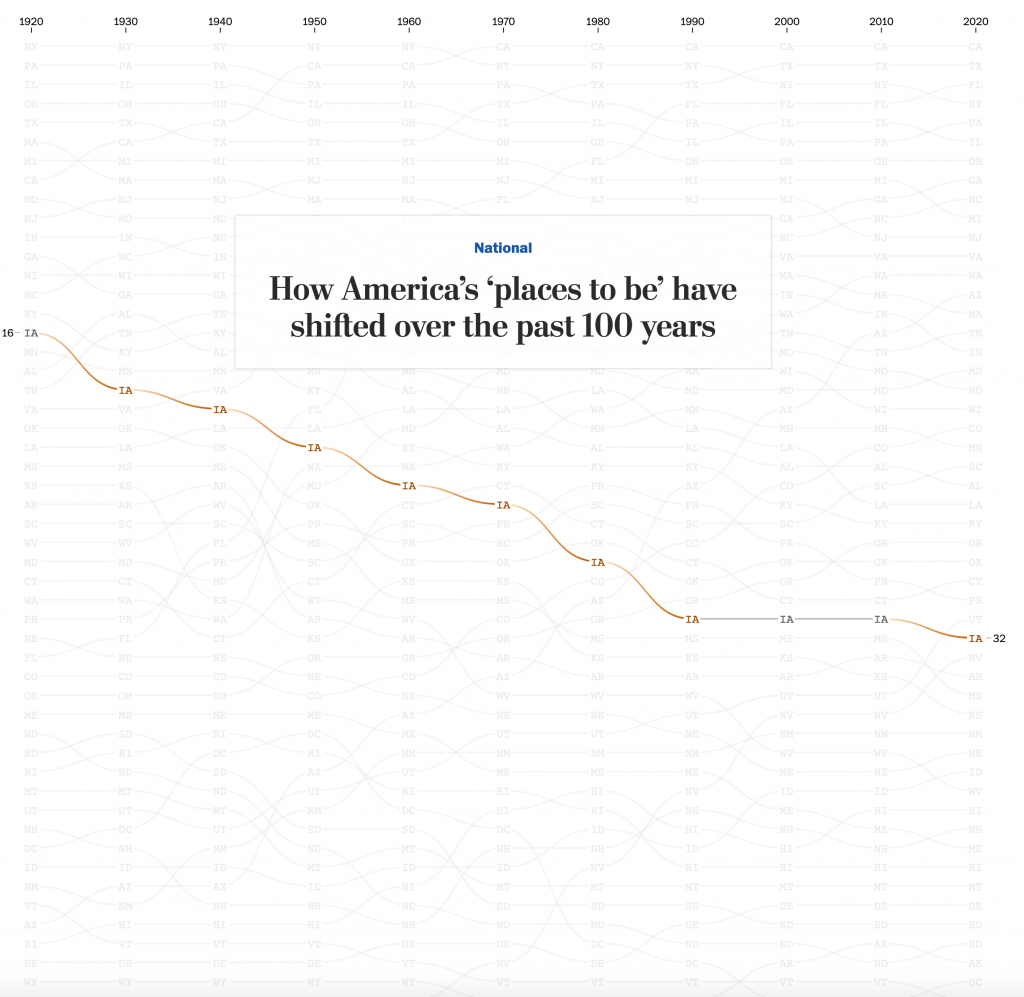
Here we see the fall of Iowa in the rankings.

After scrolling down briefly, the reader enters a portion of the story displayed by keeping the hero graphic static whilst blurbs of texts scroll over the lines. As the blurbs move past, different states or sets of states become highlighted to draw attention to them.
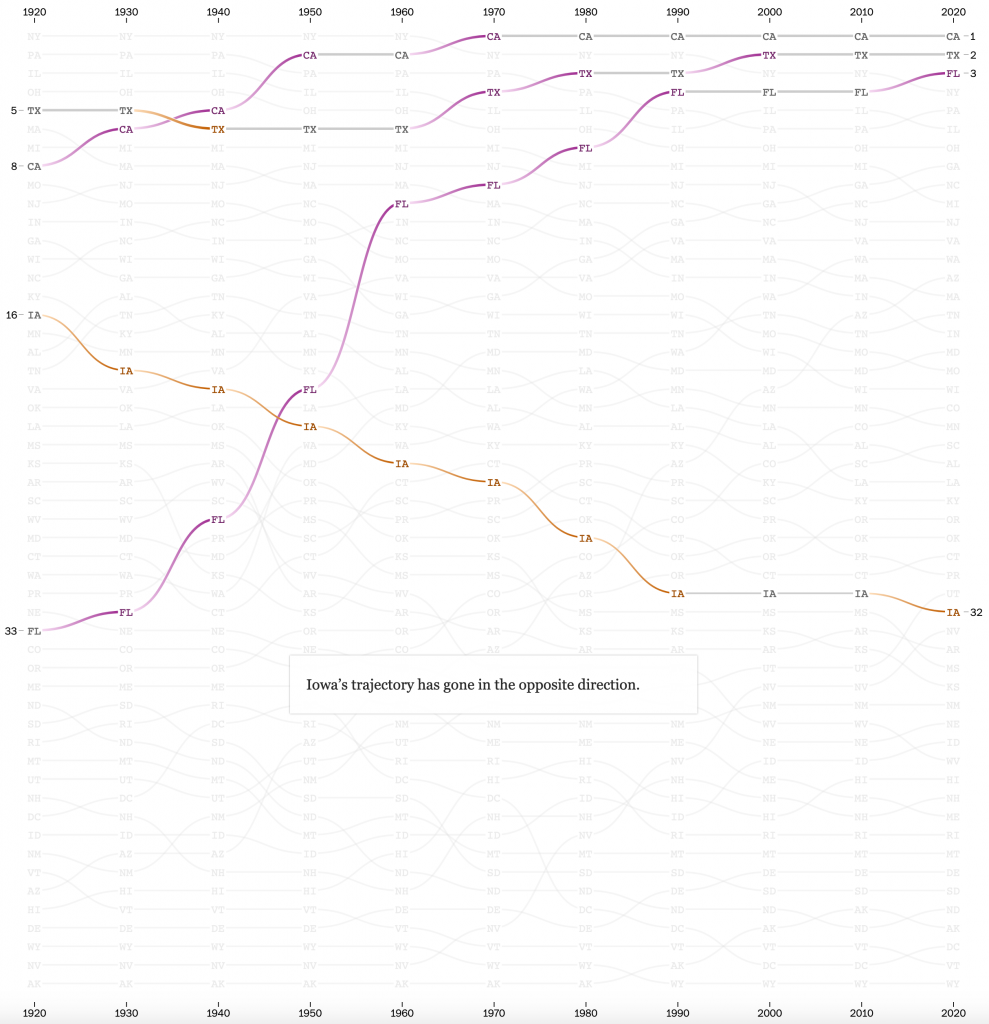
I guess I’m picking on Iowa?

This works really well. When discussing the case of Iowa vis-a-vis the growth of California, Texas, and Florida, I don’t need to see the story of Nebraska. Especially as the end of the piece features this hero graphic as an interactive, explore-the-data piece of content. I don’t have a screenshot of that, because it’s really just the above two but with a dropdown selector and a legend.

As the user scrolls through the story, they move past the semi-motion graphic and into a text-driven narrative for each region of the United States. I’ve highlighted only the Northeast, where I was born, raised, and presently live. As an aside, I remember my family completing the 2000 Census around the kitchen table. The 2010 Census I filled out at a small desk not long after I moved into my second flat in Chicago. And this most recent one I completed whilst under quarantine here in Philadelphia.
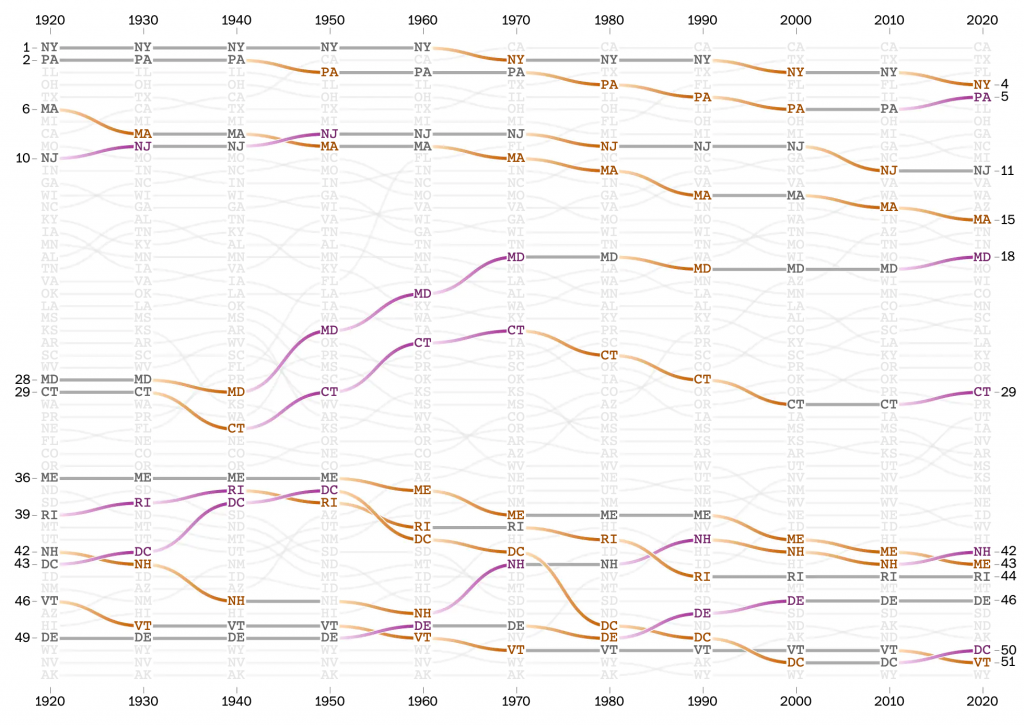
The Northeast. Definitely not Iowa.

This section of the article uses static images with the region’s constituent states highlighted. Again, this works really well, because when looking at the Northeast, I’m still not interested in Nebraska. And also again, we have the interactive explorer at the end of the article.

Overall this is a really strong piece from the Post. I have some quibbles with the design, primarily I don’t understand the function of the connecting lines’ fades and curves. But I find neither too terribly distracting from the content of the graphic.

Credit for the piece goes to Harry Stevens and Nick Kirkpatrick.

More Pub Trivia Scores

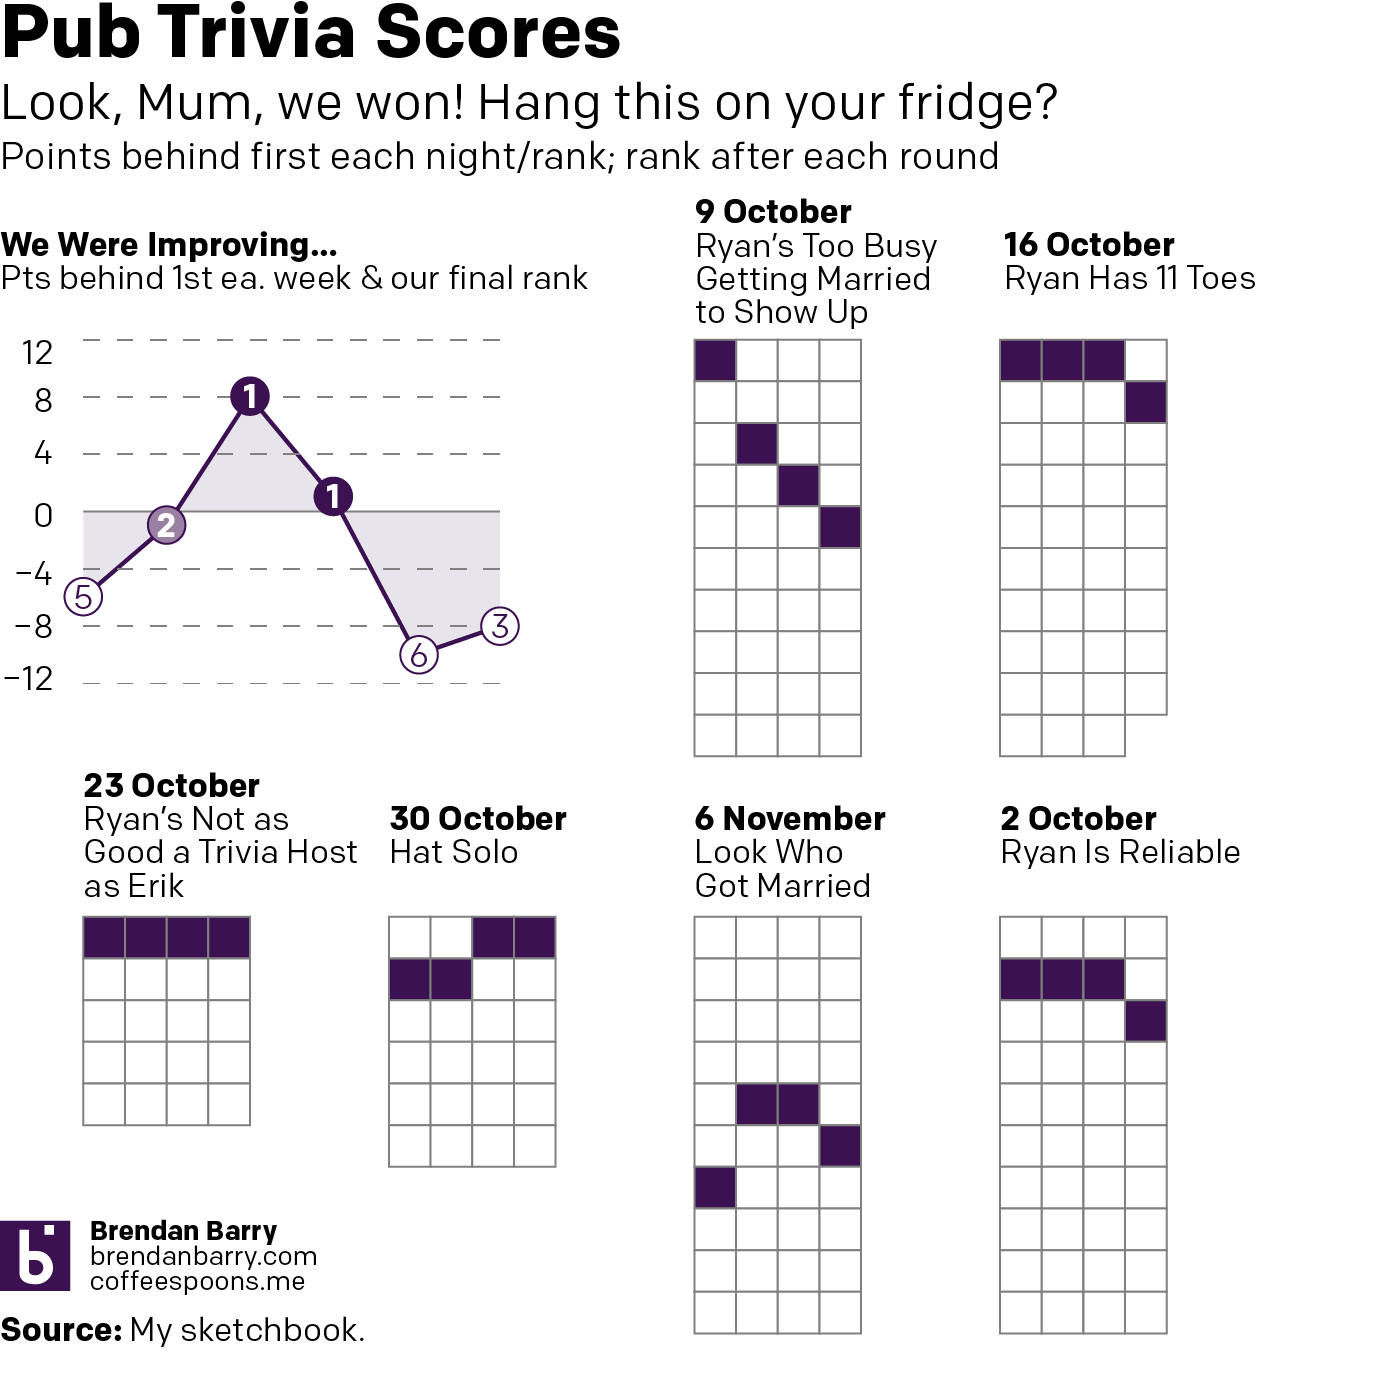
Next week is Thanksgiving and for me that means no pub trivia next week. So ahead of a two-week gap, here are our latest (and greatest?) in trivia scores. We won some, we lost some. And we definitely blew some. The key, as always, remains score points before music. Because we do not know music.

At best an unsteady performance…

Credit for this piece goes to me.

Pub Trivia Scores—The Ryan’s Wedding Version

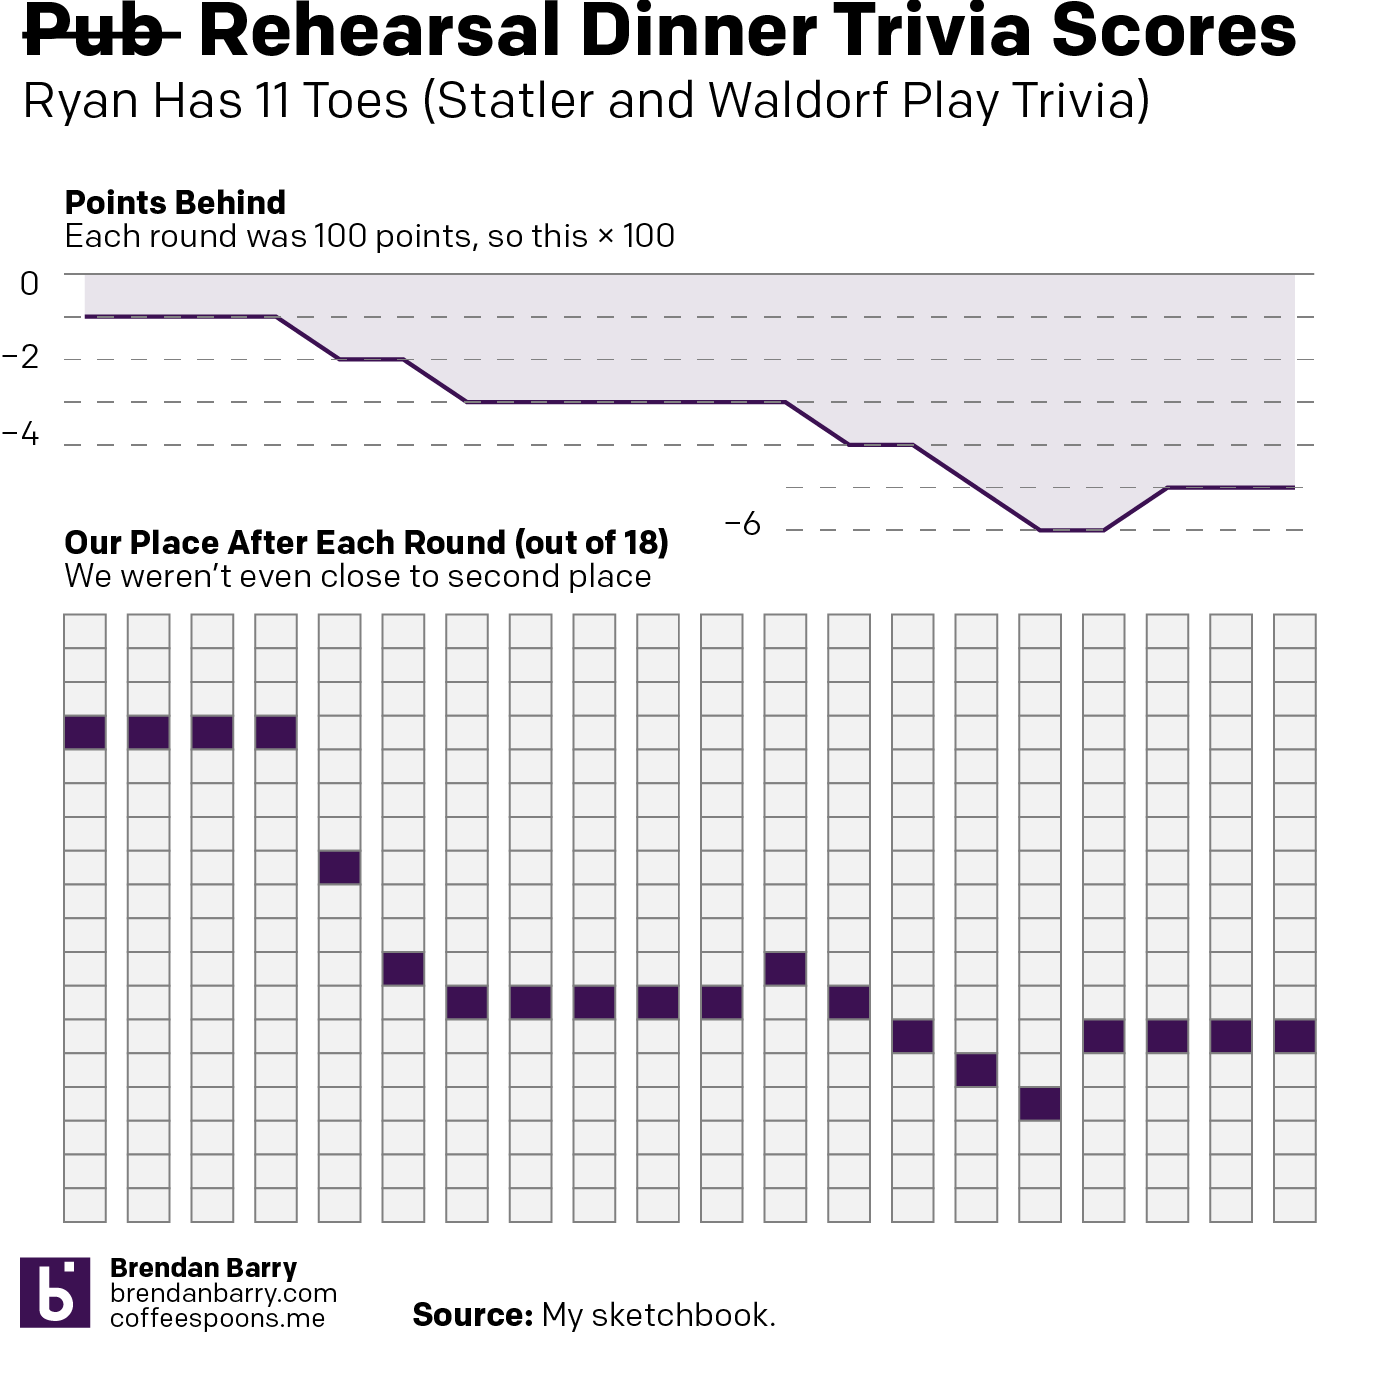
So another Wednesday, another pub trivia night. But two weekends ago, I attended the wedding of a good mate of mine down in Austin, Texas. And at his rehearsal/welcome dinner, he and his now wife had a trivia game. How well did their guests know them?

Turns out my friends and I, not so much. And I can prove it, because I documented our score after every round in my sketchbook.

Somewhere towards the middle we just started picking the most ridiculous answers.

Credit for this one is mine.

Back to Being Runnerup

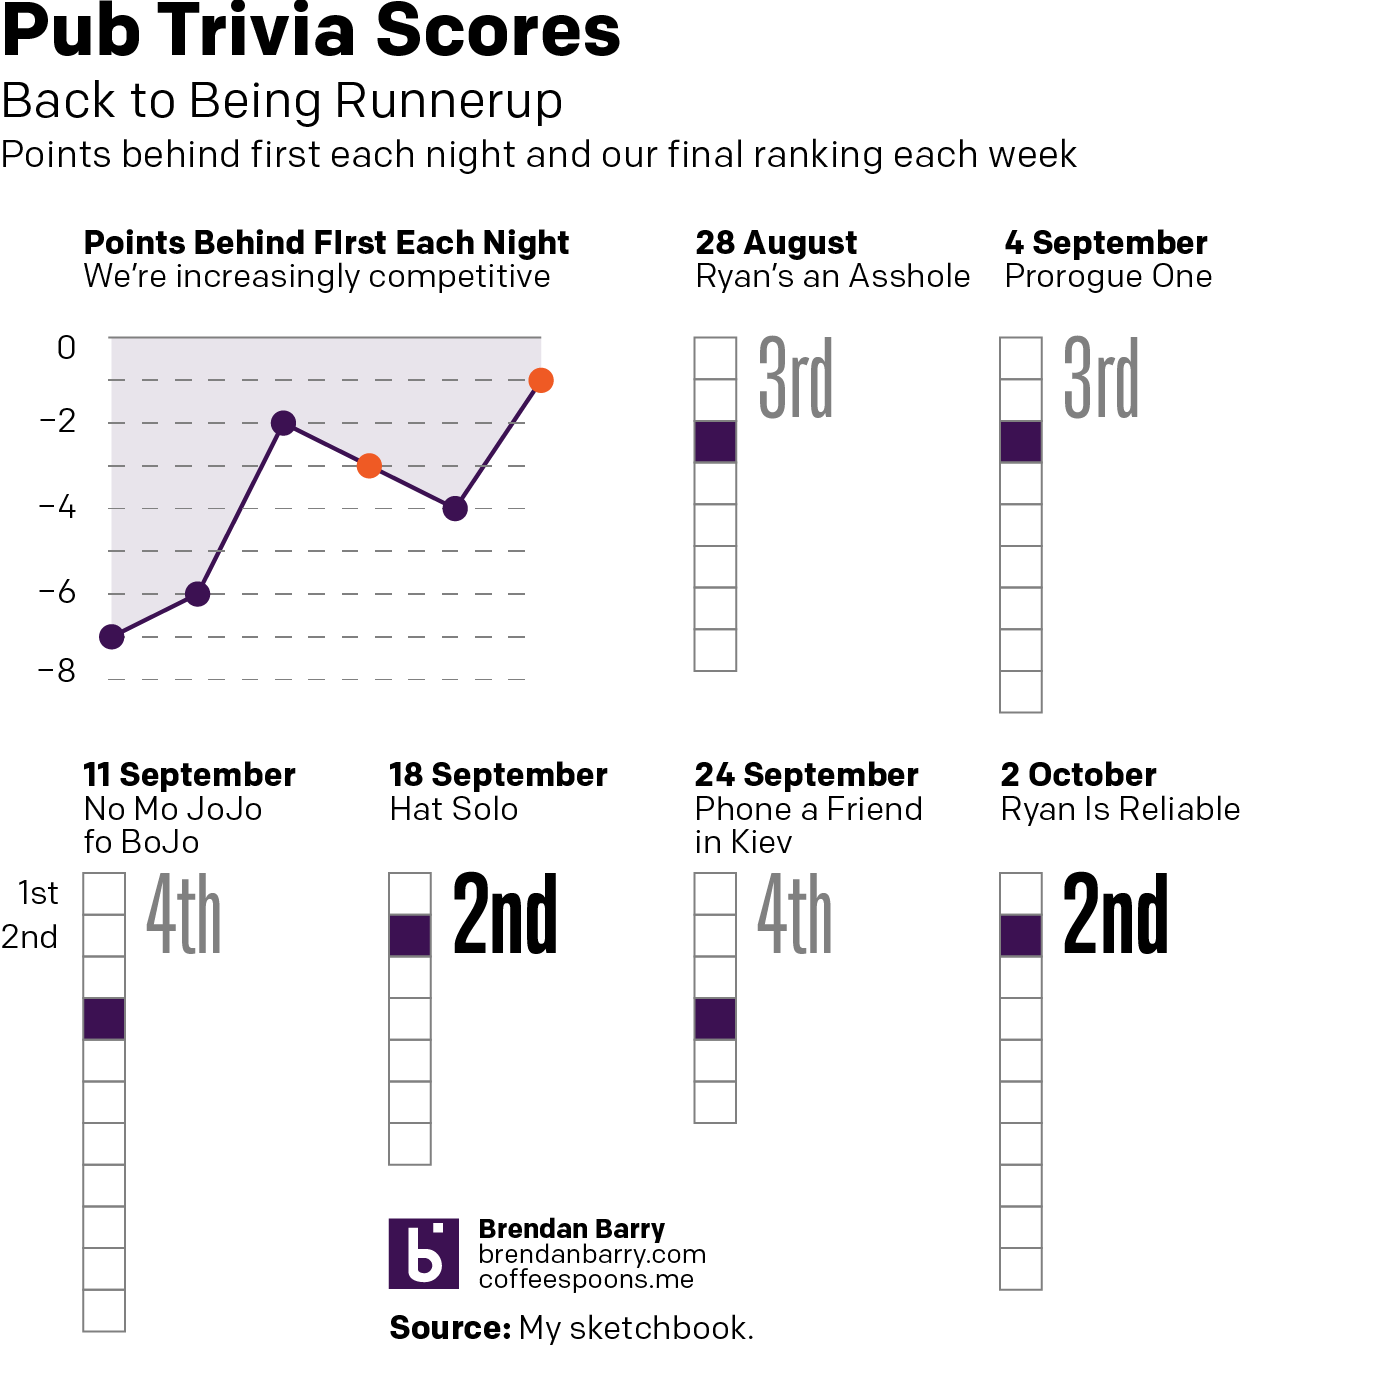
Another week, another Wednesday, another night of pub trivia tonight. So after several weeks of disappointing scores and placement, the last few weeks has seen us triumphantly returning to second place. And so what better way to show that than showing our rank at the end of each night.

Consistently second.

More encouragingly, as the line chart shows, we’ve been becoming more competitive. Our number of points behind the first place team has been dropping. Last week, for example, we were only one point off from first place.

Credit for this is mine.

Britain Bombing in Eurovision

Last weekend was not only the Game of Thrones finale, but also the Eurovision final. For the Americans not familiar with it, it’s a part music, part theatrics competition between all European countries and then sometimes guest countries like Australia or Israel. The winner is chosen by the total number of points their act receives. The UK, as one of the largest countries in Europe, is one of the few countries that is guaranteed a spot.

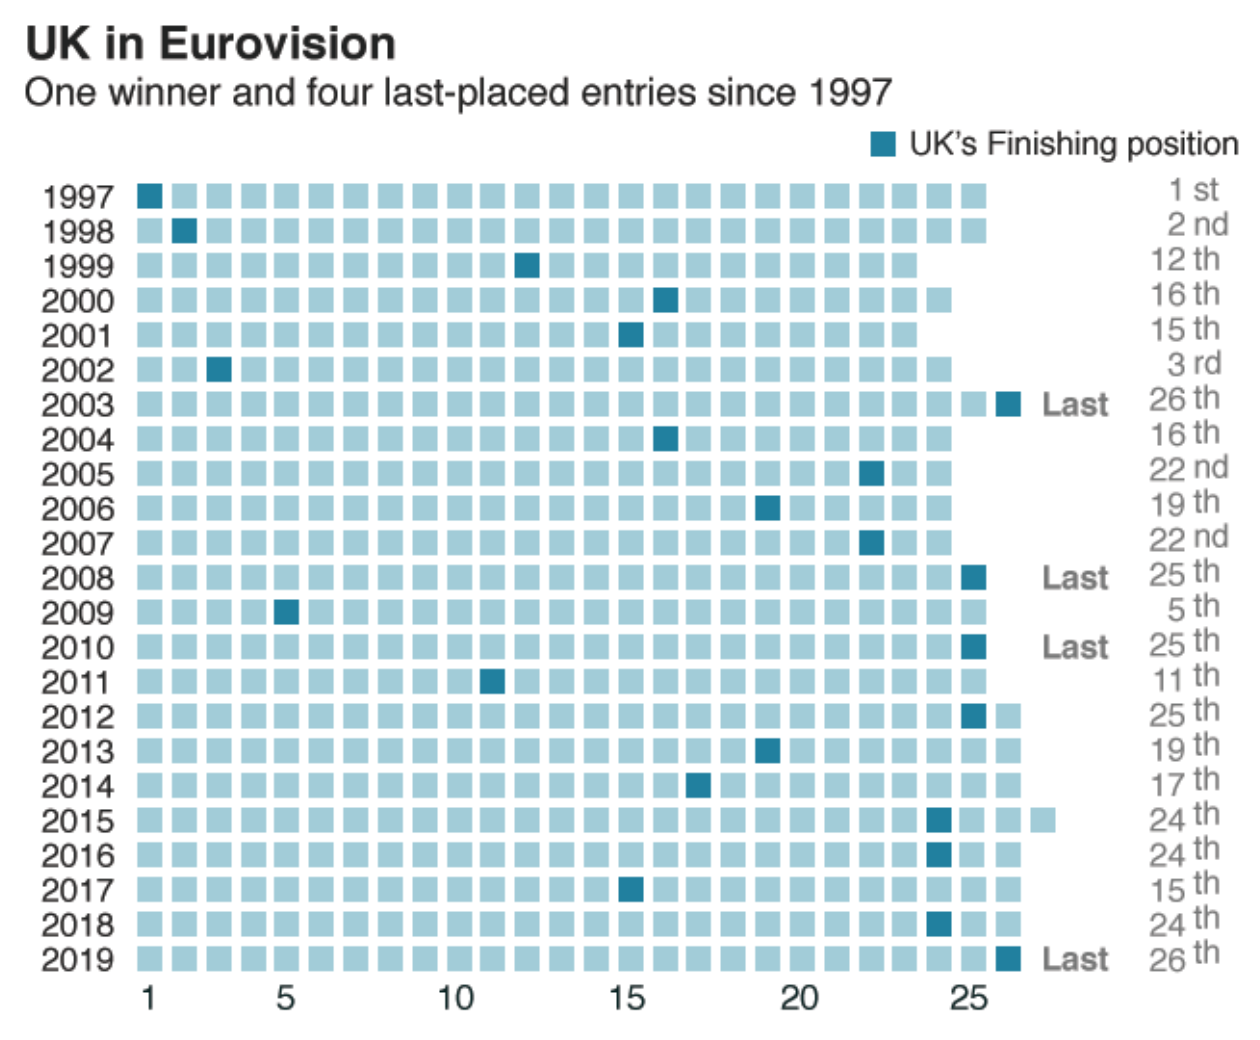
But that doesn’t mean the UK performs well. Last weekend, the UK bombed. The winner, the Netherlands, scored 498 points. The UK? 11. But the UK has been terrible for years now. And unlike in American baseball, it’s not because tanking gets you coveted draft picks for new talent. The BBC charted the placement of the British entries since its last win in 1997, the height of Cool Britannia.

Consistently bad over the last several years

Design wise, I wonder about the horizontal movement of places. A top-to-bottom movement might make more sense. The labelling here is also a bit too much. My eye immediately settles on the black text for the years, as their tight spacing creates a dark field that overpowers the otherwise nice light blue–dark blue contrast in the graphic. Maybe the beginning and end years could have been labelled with some key intervals, say every five years?

Similarly, the use of the ordinal number over the cardinal on the right hand side puts more emphasis on the labelling than the graphic itself. Here, however, the designers wisely chose a grey for the text so as not to overpower the graphic. But I wonder if the use of a cardinal number could have reduced the extra bits of text at the end and drive more focus to the graphic.

Overall, it’s a neat graphic. But I think a few small tweaks could improve the design. Unfortunately for the UK, they are more than just a few small tweaks away from winning Eurovision 2020.

Credit for the piece goes to the BBC graphics department.

Development Languages

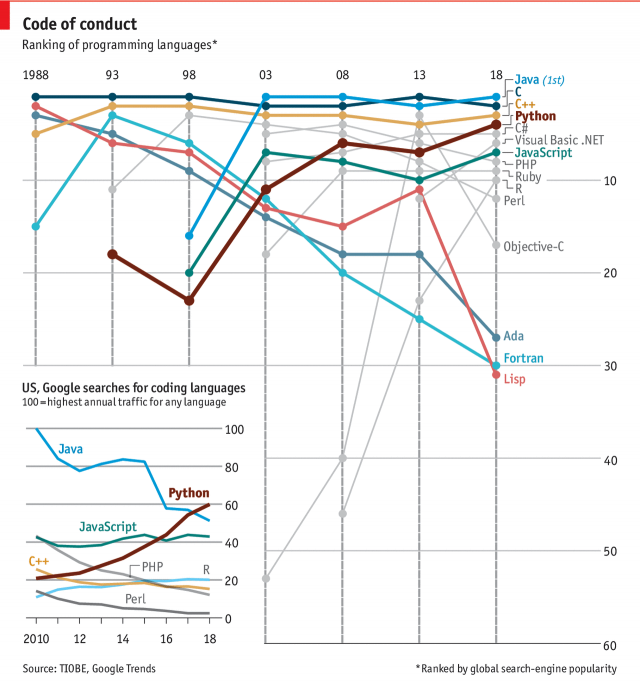
Last week the Economist published an article sort of about my industry. Now I am a designer and more familiar with the front-end design and some HTML and CSS, but a lot of the things I have designed over the last few years have needed some serious developers with some serious skills. And those guys were the ones who would truly understand this graphic, which looks at the popularity of Python relative to other languages like C++, Java, Javascript, .NET, &c.

Python has certainly climbed in importance

I really like what the designers did here. First and foremost the key chart is a ranking chart showing the popularity of languages since 1988—Java and C have consistently been at the top. But other languages no longer relevant are not even shown. (Where are you, Actionscript?) Those that are both relevant and also mentioned are colour coded within the set.

But the truly nice thing is being able to use the empty space of the lower-left area of the chart to add some context. It shows the growth in Google searches since 2010 in searches for Python.

Bonus note, look at that rise in R since 2008.

Credit for the piece goes to the Economist Data Team.

What Will You Have

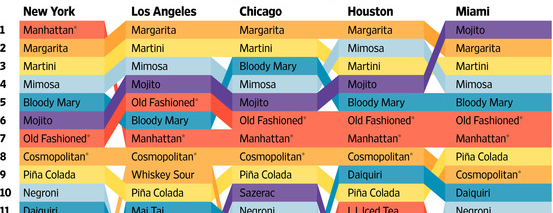
Now that it’s Friday, it’s time for happy hour drinks. Well, maybe not quite yet. Let’s get through the workday first. But over at the Wall Street Journal, together with Yep, they looked at which cocktails are most popular in eight cities based on Yelp reviews. They do note that the metric is not perfect as people will complain about Manhattan in a New York bar review but not actually drink a Manhattan. But, honestly, when you’ve had a few cocktails, the maths are bound to get a bit fuzzy.

A cropping for the top ten in half the cities

Of course the next step would be to make an interactive version with links to recipes. And from the visualisation side, you could cluster the data by drink bases. And no, the martini should not start with vodka. Come on, people, you use gin.

Credit for the piece goes to Rani Molla.

A Fishy Popularity Contest

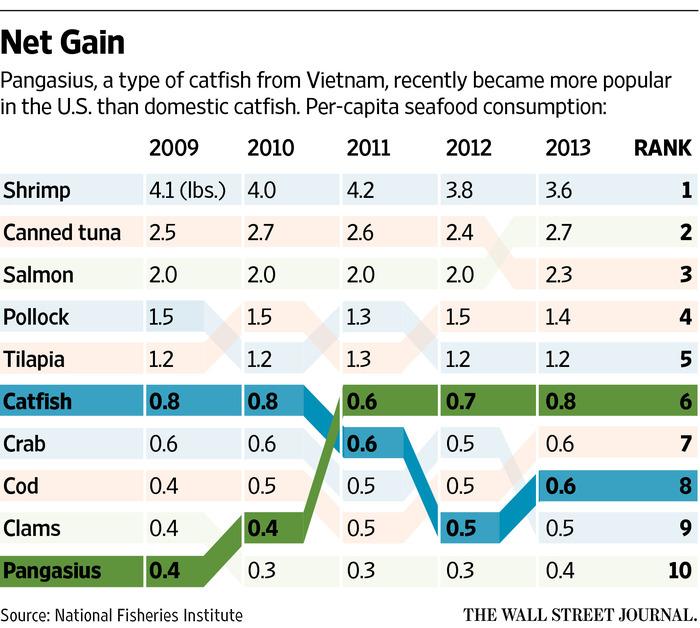
Pardon the title, but don’t mind the graphic. Sometimes ranking charts tell the story well. The Wall Street Journal has a graphic supporting a larger article about fish. And while I am not sure that I understand the reason behind the colours, they do make it quite clear that catfish is not nearly as popular as it used to be. Unfortunately the article is behind the pay wall, but broadly it appears that the fish on the move here might be banned from the US.

Fish ranking
Fish ranking

Credit for the piece goes to the Wall Street Journal graphics department.

Weekend Work

Here’s a rare weekend post to showcase some Olympic-related work.

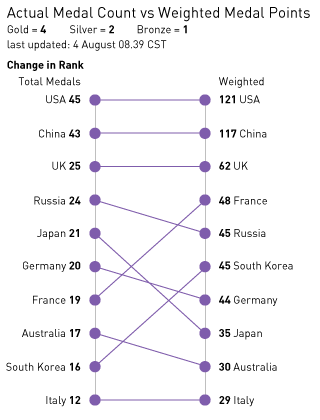
The following graphic looks at how the ranking changes for the Top-10 countries if medals are weighted. To me it is ridiculous that Kazakhstan is ranked higher than Russia because Kazakhstan has won 4 gold medals compared to Russia’s 3 when Kazakhstan has a total of 4 medals whereas Russia has 24. (All counts current as of this post.) So while I have been ranking countries according to their total medal count, what happens if I weight the gold and silver medals against the bronze?

It turns out that the leaders don’t change, but the rest of the Top-10 ranking gets shuffled a bit. For example, Japan has performed well at an overall level with 21 medals thus far. But only two of those have been gold medals and so its rank in the system below fell three positions.

Change in Rank for a Weighted Score