Olympic Recap/Retro

Every four years (or so) I have to confess that I think fondly back upon my former job, because I worked with a few wonderful colleagues of mine on some data about the Olympics. And the highlight was that we had a model to try and predict the number of medals won by the host country as we were curious about the idea of a host nation bump. In other words, do host countries witness an increase in their medal count relative to their performance in other Olympiads?

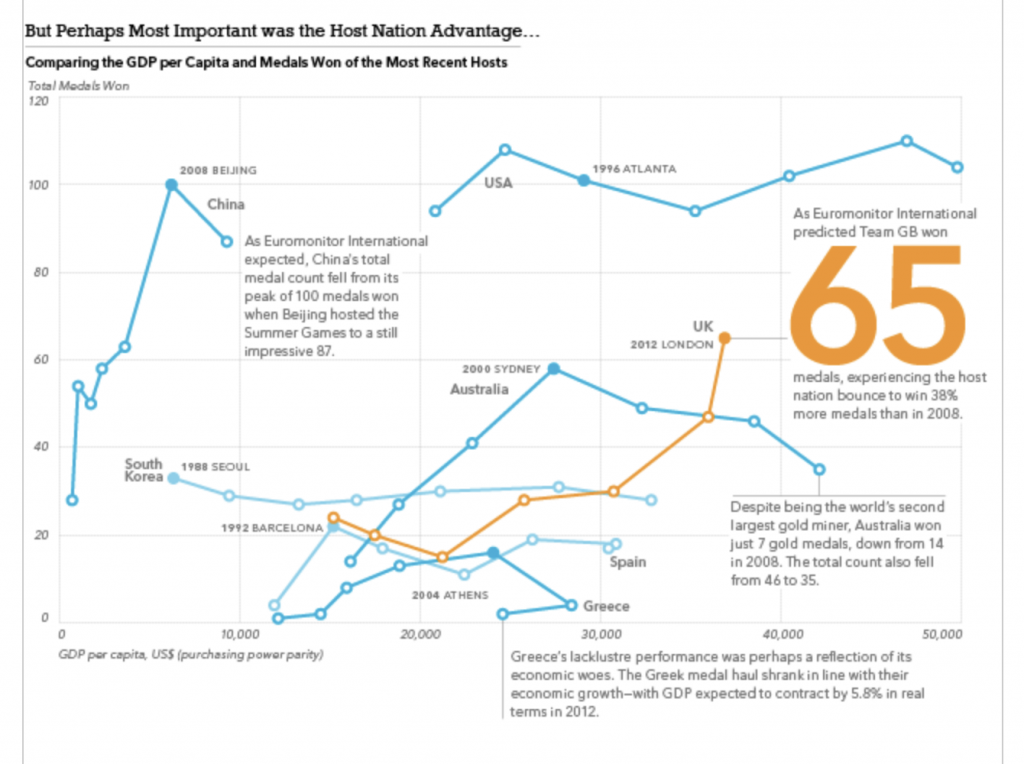
We concluded that host nations do see a slight bump in their total medal count and we then forecast that we expected Team GB (the team for Great Britain and Northern Ireland) to win a total of 65 medals. We reached 64 by the final day and it wasn’t until the women’s pentathlon when, in maybe the last event, Team GB won a silver medal bringing its total to 65, exactly in line with our forecast.
Probably the most Olympics I’ve ever watched.

Of course we also looked at the data for a number of other things, including if GDP per capita correlated to Olympic performance. We also looked at BMI and that did yield some interesting tidbits. But at the end of the day it was the medal forecast that thrilled me in the summer of 2012.

So yeah, today’s a shameless plug for some old work of mine. But I’m still proud of it two olympiads later.

If you’d like to see some of the pieces, I have them in my portfolio.

Credit for the piece is mine.

US Olympic Performance

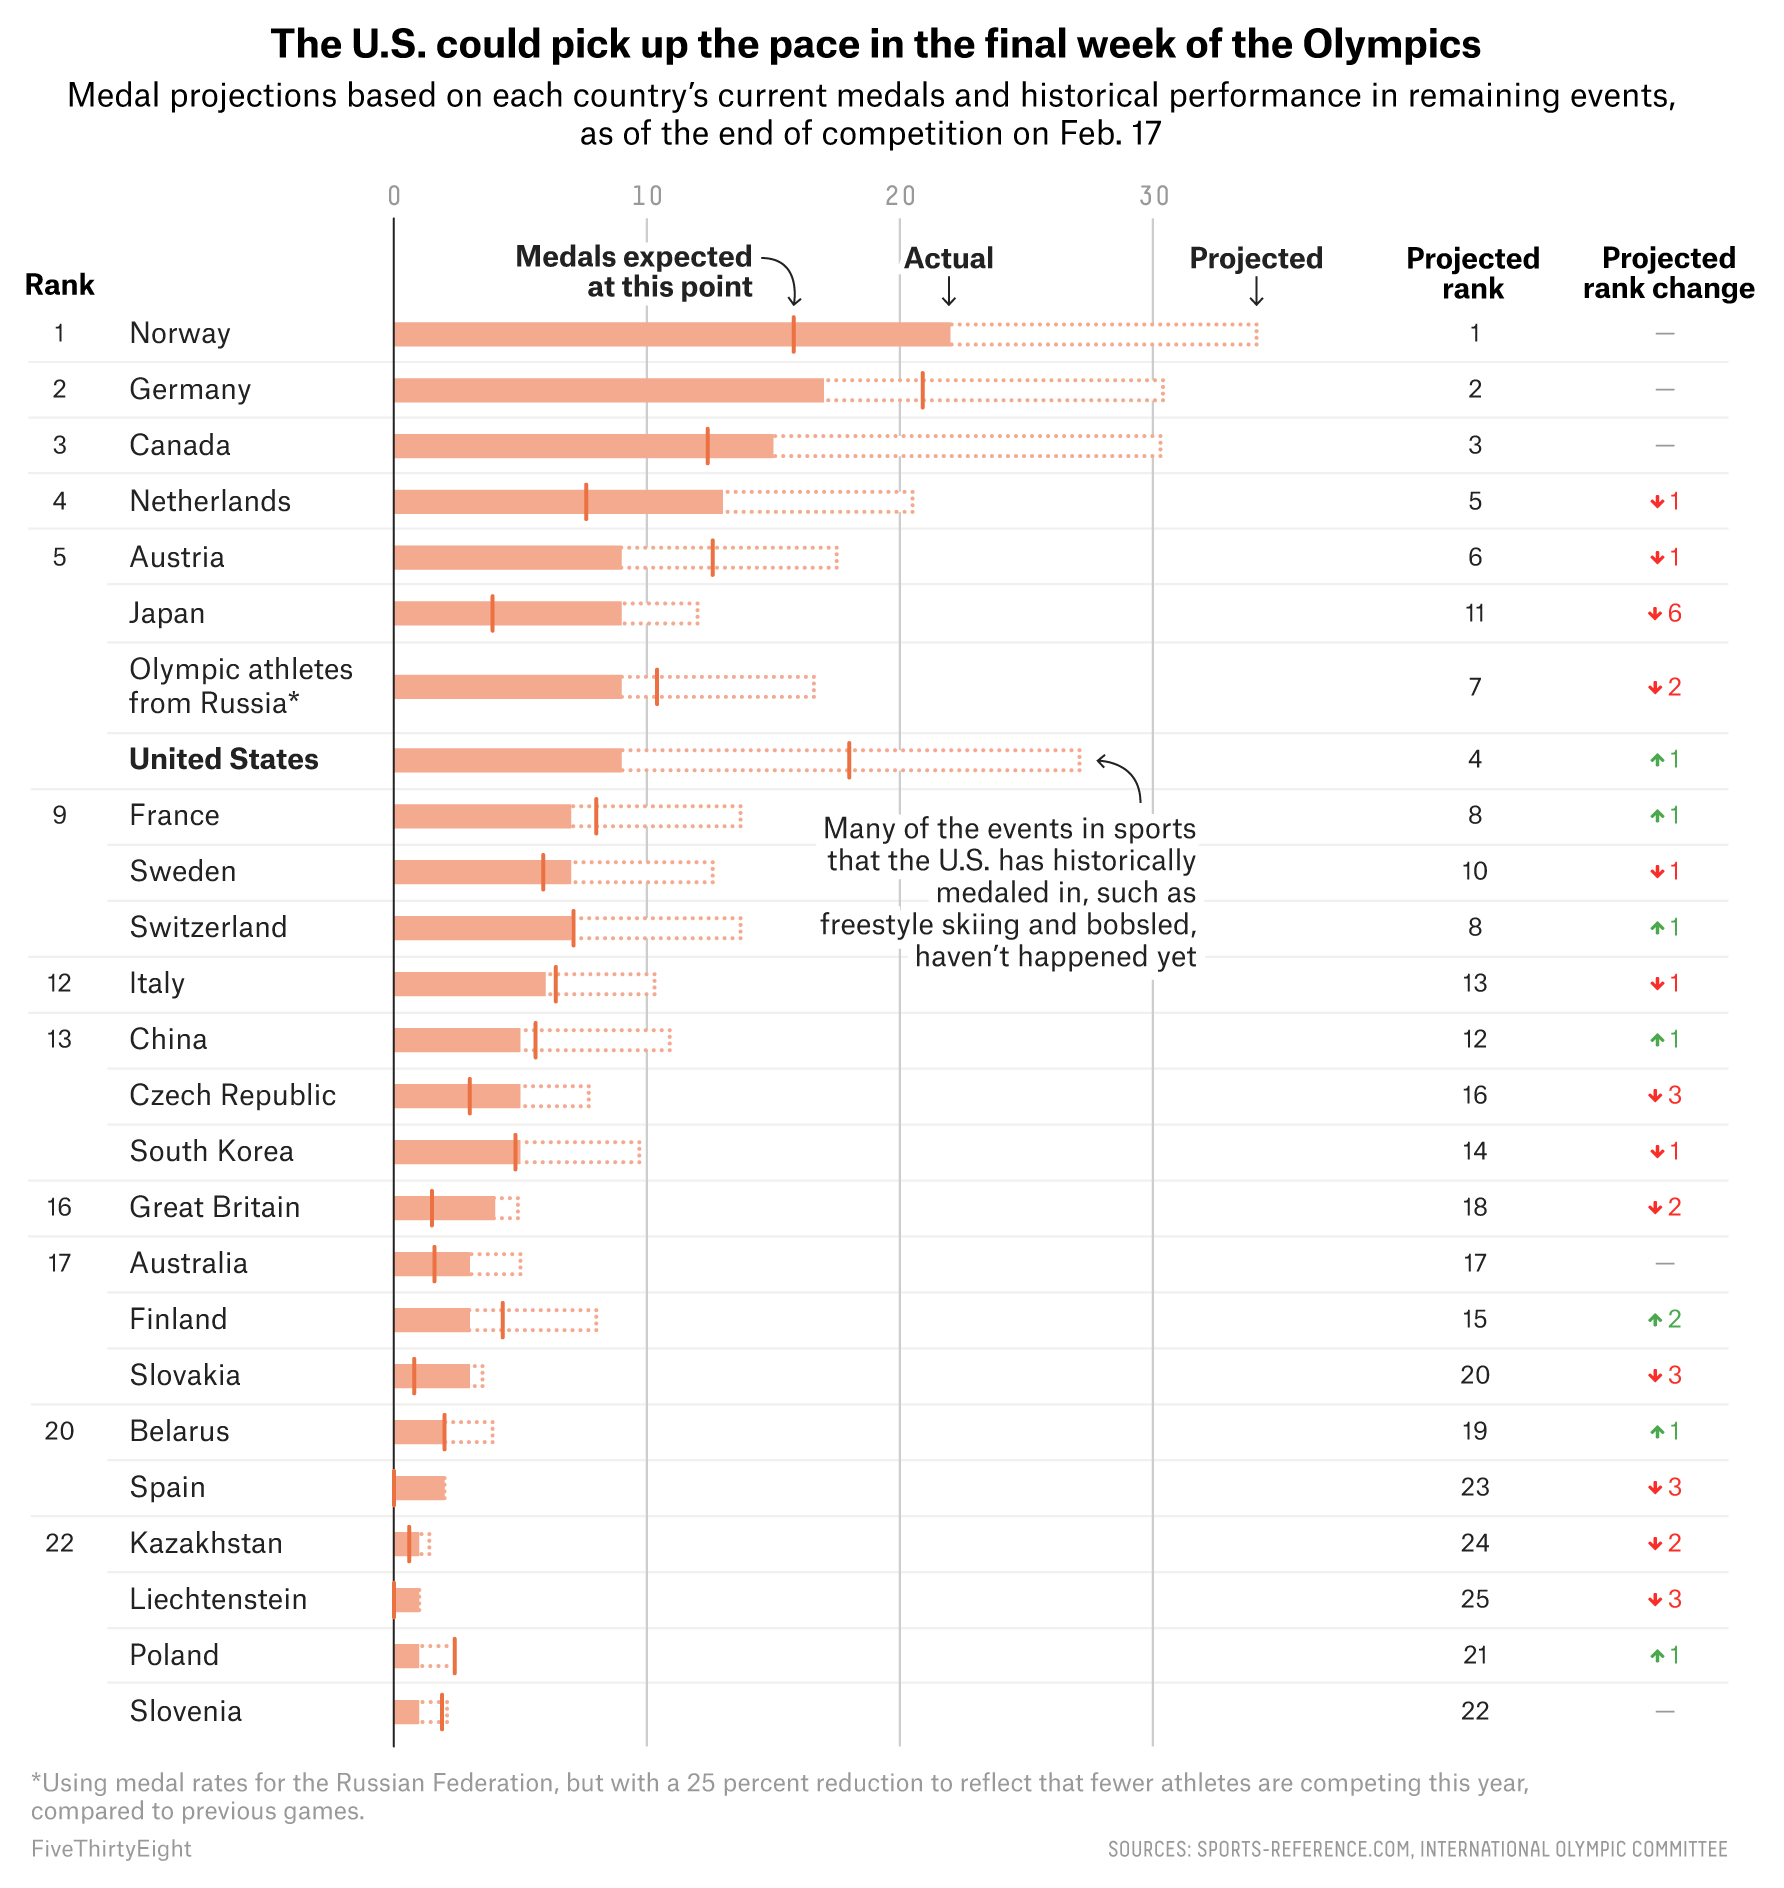
I don’t know if you heard, but the Winter Olympics just concluded. I’m admittedly not a huge fan of the Winter Olympics, but that doesn’t mean I didn’t keep my eye on some of the stories coming out of the coverage. One that I liked was this piece from FiveThirtyEight.

US performance was lagging at this point

It was about halfway through the Olympics and the US was not doing terribly well. The chart does a great job of showing how various countries were performing, or over- or under-performing, their expected total medal winnings. It did this through a filled bar chart with a bar-specific benchmark line. It was a nice combination of a couple of different techniques to incorporate not just the usual above or below the trend, but also the actual amounts.

Credit for the piece goes to Gus Wezerek.

UK Performance at the Olympics

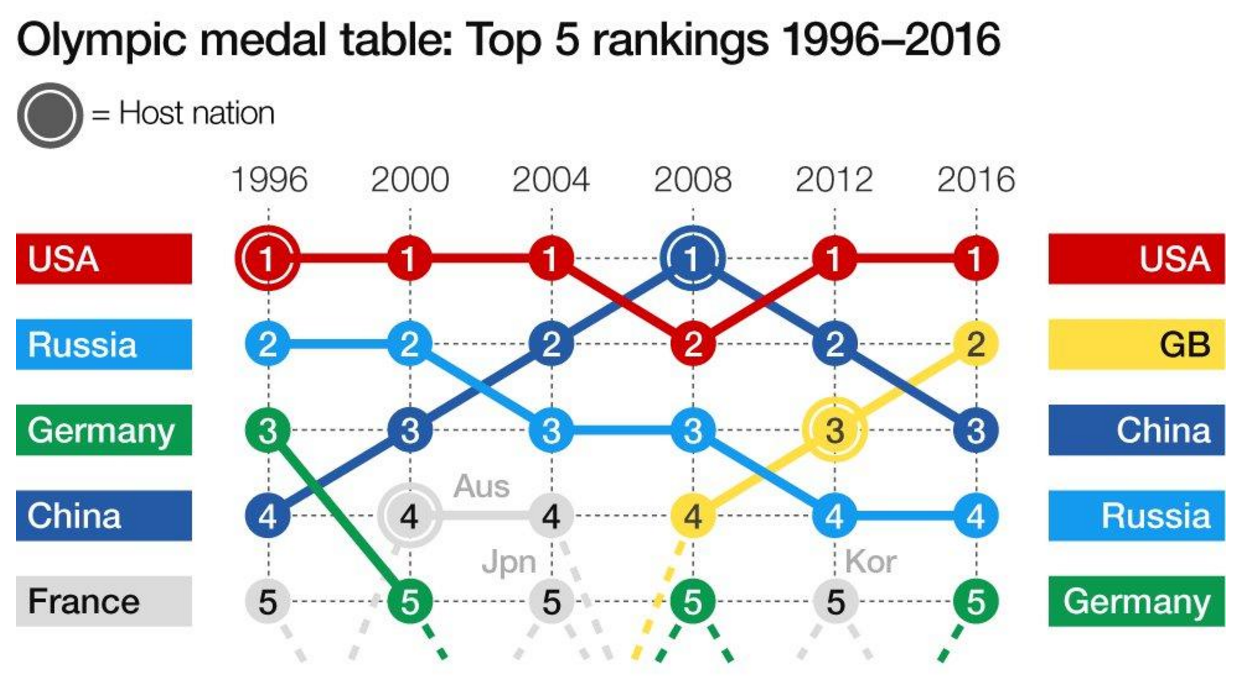
The Olympics are over and Team GB did rather well, coming in second in the medals table with 27 gold medals, more than they won back in 2012 when they hosted the Olympics. (See my piece four years ago where a colleague of mine and I accurately predicted the UK’s total medal count.)

Consequently the BBC put together an article with several data-driven graphics exploring the performance and underpinnings of Team GB. This screenshot captures a ranking chart that generally works well.

How the Olympics rankings have changed over the years

However, the use of the numbers within the dots is redundant and distracting. A better decision would have been to label the lines and let the eye follow the movement of the lines. A good decision, however, was to label the grey lines for those countries entering and falling out of the Top-5.

Credit for the piece goes to the BBC graphics department.

In Putin’s Russia Steroids Dope You

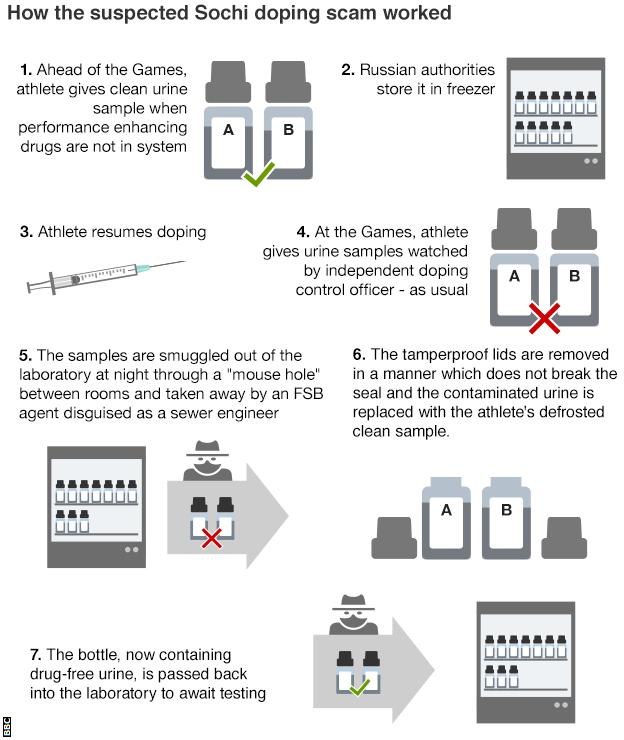
I mean really, given the rampant and pervasive nature of the Russian state-aided doping programme, how could I not use the Russian reversal? Yesterday WADA, the international anti-doping agency, released its findings on Russian doping at the Olympics. And, suffice it to say, the report is rather damning. The BBC published this graphic in an article to help demonstrate the scheme.

How it all worked
How it all worked

Unlike the evidence of doping, I find the graphic itself lacking. More could have been done to create more consistent type. Text justification ranges (pun intended) from left to right, without any clear system. Why do some stages, e.g. four, align to the right and then others, e.g. seven, align to the left?

Also, I believe more could have been done with the illustrations, in particular the bottles labelled A and B, to better differentiate between a clean sample and a contaminated sample. Why, for instance, does Step 1 include both an A and a B when it mentions only one sample?

In short, the story certainly warrants explanatory graphics, especially as to how the sealed lids were removed, but this piece is not the solution (pun also intended).

Credit for the piece goes to the BBC graphics department.

Speed Skating

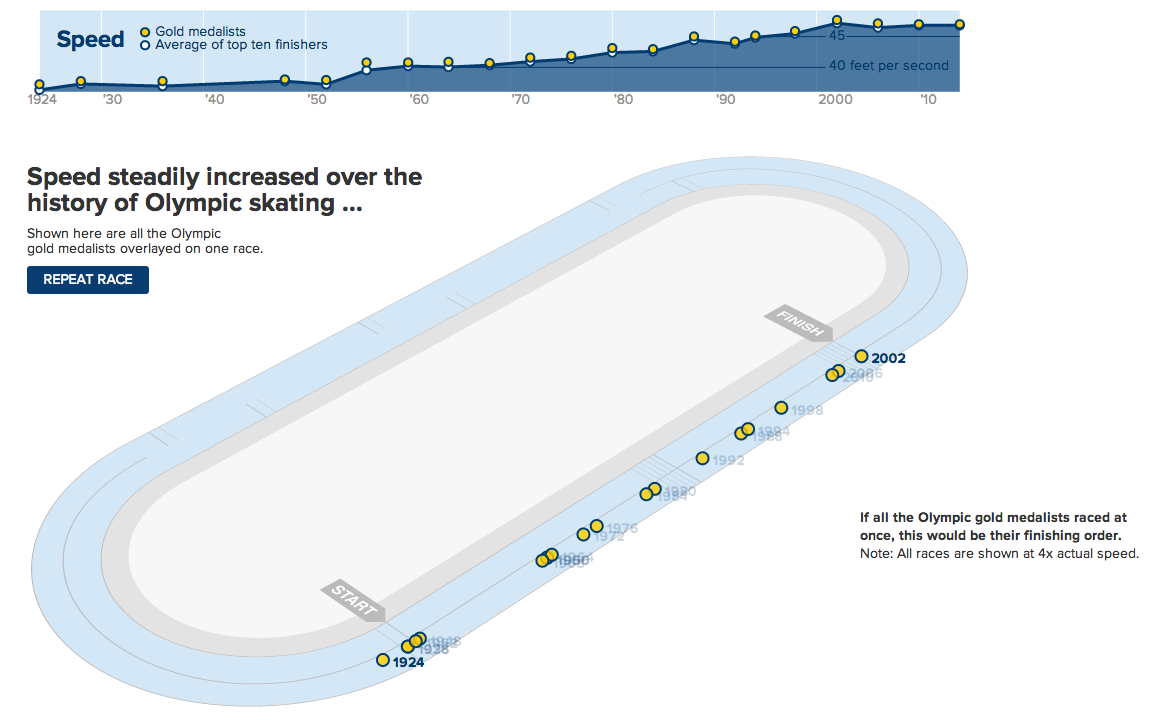
Today’s post comes from a co-worker and looks at the increase of speed in speed skating in the Winter Olympics since 1924. It does a nice job of showing the increase in the speed. Because to a degree, the increase has not been linear. Instead, it really only increased in two spurts and recently has remained fairly constant.

Then to show how slight differences in speed impact an actual race. The times are plotted against the distance in a simulated race. That shows that seemingly incremental increases in speed can have a drastic impact on where one finishes a race.

Race around the rink

Credit for the piece goes to  Andrew Garcia Phillips.

Views on Gay Marriage Around the World

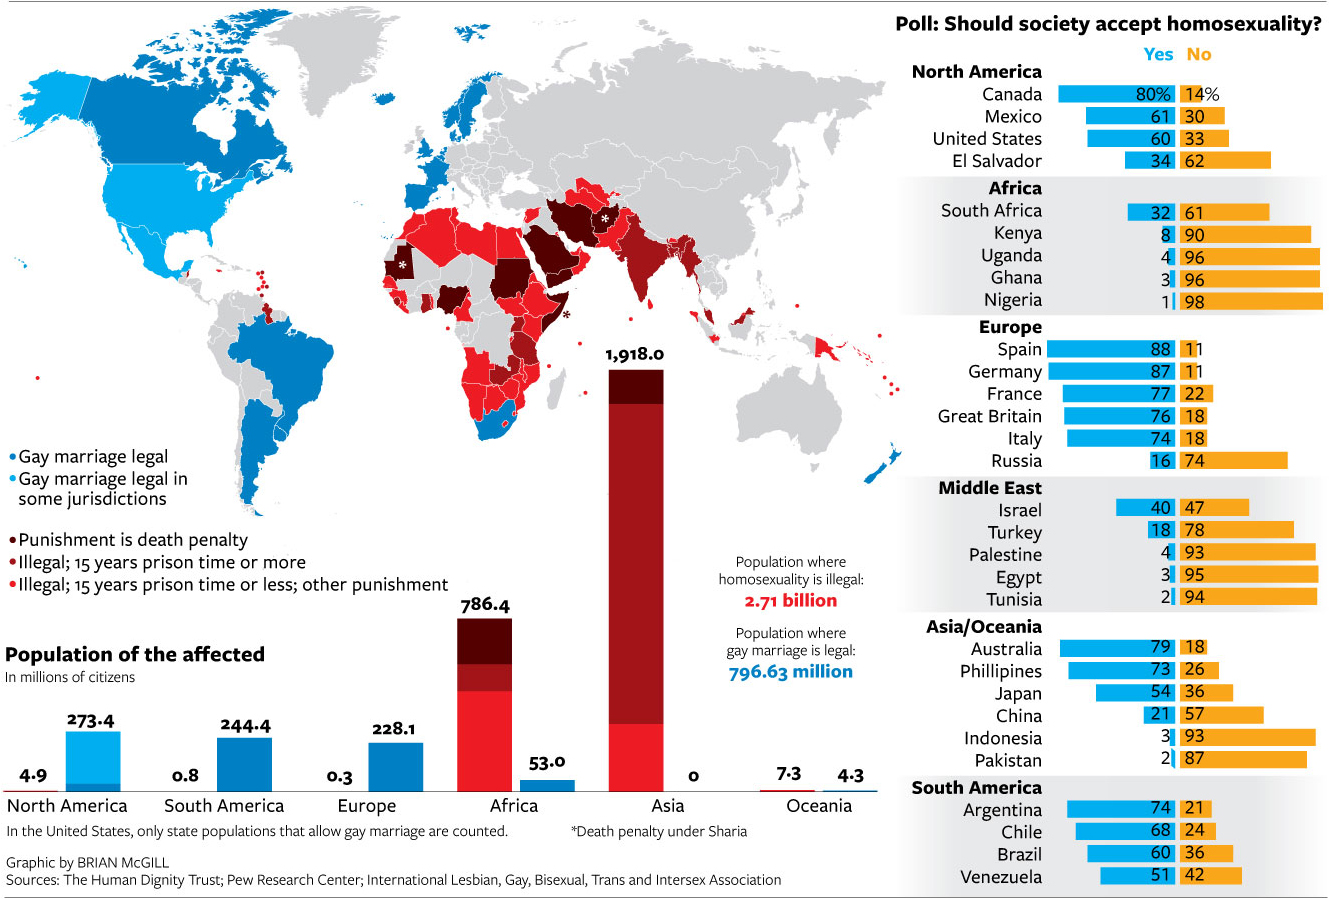
If you have been living under a rock, Sochi, Russia is hosting the winter Olympics this year. A year in which the Russian government passed legislation banning not same-sex relationships but advocacy for said relationships. Several countries, including the United States, take issue with the legislation. But this graphic from the National Journal hints that in order to reverse such barriers to same-sex marriages, the United States and like-minded societies have a long way to go to convince not just Russians, but many other societies across the world.

Views on gay marriage

Credit for the piece goes to Brian McGill.

Olympic Forecast Comparison

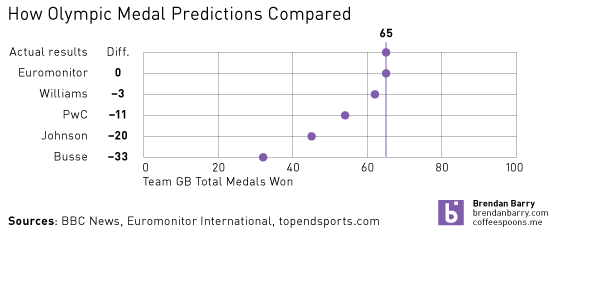
During my research for the Olympic medal projections, I came across a few sites that presented a few other projections because, quite frankly, 65 seemed rather high given that the UK won only 47 the year before. The chart below just compares how the other forecasts turned out in the end.

Forecasts Compared
Forecasts Compared

Emily Williams from the Tusk School of Business, Price Waterhouse Coopers, Dan Johnson of Colorado College, and Meghan Busse from Northwestern University.

How the UK Got to the 65 Medals We Correctly Predicted

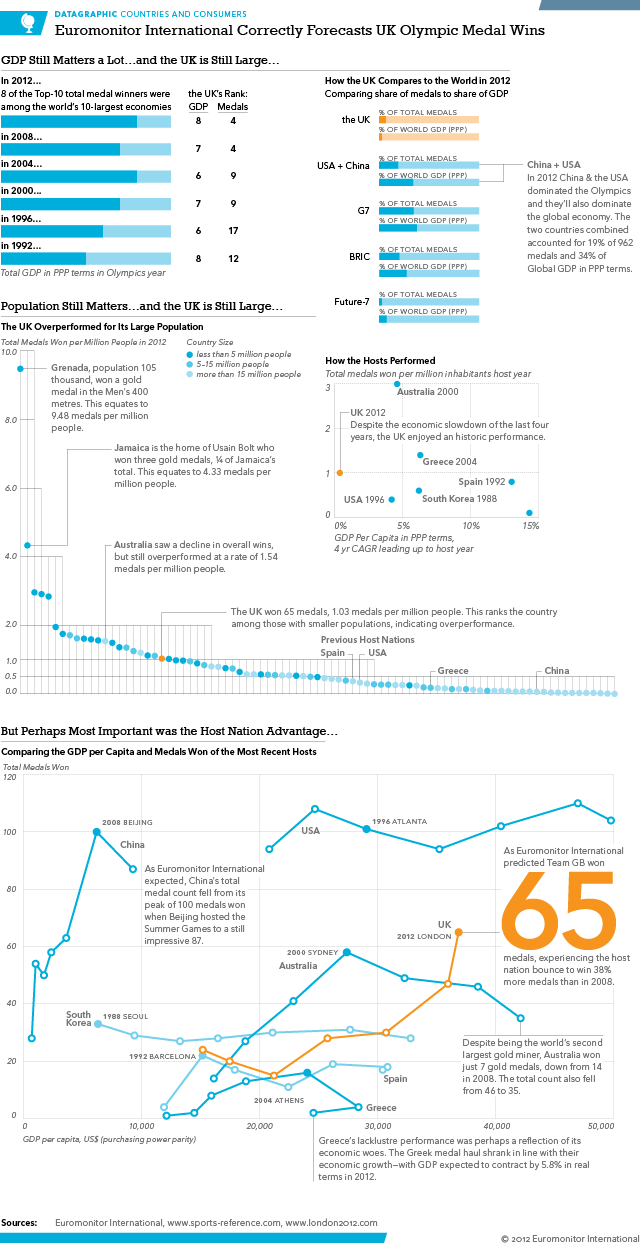
So the Olympics are over. But before they began, I and some co-workers made a prediction about how the United Kingdom and their Team GB would perform. We predicted 65 medals. How did the United Kingdom fare? They won 65 medals. This is a follow-up infographic about what made the United Kingdom a winner at the 2012 Summer Games. It’s a bit larger than the first version, but this one also includes new data and revisits some of the earlier themes.

Another important (and correct) prediction was that China would slip and not reach 100 medals. This should happen after experiencing the host nation bump. While we did not create a number for China, they scored only 87 medals. Another correct prediction.

We Nailed the Prediction of 65 Team GB Medals

All in all a very successful series. (Created for my employer Euromonitor International, as the usual disclaimer goes.)

Olympic-sized Appetites

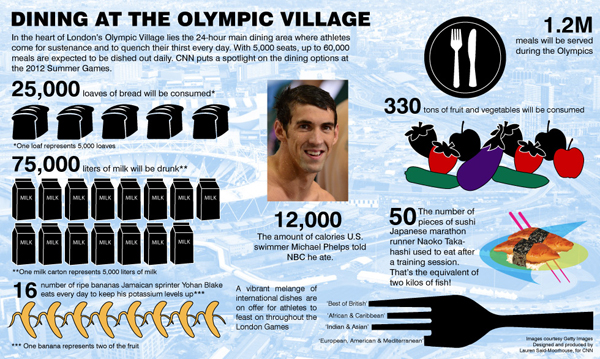
The Olympics bring out the best. Well, at least in athletics. In terms of infographics, not always so much. This piece from CNN is a fairly unorganised mess with lots of individual datapoints. It’s a shame to see this at CNN when so many other news outlets are doing quality graphic work for the Olympics.

Olympic nutrition
Olympic nutrition

Weekend Work

Here’s a rare weekend post to showcase some Olympic-related work.

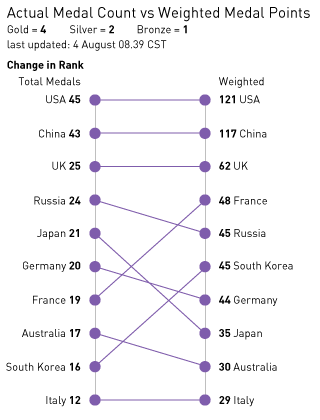
The following graphic looks at how the ranking changes for the Top-10 countries if medals are weighted. To me it is ridiculous that Kazakhstan is ranked higher than Russia because Kazakhstan has won 4 gold medals compared to Russia’s 3 when Kazakhstan has a total of 4 medals whereas Russia has 24. (All counts current as of this post.) So while I have been ranking countries according to their total medal count, what happens if I weight the gold and silver medals against the bronze?

It turns out that the leaders don’t change, but the rest of the Top-10 ranking gets shuffled a bit. For example, Japan has performed well at an overall level with 21 medals thus far. But only two of those have been gold medals and so its rank in the system below fell three positions.

Change in Rank for a Weighted Score