The NFL Draft Comes to Philadelphia

The joke I have been telling everyone in person this past week: I changed jobs and moved 750 miles from Chicago to Philadelphia, but I still cannot escape the NFL Draft. The two previous drafts occurred across the street from my last job and this year they are three blocks away from my new flat. Traffic is a bloody nightmare. So while there is a lot of news to cover through data visualisation and design, the local story is the NFL Draft that begins tonight next to the Rocky statue and in front of the Art Museum. We will return to trade wars with Canada, tax cuts for the rich, North Korea, climate change, and other things over the next few weeks.

Today’s piece comes from the Washington Post and looks at NFL Draft success across the NFL. Unfortunately for all of you, I know almost nothing about the NFL except Free Tom Brady. (I have to transfer my Red Sox allegiance somewhere, right?) But this set of small multiples looks fantastic and generally tells me that the Colts and Packers—the latter likely to the chagrin of my Chicago-born followers—have historically done well.
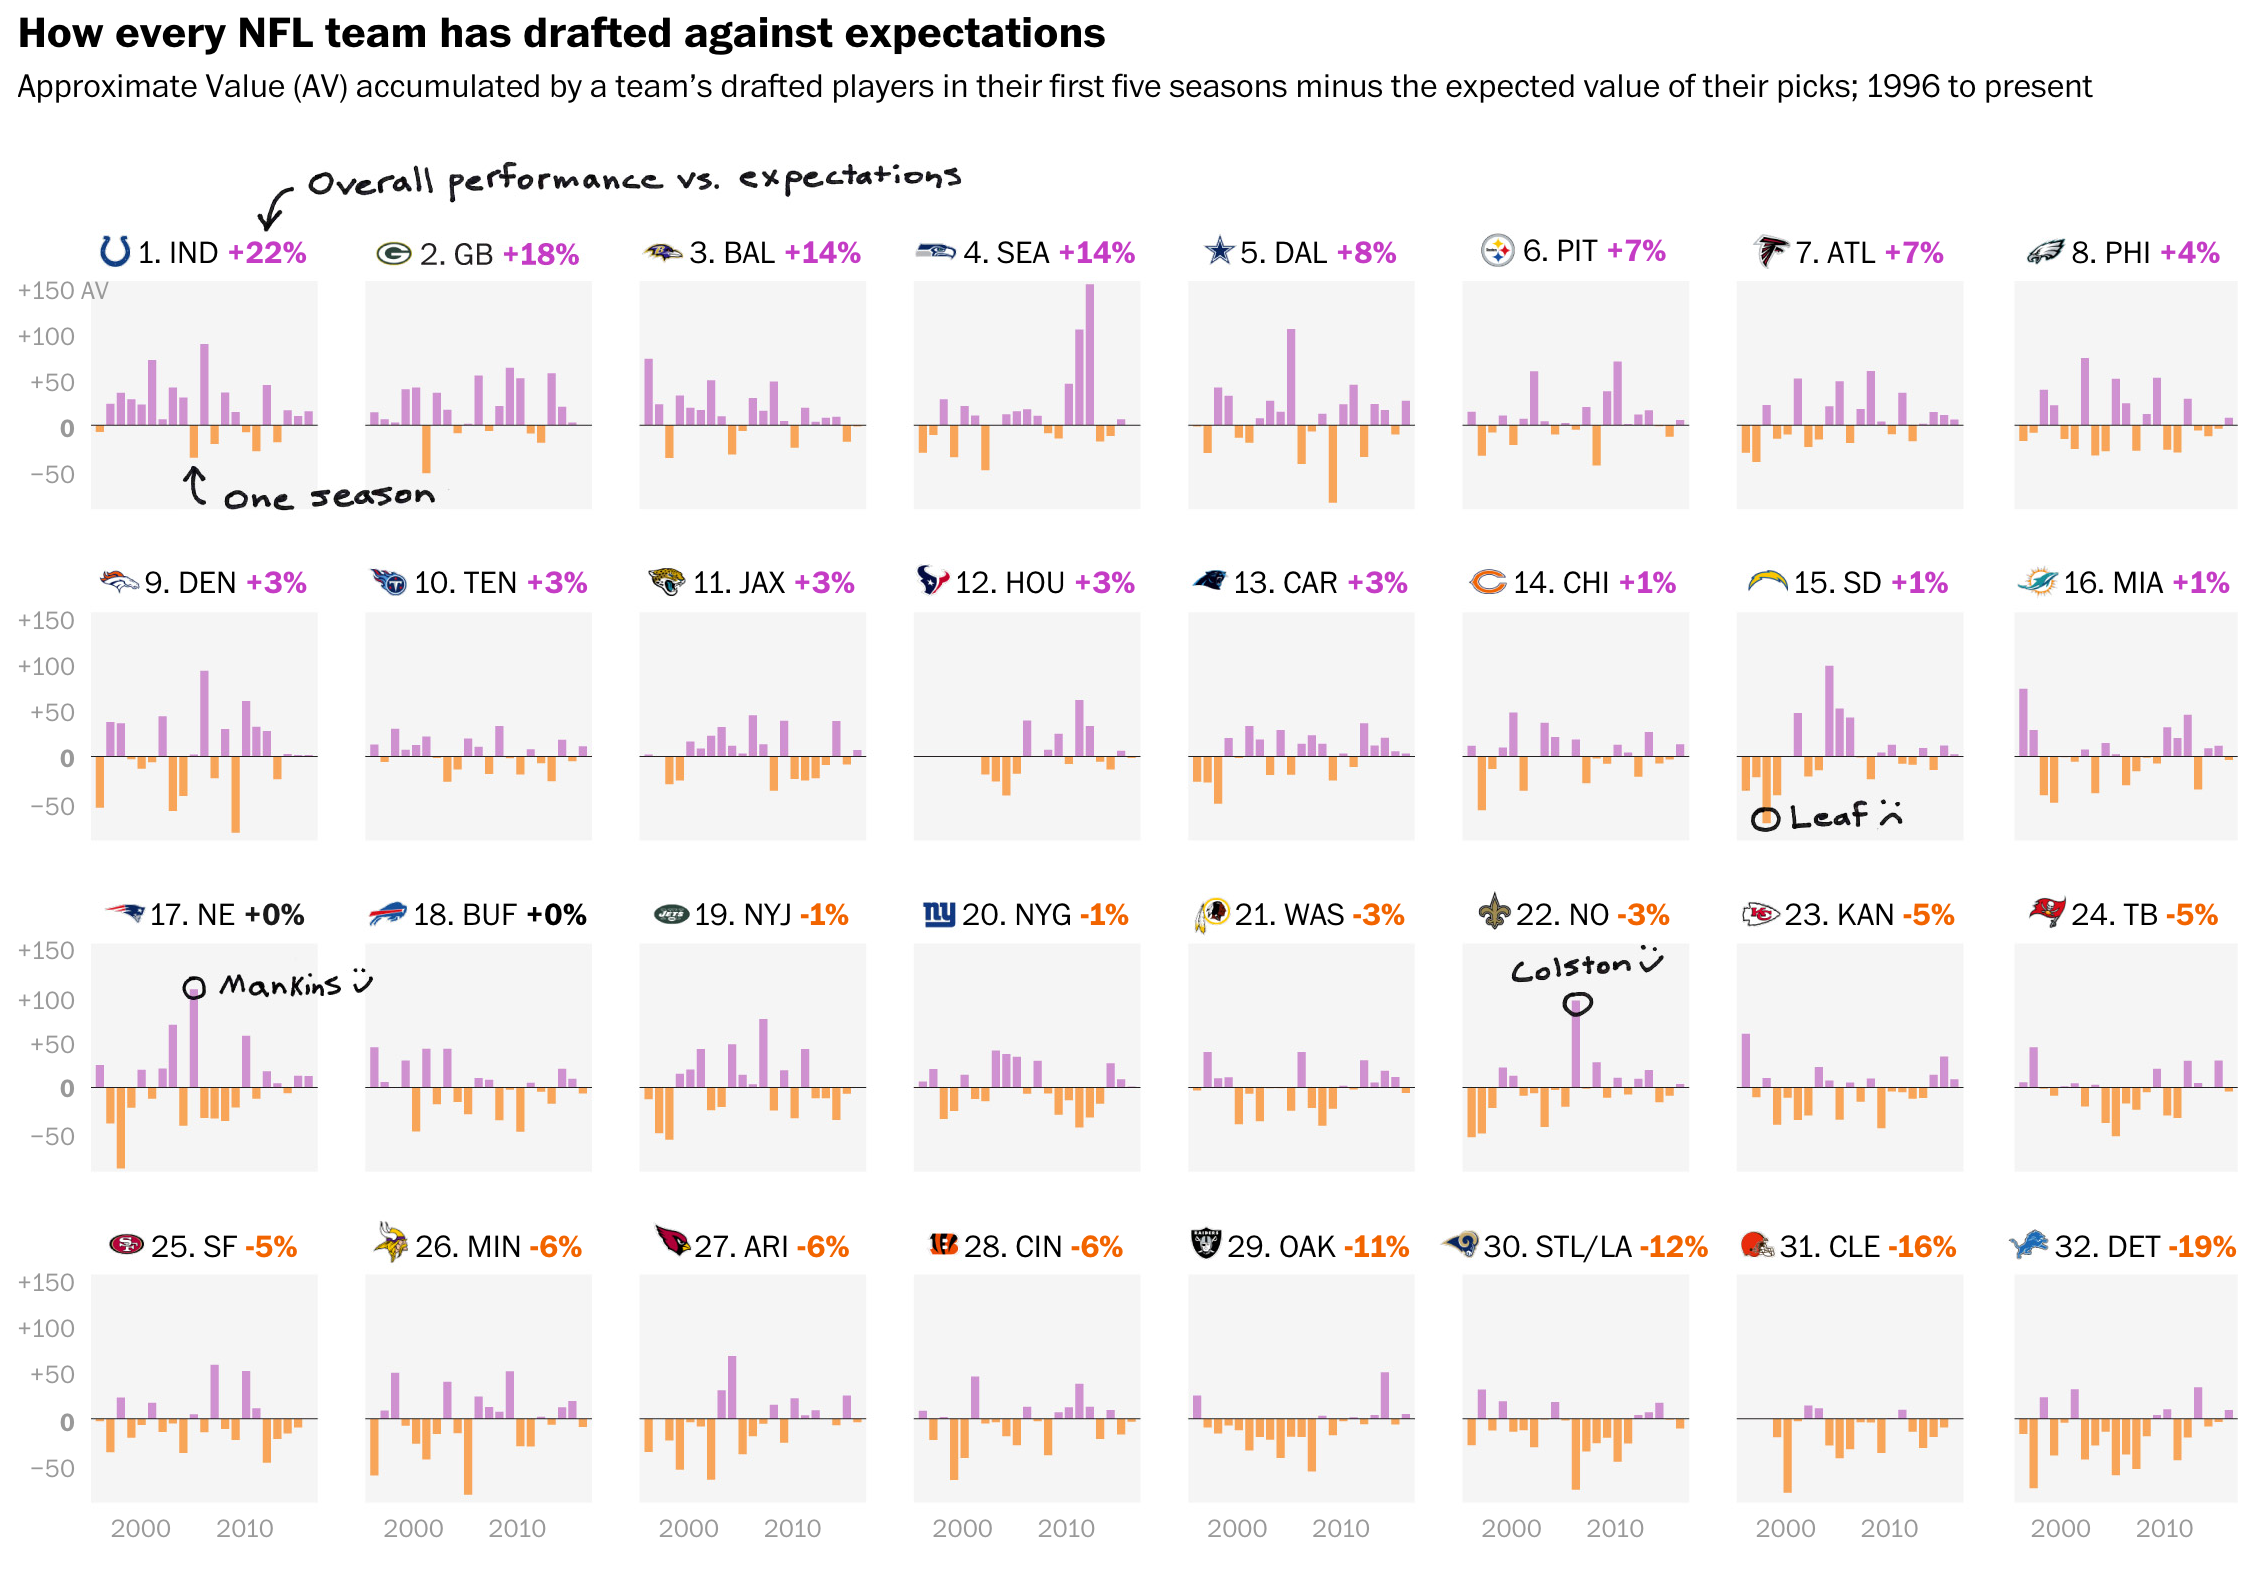
While I fail to understand the references/anecdotes, the grid looks nice…

Aesthetically, I am not sure about the handwriting typeface. I wonder: could the content have been handled better by a more traditional face?

Credit for the piece goes to Reuben Fischer-Baum.

Andy Murray

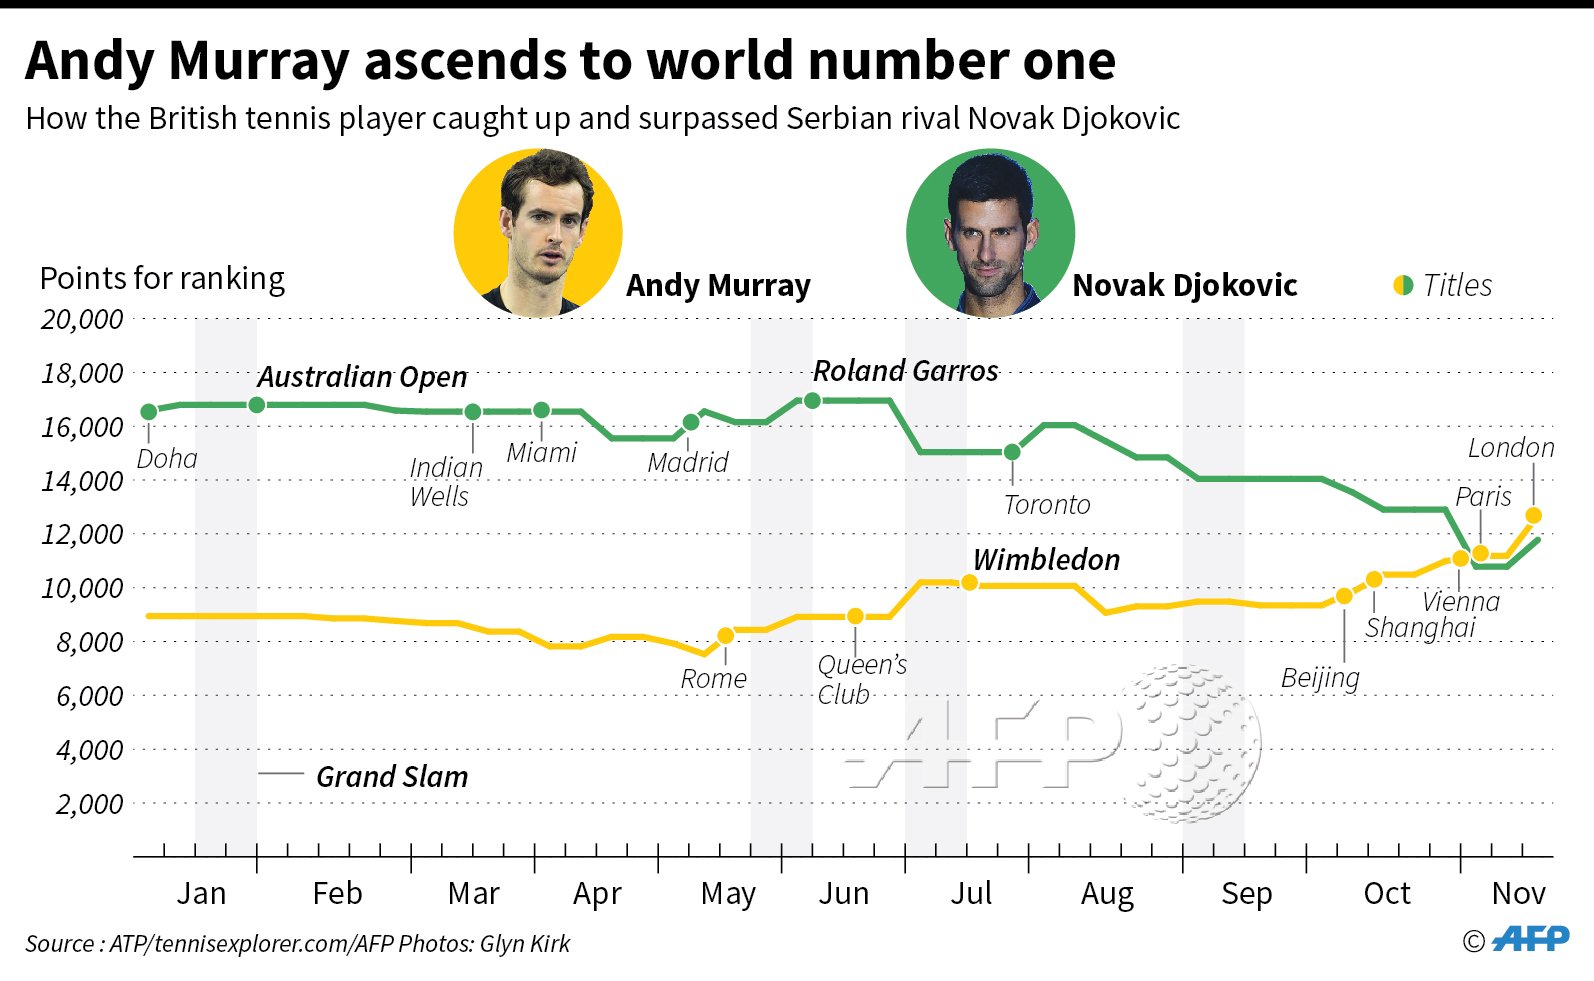
A changeup from the political coverage, here we have sportsball! And by sportsball I mean tennis, if you did not get that from today’s post title. Andy Murray won the ATP World Tour finals, and with it won the number one seed in tennis, displacing Novak Djokovic.

When Andy Murray surpassed Novak Djokovic

Nothing super fancy going on here, just a line chart. But, it does do a good job of showing how over the last year, the slow decline of Djokovic and the ascendance of Murray.

Credit for the piece goes to John Saeki.

Beating Ted Williams

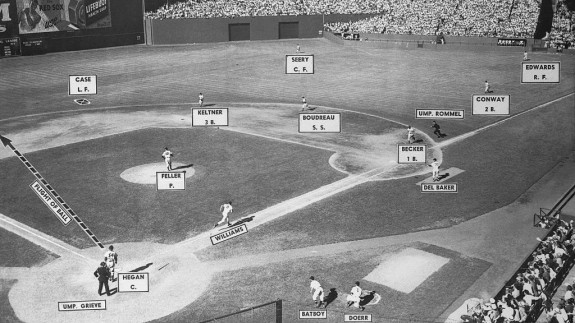
Last week the Red Sox’s season came to an end after being swept by the Cleveland Indians and with the sweep so too ended David Ortiz’s career. He is one of the best Red Sox hitters of all time, but Ted Williams was the best. And so last week FiveThirtyEight ran a piece on how one manager from the Cleveland Indians—hence the relevance, right?—beat Ted Williams by “inventing” what we all know in baseball as the shift.

The below photo comes from the game and shows what we baseball fans now think of as routine was at the time almost brand new. (Although to be fair, the shift in this case left only one fielder on the left side of the field—the left fielder. Typically today both the shortstop and left fielder both remain.) Anyway, for those baseball fans, the article is worth a quick read.

Who's on first? Not Ted Williams after his at bat.
Who’s on first? Not Ted Williams after his at bat.

Credit for the piece goes to an unknown photographer ca. 1946.

Road to Victory

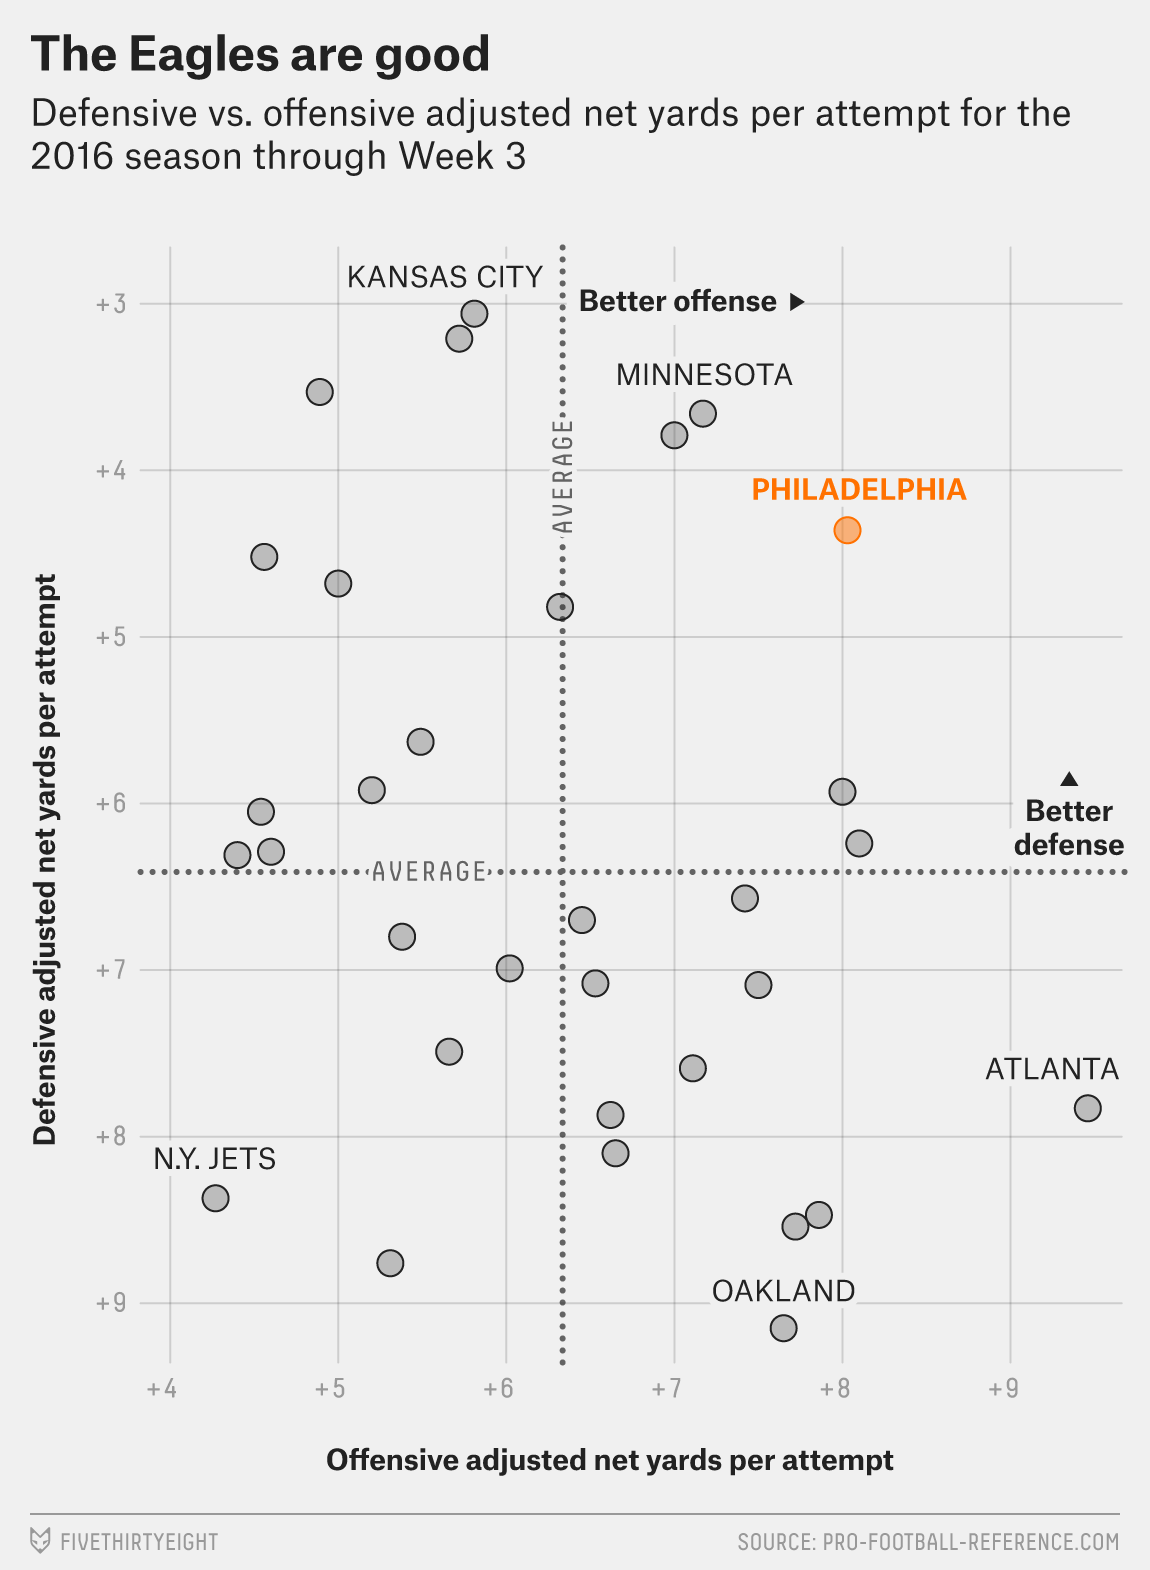
Among my recent life changes, I have moved back to Philadelphia from Chicago. That means Sundays the bars and streets are full of people wearing the jerseys of their favourite Eagles (American) football players. And apparently this year, they are off to a good start. FiveThirtyEight took a look at other 3-0 teams to compare the 2016 Eagles and examine their chances for the playoffs.

Comparing the Eagles offense and defence

Credit for the piece goes to Chase Stuart.

UK Performance at the Olympics

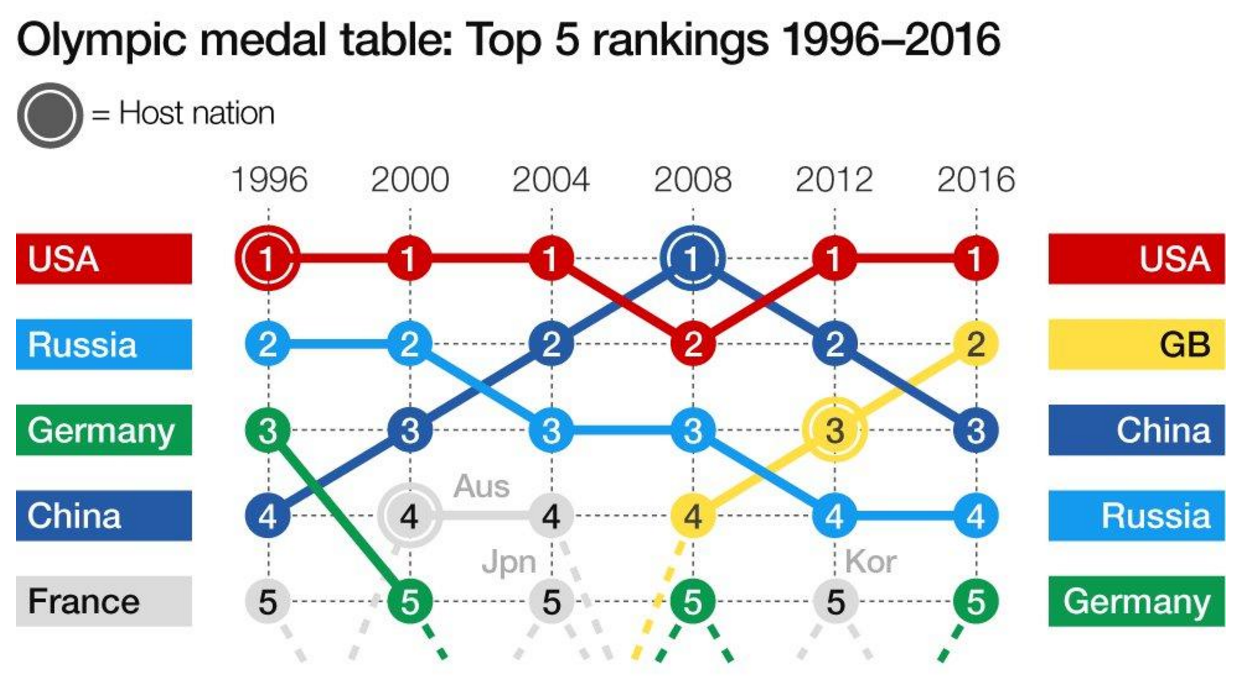
The Olympics are over and Team GB did rather well, coming in second in the medals table with 27 gold medals, more than they won back in 2012 when they hosted the Olympics. (See my piece four years ago where a colleague of mine and I accurately predicted the UK’s total medal count.)

Consequently the BBC put together an article with several data-driven graphics exploring the performance and underpinnings of Team GB. This screenshot captures a ranking chart that generally works well.

How the Olympics rankings have changed over the years

However, the use of the numbers within the dots is redundant and distracting. A better decision would have been to label the lines and let the eye follow the movement of the lines. A good decision, however, was to label the grey lines for those countries entering and falling out of the Top-5.

Credit for the piece goes to the BBC graphics department.

Pill Popping Power

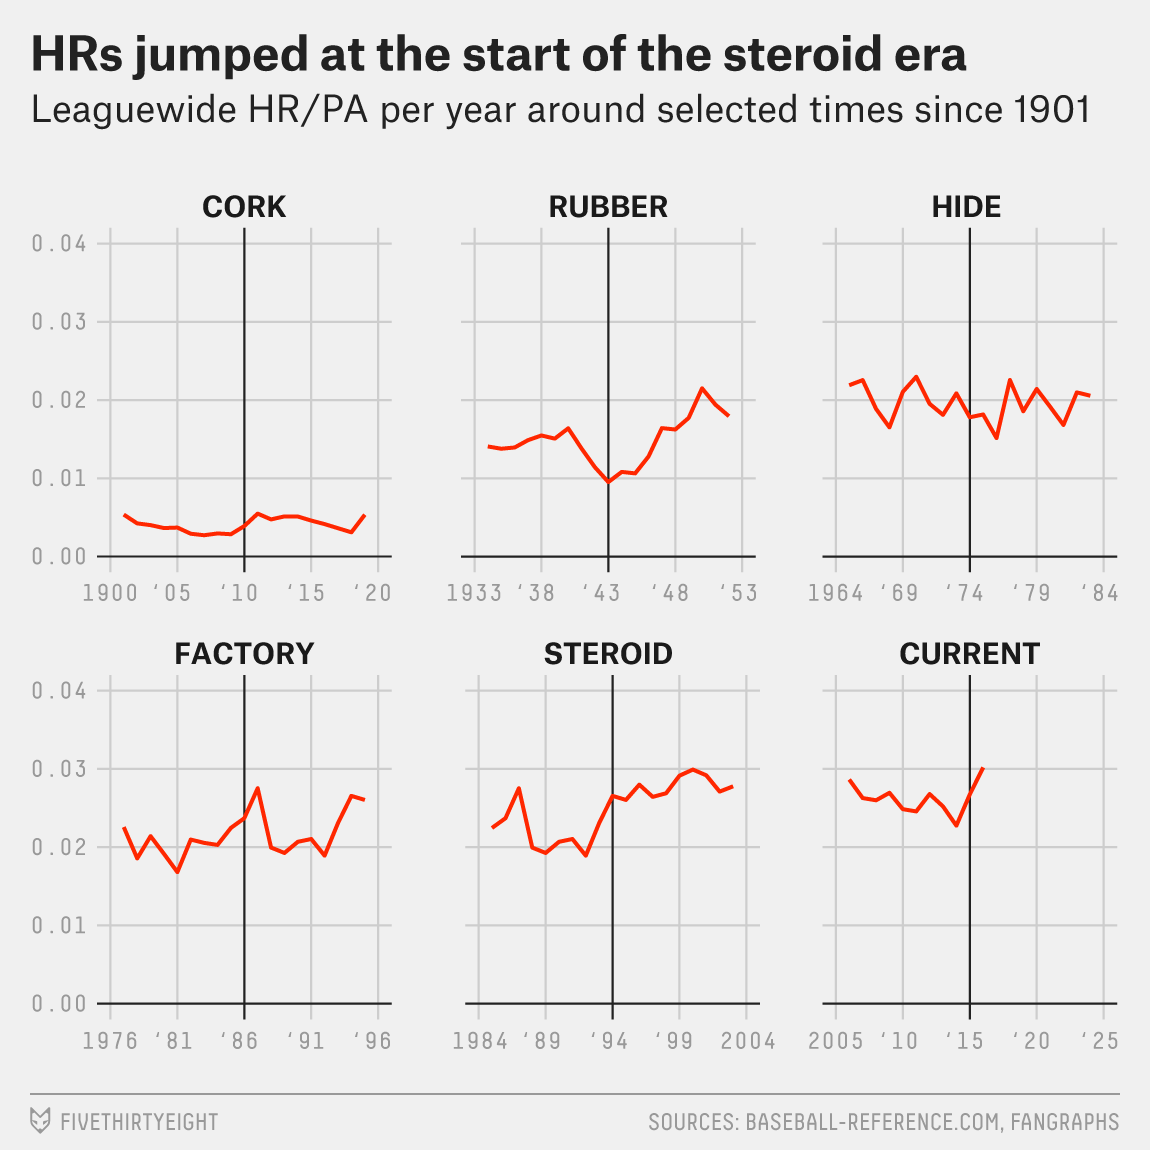
But not likely. As this FiveThirtyEight piece explains, steroids are not likely the cause of the increased power exhibited this year by Major League Baseball. The article goes into a bit of detail, but this set of small multiples does a nice job comparing several other factors that could be at play.

How different factors increased power or not

What I like about the piece is how each line chart is centred on the year where the factor came into play. And then to the right and left are ten years before and after. Maybe a little bit more could have been done to highlight the differing years—I admit that I missed that at first—but the concept itself is solid.

Credit for the piece goes to the FiveThirtyEight graphics department.

Contextual Scatter Plots

I know I mentioned that I would review the coverage of the Orlando shootings this week in more depth than I did on Monday. But, allow me an interruption for a nice little piece that I wanted to get to last week. If anything, it’s far less serious.

Scatter plot
Scatter plot

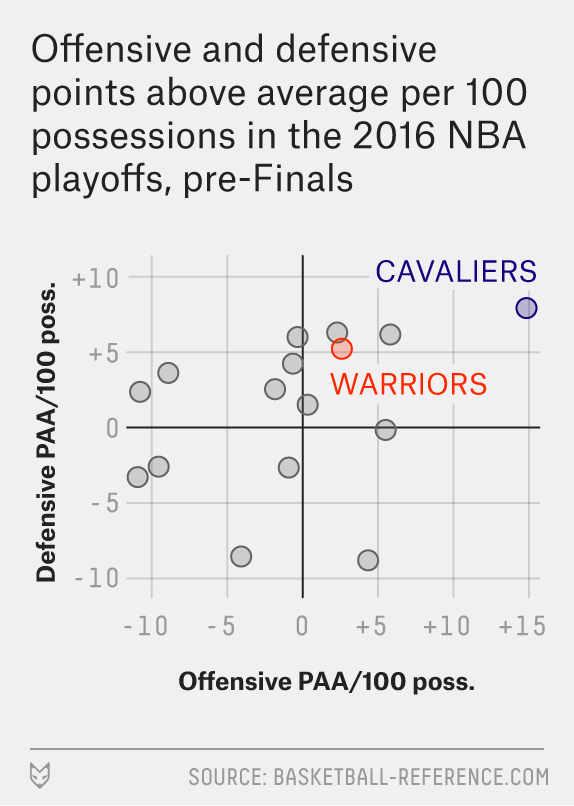
My apologies for my focus of late on small graphics, but I really think they are underappreciated component of providing context to written analysis. And this piece from FiveThirtyEight about the point scoring accompanies some good analysis that actually made some sense to this non-basketball fan.

Note the two finals-playing teams are highlighted—and importantly how the text is cleared with interrupted chart lines, a very nice touch—while other teams remain visible but unidentified for context.

Credit for the piece goes to Neil Paine.

Don’t Go, Big Papi

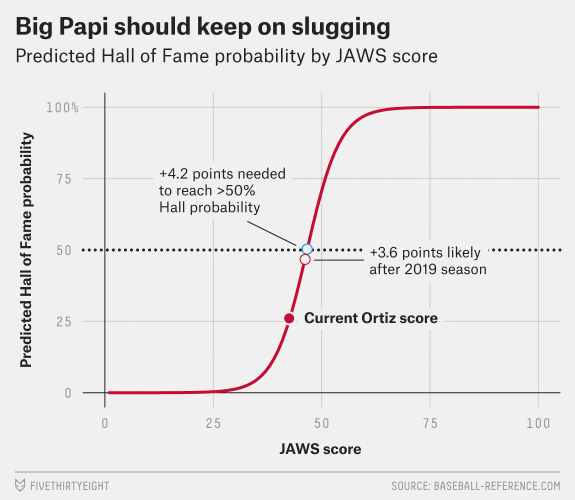
Today’s graphic is not terribly complicated, but it is near and dear to Boston Red Sox fans. This is David Ortiz’s final year as he announced his retirement at the year’s outset. And of so course FiveThirtyEight examined Big Papi’s chances of getting into the Hall of Fame.

Please don't go…
Please don’t go…

Credit for the piece goes to Rob Arthur.

Pedro Martinez Was A Great Pitcher

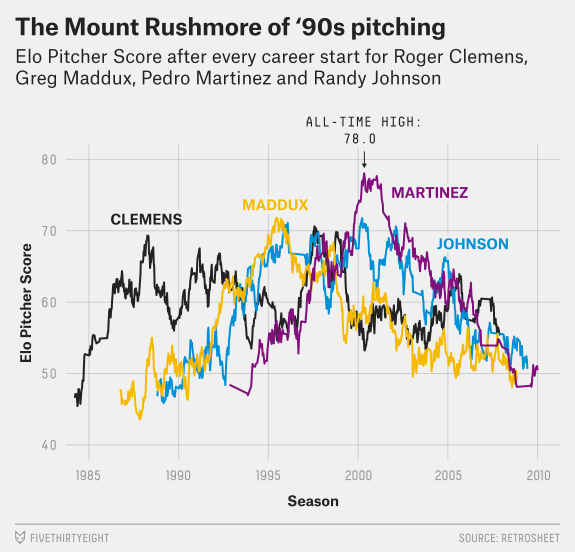
Last week FiveThirtyEight posted a nice article about the best pitchers in baseball. Turns out Pedro Martinez rates pretty highly among them. The late 90s and early 00s were great for Red Sox pitching.

Pedro was great
Pedro was great

Credit for the piece goes to Neil Paine and Jay Boice.

Nova Beats the Buzzer

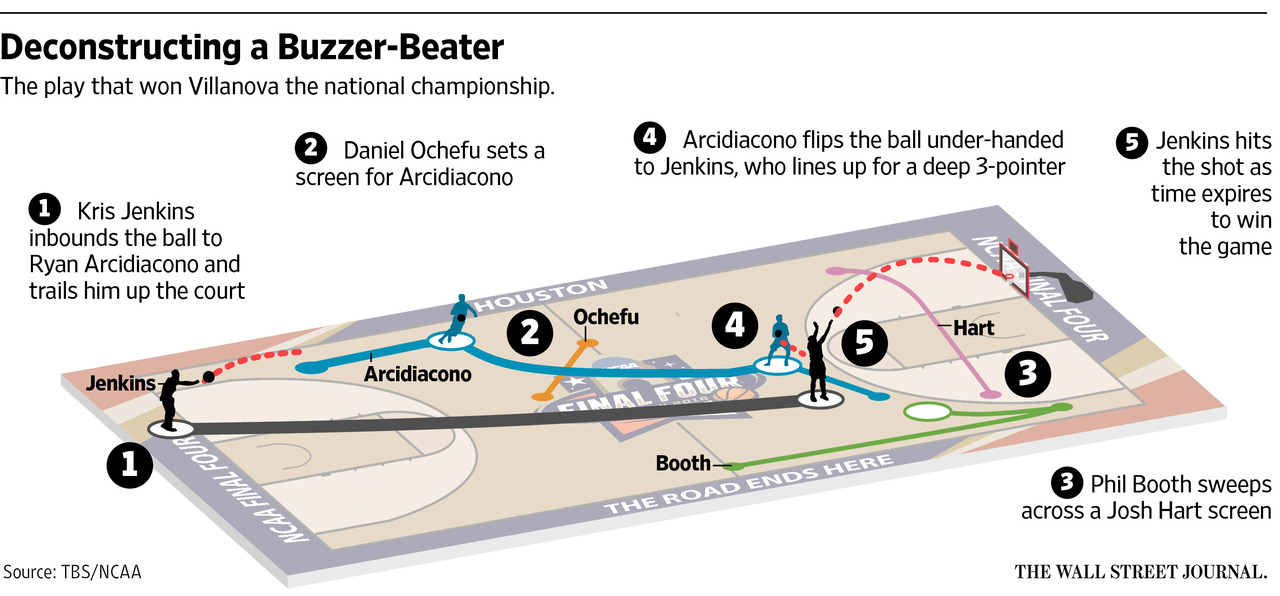
As you may know, while I presently live in Chicago, I hail from Philadelphia. I grew up there and most of my best mates did too. And some of them attended a small school called Villanova. And as you may know, their men’s basketball programme just won the national championship in dramatic fashion. So today’s post shares with you a graphic from the Wall Street Journal that explains how Villanova won the game in the final few seconds.

The final shot won it all

Credit for the piece goes to the Wall Street Journal graphics department.