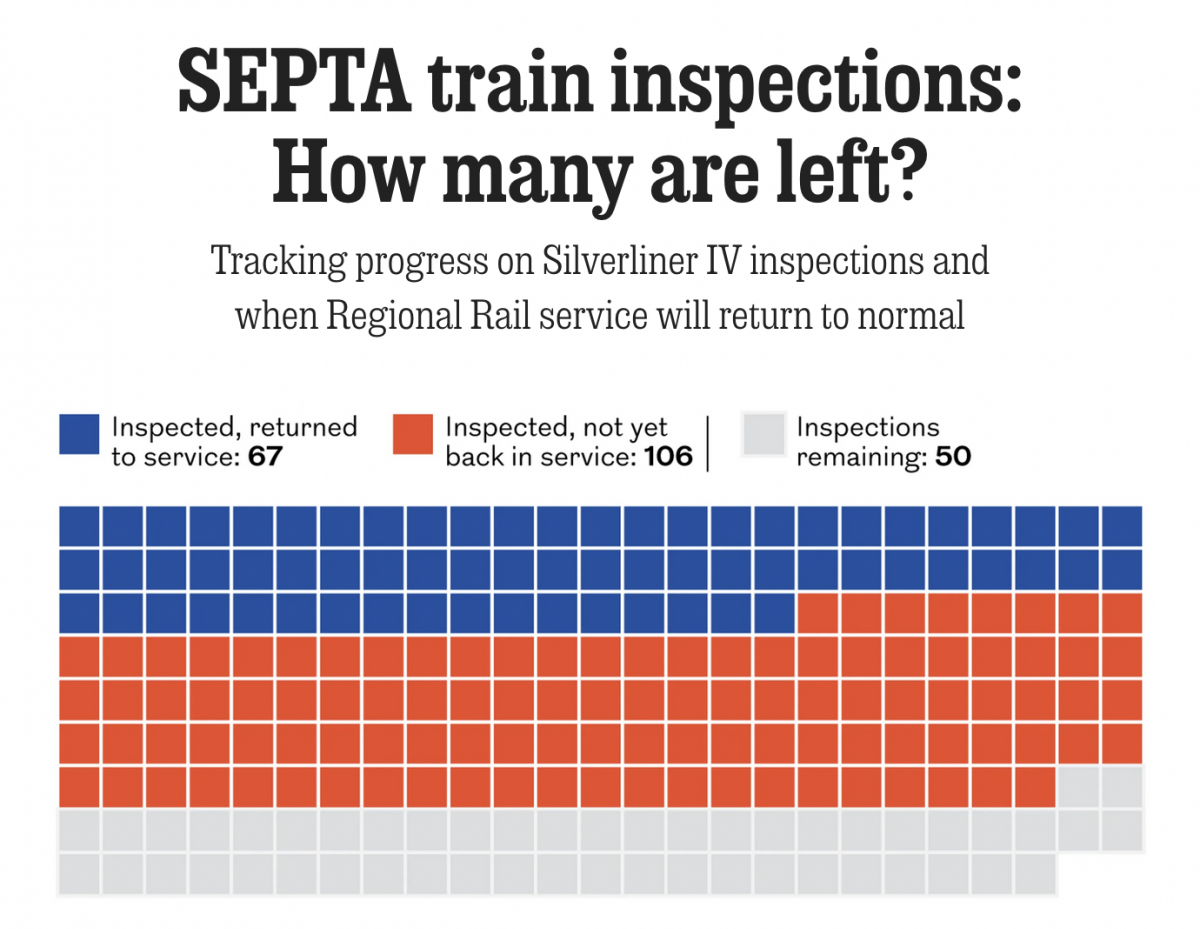
Tarnished Linings

Last month the National Transportation Safety Board (NTSB) ordered Philadelphia’s public transit system, SEPTA, to inspect the backbone of its commuter rail service, Regional Rail: all 225 Silverliner IV railcars. The Silverliner IV fleet, aged over 50 years, suffered a series of fires this summer and the NTSB investigators wanted them inspected by the end of October.

We are now into the second week of November and the job is not yet finished. Luckily, the NTSB extended the deadline to the middle of November—this Friday—and the Philadelphia Inquirer has quietly tracked the progress of the inspections with a series of graphics, the screenshot below being today’s. (The data being as of Friday, 7 November.)

I specifically took a screenshot from the top of the webpage, because I think this datagraphic series works particularly well. Directly beneath the article’s sub-head the reader sees the graphic answering the title’s question. The legend sits atop the graphic and incorporates the actual data labels for the specific number of cars in each category. This is instant gratification without the need for a superfluous file photo of a burned out railcar or commuter rail station. I have long advocated that data visualisation pieces can be the hero or headline image for articles and written works.

Does the legend need to incorporate the actual, specific number of railcars in that status? No, that bit is superfluous because graphics are meant to show, not tell, a visual story or pattern. If the precise number is required, a table suffices. (Or, in this case, three factettes in lieu of the graphic could do the trick.)

Colour-wise the designers opted to eschew the traditional green–red status board and the potential deficiencies for the colour-blind that such a pattern entails. Instead they used a blue–red pattern that not only works in the context of statuses but also calls to the brand colours of the transit agency.

Functionally, the datagraphic is static. And that is perfectly fine—not every online graphic needs to be interactive. Instead of, say, having a dropdown menu to select the data from whatever date the user wants, the article contains a series of posts of the static datagraphic of the day.

Overall, I really like this piece. I just wish we could have seen the inspections completed by the original deadline.

Credit for the piece goes to Erica Palan and Thomas Fitzgerald.


Fun fact no. 1: the datagraphic shows a total of 223 railcars instead of the 225 in the fleet. The editors did a good job calling attention to this and pointing out Septa had previously retired two railcars for unrelated aging issues.

Fun fact no. 2: the Commonwealth’s budget impasse of earlier this year saw Harrisburg moved nearly $400 million from Septa’s capital improvements fund to cover day-to-day operating costs with the vague “promise” the fund will be backfilled at a later date. That $400 million capital improvement fund would have been responsible for things like, say, replacing the Silverliner IVs with new railcars. So for those so inclined, you can blame Harrisburg Republicans for delaying the Silverliner IV’s replacement.


(I do have to say, seeing that gives me flashbacks to the days of posting all my COVID-19 status updates. I had not realised it at the time, but nearly two years of daily posts of deaths burned me out on the regular daily updates here.)

Building New Railways in America

I wasn’t expecting this piece to fall into the queue for today, but you all know me as a sucker for trains. So today we have this nice set of small multiples from the Guardian. It looks at…I guess we could call it train deserts. They’re like food deserts, except we’re talking about trains.

Some of the US train deserts

What strikes me is that in a perfect world at least three of these could be on one direct line. You can almost draw a straight line from Columbus, Ohio to Nashville, Tennessee and hit Louisville, Kentucky. Obviously things like property get in the way, but it is something to note.

Credit for the piece goes to Jan Diehm.

Amtrak Train No. 188 Derails

I am a big fan of trains, rail transit, and Amtrak. I think the rail network connecting the East Coast’s big cities from Boston down to Washington is one of the big draws of the Northeast. Not surprisingly, I have taken that route I don’t know how many times. So, when Amtrak’s Northeast Regional No. 188 derailed in Philadelphia, it ran off rails with which I am familiar.

I made a graphic tonight—so much for all my other plans—charting and mapping out what was announced by Philadelphia’s mayor, Michael Nutter. I am sure that by the time I wake up in the morning, we will know more and some things will have changed. But, let this be a simple guide to the basics as they were Tuesday night.

Updated graphic
Updated graphic

Frankford Junction is in the Port Richmond area of Philly. And what I can attest is that trains do slow down here, because it is a fairly sharp turn at a fairly flat grade (I think).

Credit for the screenshot map image goes to Google.

Hudson River Tunnels

Readers of this blog know that I am a fan of rail travel. And in particular, how the rail system on the East Coast is brilliant when compared to anywhere else in the States. Unfortunately, the railway system on the East Coast is also old and in need of serious capital investment. The tunnels linking New York and New Jersey beneath the Hudson River are a prime example. But a few years ago, Governor Christie of New Jersey killed Amtrak’s plans to build new tunnels to provide a backup to the existing infrastructure and increase overall capacity. The Wall Street Journal takes a look at Amtrak’s new plan to cross the Hudson. Let’s hope this venture is a bit more successful.

The new project
The new project

Credit for the piece goes to the Wall Street Journal graphics department.

North American Transit Map

Wrapping up this week of map-themed work, we have xkcd. He created an integrated map of North America’s subway systems from Vancouver to Chicago to Philadelphia to Washington to Mexico City.

I only wish I could take the Red Line from Belmont and transfer to the Market–Frankford near West Trenton. Because I could then take the (Frankford) El out to 69th Street and catch the 104 to West Chester.

Subways of North America

Credit for the piece goes to Randall Munroe.

Proposed Expansion of Massachusetts Railway Network

When we talk about new rail projects, or even highway or airport expansions, we like to include maps of new routes and destinations. In that sense this map from the New York Times is not new. However, we often forget in such visualisations that we have the opportunity to add layers of information that show why these expansions are beneficial.

Proposed Massachusetts railway network expansion


Here, note in particular how the proposed improvement projects link the dense corridor of urban settlements stretching from Boston through Worcester to Springfield. Additional lines connect more distant southerly cities such as Fall River to Boston. These might normally be seen as dots at ends of a line, but by showing the density of the population in these corridors, readers can understand how the proposed lines might benefit more people than just those living at the dots.

Credit for the piece goes to the New York Times.