Smart Banking Cards

As I noted in my Friday post, I spent last week in Lithuania for work. That same Friday night, I had a conversation with a few coworkers over dinner and a beer about credit cards. They teased me that for all of America’s technological advances and advantages, even in Lithuania they were using more secure forms of bank card payment: chipped cards. And that story seems a perfect segue into today’s post from the Washington Post.

Through a combination of charts, maps, and illustrations—a cropping of which is shown below—the Post details the advantages of using microchipped cards in preventing certain types of fraud. Additionally, because of the integration of the visuals with the written explanations, text can be used to provide longer anecdotes to explain exceptions and outliers when and where necessary.

Cropping of microchipped card story

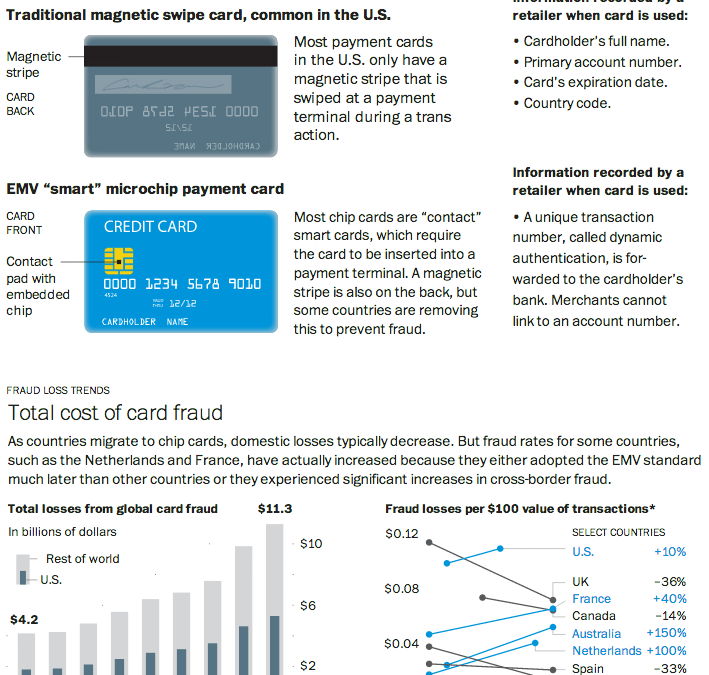
Credit for the piece goes to Todd Lindeman.

Washington’s New Ferris Wheel

This past weekend I was having a discussion with some friends about the height of various Ferris wheels. Specifically we were wondering the height difference between the London Eye and the wheel at Chicago’s Navy Pier. Well, it turns out that Washington, D.C. is preparing to begin construction on its own wheel. Naturally, the Washington Post covered the story with a graphic to compare the Capital Wheel to the London Eye.

The Capital Wheel
The Capital Wheel

And for those wondering about Chicago’s wheel at Navy Pier, well it clocks in at 150 feet. That makes it 25 feet shorter than the Capital Wheel in D.C.

Credit for the piece goes to Richard Johnson.

A Century of Passenger Flight

100 years ago we began to fly commercially. We moved beyond daredevil stunts and novelty and created air travel into a business. To commemorate the history, the Guardian commissioned this interactive graphic story to celebrate said history. It includes charts, narration, and near real-time data on actual flights mapped out as in the introductory element captured below.

Flight
Flight

Credit for the piece goes to Kiln.

Ivory Poaching

The South China Morning Post had a fantastic infographic detailing the hunting of elephants for their ivory. Despite bans to make such hunting illegal, the problem continues and is worsening because of the Asian trade in ivory.

Cropping of the infographic

Credit for the piece goes to Adolfo Arranz.

The Flying V

We all know of the Flying V, the great hockey plan developed in the 1990s—wait, no, wrong one. I meant to talk about birds flying in formation. Because science is finally allowing us to understand the mechanisms of how and why birds fly in these tight, v-shaped formations. In a BBC article reporting on the most recent findings, the graphics team included a diagram showing just how formation flying works.

How the Flying V works

Credit for the piece goes to the BBC graphics department.

Squeezing You Into Your Airline Seat

Airlines want to make flights as profitable as possible. And that largely entails cramming as many people into those hollow cylinders called aircraft fuselages as possible. This is despite advice from Airbus, one of the world’s largest aircraft manufacturers to set a minimum seat width standard greater than US airlines are investigating. Thomson Reuters does a nice job illustrating the changes in this graphic.

Airline seat sizes
Airline seat sizes

Credit for the piece goes to the Thomson Reuters graphics staff.

Traffic Jam on the George Washington

A lot of people have been talking about Bridgegate, a scandal in New Jersey wherein the governor’s office allegedly abused its power to negatively impact the residents of Fort Lee, New Jersey. What actually happened for a few days this past fall? The Washington Post uses aerial photography and illustration to diagram the normal traffic flow and the flow during the traffic “study”.

Traffic on the George Washington Bridge

Credit for the piece goes to the Washington Post graphics department.

The Polar Vortex…Or Not

If you live in the United States, you probably have heard the term polar vortex by now. People have been using the term to describe the bitterly cold temperatures affecting the eastern two-thirds of the country. But the term polar vortex is a meteorological term that means a specific phenomenon. In other words, it’s more than a hashtag along the lines of snowmageddon. The Washington Post explains what the polar vortex is.

The Post explains the polar vortex

My caveat for this piece is that from my understanding, it’s not entirely correct. Or perhaps not detailed enough. In brief, we turn to the National Weather Service out of New York for a more technically correct, but more poorly designed graphic.

National Weather Service explanation

Poor type, poor colours, poor hierarchy. Those are abundantly clear, but the important part is that the NWS wants to correct many of the popular misconceptions. Somewhere between the well-intended but less-than-entirely-clear Post piece and the accurate-but-also-unclear National Weather Service piece is an opportunity to explain the concept to the public.

Credit for the Washington Post piece goes to Bonnie Berkowitz, Richard Johnson, Katie Park, and Gene Thorp.

Credit for the National Weather Service goes to the graphics team at the National Weather Service of New York.

Tracking You While You Text

Today’s post comes from the Washington Post, which looks at further revelations about the NSA surveillance programme. Specifically, the Post details how the NSA tracks Americans by what is called co-traveler analytics. The piece does a really nice job of explaining how the tracking works through illustrative examples.

Tracking via co-traveler analytics

Credit for the piece goes to the Washington Post graphics department.