When Is an Opener Game in Baseball Really Just a Bullpen Game?

Whenever someone not named Eovaldi or Perez starts a Red Sox game in 2020, that’s when.

We all know the Red Sox are the worst team in the American League. They have only two starters, maybe sometimes a third. And then the last two days of the regular five-day rotation cycle, manager Ron Roenicke throws some relievers at the wall and sees which ones stick that night. Spoiler: Few do.

But as much as I enjoy listening to the three-man broadcasting booth (Remy and Eck make the games fun to at least listen to) the games are unwatchable. And then to hear them try and dress a game up as having an opener? Well, what is the opener?

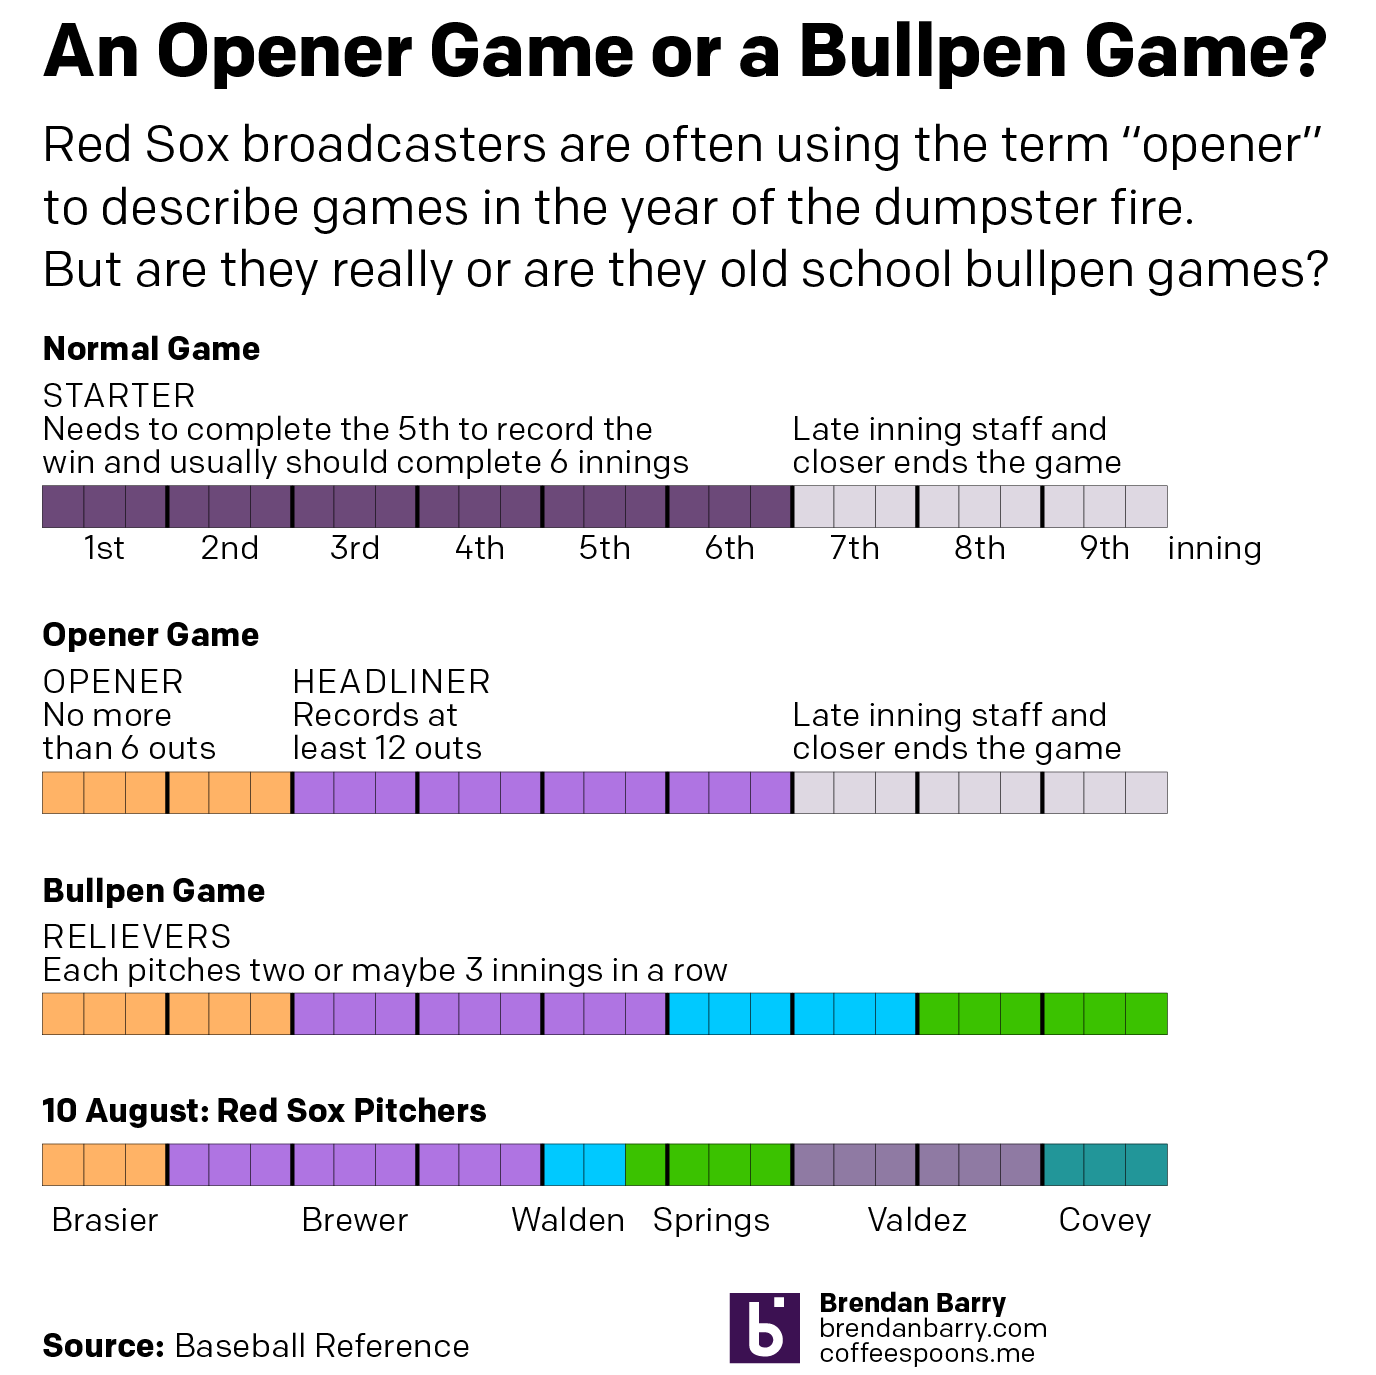
For the non-baseball fans, most are probably aware enough that some guy goes out to a small hill and throws (pitches) a ball at a batter for most of the night. Then towards the end, when the guy’s energy wanes, he is replaced by some guy who throws really fast. That’s over simplified, but that’s a normal ballgame. A starting pitcher records five, but ideally at least six, innings of work before handing the ball over to an eighth-inning setup man and then a ninth-inning closer. Sometimes a really good seventh-inning reliever sets up the setup man.

A bullpen game, by contrast, is when a bunch of those relief pitchers handle the entire game. Usually this would be after a game went into extra innings (since baseball cannot end in a tie, unless you’re in an All Star game), and the next day’s starting pitcher had to finish the long game by pitching several innings. With nobody available to throw six innings, a bunch of relievers come in and try to cover that by pitching one, two, or three innings each.

The opener game is relatively new. The idea is in addition to the really good closer, a really good opener records the first inning or two (3–6 outs) to deal with the opposing team’s best hitters. He then hands the ball over to a mediocre starting pitcher who throws the next four or five innings, who then hands the ball over to the late-inning relief specialists. Doing it this way, the starter avoids one set of at-bats or plate appearances by the opposition’s best hitters.

But when is an opener just a bullpen game? Well, it’s when that mediocre starting pitcher isn’t really a starting pitcher. And when he doesn’t even throw four or five innings. Basically all the Red Sox games this year.

I made a graphic this morning to contrast those different types of games and compare them to a game I watched two nights ago between the Red Sox and the Tampa Bay Rays. The game was teed up as an opener with a good relief pitcher by the name of Ryan Brasier starting the first inning. But then instead of a mediocre starter pitching four or five innings, we got a mediocre reliever pitching three innings. He handed it over to a guy who was supposed to go maybe two, but couldn’t get through his second inning. He handed it over to another guy, who handed it over to another guy, who handed it over to a final guy. And none of those last guys were the good relievers you would typically expect to see. (Though, to be fair, the Sox weren’t winning, so why use your best relievers?)

What is an opener and how does it compare to a bullpen game?
Different game types compared

Credit for the piece is mine.

Credit for the Red Sox dumpster fire of a season goes to John Henry and ownership.

Covid-19 Update: 9 August

Weekend data means, usually, lower numbers than weekdays. And with the exception of Delaware that’s what we have today. Some drops, like Illinois, are more dramatic than others, like New Jersey. And so we look at the seven-day trend.

And that tells a slightly different story. On the one hand we have states like Virginia and Illinois that appear to be continuing upward. The rise in Illinois has been slow and steady, but the average is approaching nearly 2000 new cases per day. In Virgina, the rise was more abrupt and the question is whether this peak has crested in recent days or if come the middle of next week it will resume rising.

In New Jersey and Delaware we see two states with does declines after some sudden spurts of new cases. Jersey had risen to nearly 500 new cases less than two weeks ago, but that’s now back down to fewer than 350. And in Delaware, while today’s number is greater than yesterday’s, the trend is still downard after being at over 100 new cases per day two weeks ago.

New cases curves for Pennsylvania, New Jersey, Delaware, Virginia, and Illinois.

Then we have Pennsylvania. At one point doing it had done so well in controlling the outbreak to bend the curve to fewer than 500 new cases per day at one point. Then as the state began to reopen, cases began to rise again in the west and now the east. But over the last week that statewide average began to fall. But in the last two days that fall appears to have potentially bottomed out. So come the middle of next week, the question will be does the downward trend continue or has the state hit a new valley before another rise?

Finally, in terms of new deaths, with the exception of Virgina, we have yet to see any rise in deaths that might correlate with the recent rises in new cases. And so nothing new there. But it’s worth pointing out that New Jersey has now reached the high single digits in terms of daily deaths from Covid-19. That’s remarkable for a state that back in April saw nearly 300 people dying every single day.

New death curves for Pennsylvania, New Jersey, Delaware, Virginia, and Illinois.

Credit for the graphics is mine.

Covid-19 Update

As I mentioned last week, I am going to try using my blog here for the weekly update on the five states people have asked me to explore. And for the second week in a row, we are basically seeing numbers down compared to previous days. But given that numbers are generally lower on the weekends, that is not terribly surprising.

The real question is by Friday, will these numbers have rebounded?

The Covid-19 curves for PA, NJ, DE, VA, and IL
The Covid-19 death curves for PA, NJ, DE, VA, and IL.

Credit for these graphics is mine.

What Will the Next Recovery Look Like?

Earlier this morning, the Bureau of Economic Analysis released its US 2nd quarter GDP figures and the news…isn’t great. On an annualised basis, we saw -32.9% growth. That’s pretty bad. Like Great Depression level bad. I’ve posted on the social media how bad this current recession is and how nobody in the workforce today worked or didn’t through the Great Depression to really relate to the numbers we are seeing.

But that’s all today. The sun will come out tomorrow. (And scorch the Earth as climate change renders certain parts of the globe uninhabitable to mankind. But we’ll get to those posts in later weeks.) And when it does come out, eventually, what will the recovery look like? I’ve seen a few mentions recently in the media of a V-shaped recovery. What is this mysterious V-shape?

A long time ago, in a galaxy far away. Or during the last recession in Chicago, I worked with some really smart people in some of my professional projects and we covered the exact same question. There are a couple key “shapes” to an economic recovery. And when we say recovery, we mean just to return to pre-recession peak levels of growth. Anything above that is an expansion. That’s what we want to get back to.

What kind of shape will the recovery take?
Who knew typographers loved economics?

The V-shape we hear a lot about is a sharp recovery after the economy bottoms out (the trough). Broadly speaking, if a recession has to last two consecutive quarters (it doesn’t, but that’s a pretty common definition so let’s stick with it), then in a V-shape, we are talking about a recovery one or two quarters later.

Similar to the V is the W-shape, where things start to improve rapidly, but some kind of shock to the economic system and things go back negative once again before finally picking up quickly. It’s not hard to imagine something going horribly wrong with the Covid-19 pandemic to be just that external shock that could push the economy back down again.

Similar still is the U-shape. Here, after hitting rock bottom, growth isn’t quite as quick to pick up as we linger in the depths of the valley of recession. But after a bit of time, we again see a rapid recovery to pre-recession levels of growth.

These are all pretty short term recoveries, the W being a little bit longer because two sharp downturns. But they are nothing compared to what’s also possible.

First we have the L-shape. Here, after hitting bottom, things start to recover quickly. But that recovery is slow and takes a long time. Growth remains slower than average, creeping up to average, and then still takes its time to reach pre-recession levels. Is something like this possible? Well, if vaccines fail and if some countries still can’t get their act together (cough, US, cough), the willingness of consumers to go out, eat, drink, buy things, travel, and generally make merry could be suppressed for a long time. So it’s certainly not out of the question.

And then lastly we have the UUUU-shape. Though you could probably add or subtract a U or two. This features more drawn out stays at the bottom of the valley with quick and sharp upticks in growth. But those growths, never reaching pre-recession levels, also collapse quickly back into declines, though also never really reaching the same depths as earlier. Essentially, the recovery faces multiple setbacks knocking the economy back down as it sputters to life. As with the L-shape, it’s also not hard to imagine a world where a country hasn’t managed to contain its outbreak struggling to get back on its feet.

What do you think? Are we at rock bottom? Did I miss a recovery type?

Credit for the graphic is mine.

Sunday’s Covid Numbers

I do not want this blog to become a permanent Covid-19 data site. So in my push to resume posting last week, I tried to keep to from posting the numbers and instead focused on discussing how the data is displayed.

But I hear from quite a few people via comments, DMs, emails, and text messages that they find the graphics I produce helpful. So on the blog, I’m going to try posting just one set of graphics per week. Will it always be Monday? I don’t know. On the one hand, new week, new data. But on the other, weekend numbers tend to be lower than the rest of the week and could make it seem like, yay, the numbers are starting to go down especially if you only come to my blog and only see this data once a week.

Daily cases and their rolling average for Pennsylvania, New Jersey, Delaware, Virginia, and Illinois
Daily new cases
Daily new deaths and their rolling average for Pennsylvania, New Jersey, Delaware, Virginia, and Illinois.
Daily new deaths

So yeah, we’ll see how this goes. And I’ll try to keep Tuesday–Friday to discussing the world of data visualisation, although in these days, a good chunk of it will likely revolve around Covid.

Credit for these graphics is mine.

Corona Curves

It’s Friday. I’d normally say something like we’ve survived this far, but the fact of the matter is that thousands have not. But, still, let’s try to keep it a little light. So here’s something from xkcd about the shape of the various curve potentials for Covid-19.

PA seems to be somewhere around Scenario 2.

Credit for the piece goes to Randall Munroe.

Wednesday’s Covid-19 Data

Here we have the data from Wednesday for Covid-19.

The situation in Pennsylvania

Pennsylvania saw continued spread of the virus. Notably, Monroe County in eastern Pennsylvania passed 1000 cases. It was one of the state’s earliest hotspots. That appears to have been because it was advertised as a corona respite for people from New York, not too far to the east and by then in the grips of their own outbreak.

The situation in New Jersey

New Jersey grimly passed 5000 deaths Wednesday. And it is on track to pass 100,000 total cases likely Friday or Saturday. Almost 2/3 of these cases are located in North Jersey, with some South Jersey counties still reporting just a few hundred cases and a handful of deaths.

The situation in Delaware

Delaware passed 3000 cases and Kent Co. passed 500. While those don’t read like large numbers, keep in mind the relatively small population of the state.

The situation in Virginia

Virginia has restarted reporting deaths, this time at the county level and not the health district level. What we see is deaths being reported all over the eastern third of the state from DC through Richmond down to Virginia Beach. In the interior counties we are beginning to see the first deaths appear. And in western counties, we still see that the virus has yet to reach some locations, but counties are beginning to report their first cases.

The situation in Illinois

Illinois continues to suffer greatly in the Chicago area, and at levels that dwarf the remainder of the state. However, the downstate counties are beginning to see spikes of their own. Macon and Jefferson Counties each saw increases of 30–40 cases in just 24 hours.

Preview(opens in a new tab)

How about those curves?

A longer-term look at the states shows how the states diverge in their outbreaks. Pennsylvania looks like it might be forcing the curve downward whereas New Jersey appears to have more plateaued. Earlier I expressed concern about Virginia, which does now appear to have not peaked and continues to see an increasing rate of spread. Then we have Illinois, which may have plateaued, but we need to see if yesterday’s record amount of new cases was a blip or an inflection point. And in Delaware a missing day of records makes it tricker to see what exactly the trend is.

Credit for the piece is mine.

Covid-19 Data from Monday

Monday’s Covid-19 data for Pennsylvania, New Jersey, Delaware, Virginia, and Illinois provided a glimmer of good news, most notably in Pennsylvania. That, however, occurred on the same day as a protest in Harrisburg that could set the state back days if not weeks. More on that below.

The situation in Pennsylvania

Pennsylvania saw fewer than 1000 new cases for the first time since 1 April. The curve here may be doing more than flattening, but it might actually be falling. That is to say the infection rate is decreasing rather than stabilising and holding steady, as it appears to be doing in New Jersey. That said, new cases are appearing sporadically in the rural and less dense areas of the state. Problematically, protestors arrived in Harrisburg to let it be known they are unhappy with the quarantine. Because the rest of us are.

The problem is that it appears a significant percentage of those infected with the virus are asymptomatic carrier, i.e. they are sick, but do not show any symptoms like fever, coughing, difficulty breathing. Critically, they may not appear sick, but they can spread the sickness. And so a gathering of several hundred people in close quarters? Not ideal.

Compare that to a Christian cultish church in Daegu, South Korea. There, an infected parishioner did not heed government calls to isolate and instead attended a church service. The average infected person spreads this virus to two or three people. This congregant? They infected 43 people who then went on to infect other people.

It is quite possible that someone in that Harrisburg protest was an asymptomatic carrier. And given the lack of social distancing, the lack of masks, and the general reckless behaviour, it is quite possible that the rally could be a super-spreading event. But we won’t know for 5–10 days, the apparent incubation period of the virus. Hopefully we dodge the proverbial bullet. But it is quite easy to see how these kinds of protests could lead to surges in infections. And those surges would then force the government to extend its quarantine by weeks thereby defeating the entire point of the protestors.

We get it. Quarantine sucks. But we all have to suck it up.

The situation in New Jersey

Moving on to New Jersey, where we see continuing evidence of the plateauing of cases. The bulk of the cases remain in the north in the New York suburban counties with the fewest numbers in the counties in South Jersey. However, averages of nearly 3500 new cases daily remains quite high and the death toll of 4377 is likely to continue to climb higher, even if Monday’s 175 new deaths was lower than most days in recent weeks.

The situation in Delaware

Delaware is back to reporting its figures. And in that release, we had Sussex County in the south climb above 1000 total cases. The levels or curves chart at the end will also show how the state might be flattening and stabilising its infection rate, but we will need several days of uninterrupted reporting to make that determination.

The situation in Virginia

Virginia might be worrying. Or it might not be. Cases continue to increase in the big metropolitan counties like Fairfax and Henrico. But, there are still several counties out in the west that remain unaffected. And the curves chart at the end shows how there has not yet been any sort of even a near-exponential growth curve. Instead we just see a steady, slow increase in the number of cases. That in its own way makes it more difficult to see when the curve flattens, because it was already a relatively flat curve.

The situation in Illinois

Illinois continues to be the tale of two states: Chicago vs. everywhere else. The combined Chicago and Cook County have over 20,000 total cases and the surrounding counties add a few thousand more, which gets you over 2/3 of the state’s 31,000 cases. That said, new cases and new fatalities are beginning to pop up in downstate counties.

Looking at the curves

Lastly a look at the curves. As I noted above when talking about Pennsylvania, you can clearly see the downward slope of the state’s new cases curve. Compare that to the plateau-like shape of New Jersey. Delaware and Illinois might be approaching a New Jersey-like curves. But I would want to see more data and in Delaware less volatility. But like I said, Virginia is a tricky one to read.

Credit for the pieces is mine.

Sunday’s Covid-19 Data

Here is a look at the data from Sunday’s releases on the COVID-19 outbreak in Pennsylvania, New Jersey, Virginia, and Illinois. I’ve omitted Delaware because they paused reporting on Sunday to move to a noontime release instead of their previous end-of-day.

I’m not exactly certain what that means for the data on Delaware and reporting time series. But, my guess is that will be more like a hole in the time series. I need to spend some time looking at that. But, anyways, on to the states for which we did have data on Sunday.

The situation in Pennsylvania

Pennsylvania continues to see growth in cases, but as we’ll get to with the levels, that appears to at least be stabilising. But in the spread of the outbreak, we are beginning to see the T of the state, that more rural and less densely populated area, beginning to fill in with cases. These are of course the areas of concern, the areas with shuttered rural hospitals, lack of comparatively developed infrastructure, where the impacts could be proportionately more severe than in the bigger cities. In terms of deaths, they have now spread almost across the state from east to west. I am still waiting until two adjacent counties connect before I make that final pronouncement.

The situation in New Jersey

For New Jersey, I have removed the orange outlines around each county. The initial idea was to show where deaths had occurred. But now that they have been reported in every county, they don’t seem to be as helpful as the small number I provide in the graphic. Regardless, 4200 deaths is a lot. But the approximately 200 new deaths is the lowest number reported in several days.

The situation in Virginia

Virginia is a weird state. When we see the levels chart below, you will see how its uptick has been far more gradual, and to this point it does not yet appear to have peaked or begun to stabilise. Most of the reported cases continue to be in and around the state’s big cities, notably the DC metro area, but also Richmond.

The situation in Illinois

Illinois has now seen cases from north at the Wisconsin border all the way south to Cairo. Most cases remain, however, concentrated in the Chicago metropolitan area, with lesser scale outbreaks occurring in the Quad Cities area and the suburban counties of Illinois this side of the Mississippi. Deaths continue to rise, and while most area again in the Chicago area, they are appearing increasingly at low levels in downstate counties.

But what about the curves?

But what about those curves? Excepting Delaware, which hasn’t reported new data, we can see that some states like Virginia continue to see increasing rates of infection. Others like New Jersey and Pennsylvania clearly have flattened and have entered a new phase. In New Jersey’s case it appears to be more of a stabilised plateau. In Pennsylvania, there was some evidence it was entering a declining rate phase, but that may now have begun to become more of a steady rate of infection like in New Jersey. Illinois is tough to read because of the variability of its data. It might be more of a pause in the rate of increase, or it may have begun to stabilise. We need more data.

Credit for the pieces is mine.

Monday Covid-19 Data

The data from Monday provided yet more evidence that the outbreak is flattening in several states. However, in some, the outbreak continues to pick up steam. Does this runs contrary to the idea that as a country is flattening? Not necessarily, but it is important to remember that a country that spans a continent and holds 330 million people will experience the pandemic differently at different times. So some states like Washington will be first, and others will be last.

Our five states cover the range of worsening to stabilising. We hope that those stabilising states soon enter the improving phase. Though to beat the dead horse, I would add that just because a state is improving doesn’t mean we can all go back to life like we knew it two months ago. That would likely result in us being right back here shortly thereafter.

The situation in Pennsylvania

Pennsylvania continues to be a state where the pandemic is spreading within the denser metropolitan areas of Philadelphia and Pittsburgh, leaving the central T to see fewer cases that spread more slowly.

The situation in Delaware

Delaware might be approaching an inflection point, given that its most populous county, New Castle, is about to reach 1000 cases. (By the end of today it likely will if its new case trend holds.) We know that deaths lag new cases, and so the worry is that the number of deaths will begin to increase rapidly. The hope is that the slow initial growth of the outbreak will have left hospitals able to better cope over the longer time frame than if everyone had gotten sick all at once.

The situation in Virginia

Virginia is a state that we will contrast to New Jersey, which I will write about last. Because Virginia is a state where it appears the outbreak is beginning to pick up steam and accelerate, rather than flatten. There was the significant drop in cases on Sunday, but that was due to the state’s enhancement of reporting data. (Their website now includes many new statistics.) But just like that the Monday data showed over 450 new cases on Monday. The question will be whether or not over the remainder of the week those new case numbers fall from over 450 to less than 400 to show that the state can flatten the curve before the outbreak becomes especially severe.

The situation in Illinois

Illinois has shown a lot of variability in its day-to-day numbers, hence the advantage of the rolling average. But even that has appeared a wee bit jagged. It’s tough to see the curve flattening just yet, but if we receive updates today and over the next few days that cases are consistently lower, than we might just be able to say the curve is flattening.

The situation in New Jersey

And of course in New Jersey we have a state where the curve really and truly has flattened. We have yet to see sustained evidence of a decline in the number of new daily cases. As I said before, this might be more a situation where the outbreak has stabilised and roughly the same number of new cases is being reported daily. Of course the hope is that whatever that rate is falls below the excess capacity threshold of the state’s hospitals.

But I also want to take a look at the state of New Jersey with a degree of granularity. Because, as I noted with Virginia above, not all states are at the same point in their outbreak. And the same can hold true within states. We know that the outbreak in New Jersey began in the north and was very late in reaching some parts of South Jersey. So the same metrics we run for the state, we can run for the counties—though the data I have been collecting from the states only goes back as far as St. Patrick’s Day.

New Jersey's curves
New Jersey’s curves

The northern counties, where the state has been hardest hit, have clearly begun to see the curve bend. But in the south the story is a bit more mixed. Some, like Burlington and Ocean, have seen the curve noticeably flatten. But in Camden and Mercer Counties, home to Camden and Trenton, respectively, the evidence is not quite there. Instead, in these populous counties there exists the very real possibility that the outbreak will continue accelerating for hopefully a very short while.

Credit for the pieces is mine.