The data from Monday provided yet more evidence that the outbreak is flattening in several states. However, in some, the outbreak continues to pick up steam. Does this runs contrary to the idea that as a country is flattening? Not necessarily, but it is important to remember that a country that spans a continent and holds 330 million people will experience the pandemic differently at different times. So some states like Washington will be first, and others will be last.
Our five states cover the range of worsening to stabilising. We hope that those stabilising states soon enter the improving phase. Though to beat the dead horse, I would add that just because a state is improving doesn’t mean we can all go back to life like we knew it two months ago. That would likely result in us being right back here shortly thereafter.

Pennsylvania continues to be a state where the pandemic is spreading within the denser metropolitan areas of Philadelphia and Pittsburgh, leaving the central T to see fewer cases that spread more slowly.
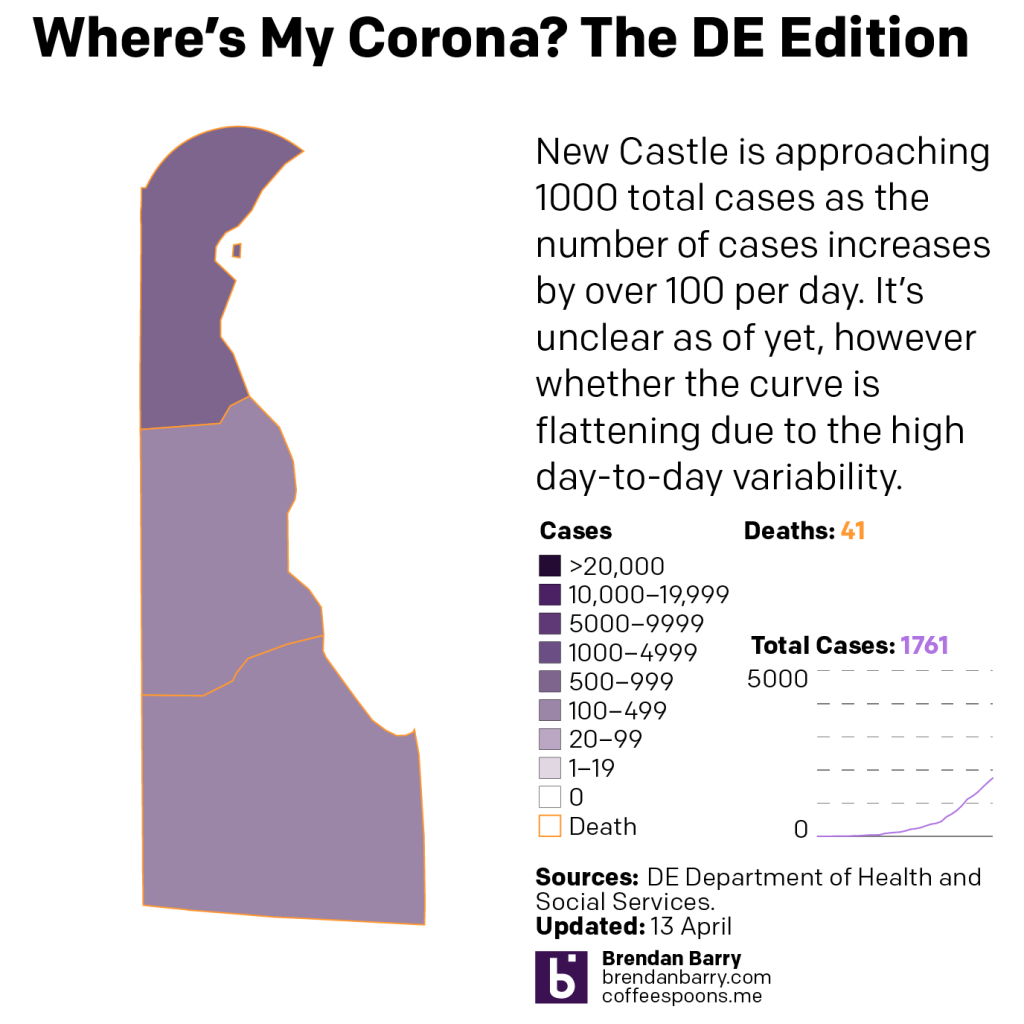
Delaware might be approaching an inflection point, given that its most populous county, New Castle, is about to reach 1000 cases. (By the end of today it likely will if its new case trend holds.) We know that deaths lag new cases, and so the worry is that the number of deaths will begin to increase rapidly. The hope is that the slow initial growth of the outbreak will have left hospitals able to better cope over the longer time frame than if everyone had gotten sick all at once.

Virginia is a state that we will contrast to New Jersey, which I will write about last. Because Virginia is a state where it appears the outbreak is beginning to pick up steam and accelerate, rather than flatten. There was the significant drop in cases on Sunday, but that was due to the state’s enhancement of reporting data. (Their website now includes many new statistics.) But just like that the Monday data showed over 450 new cases on Monday. The question will be whether or not over the remainder of the week those new case numbers fall from over 450 to less than 400 to show that the state can flatten the curve before the outbreak becomes especially severe.
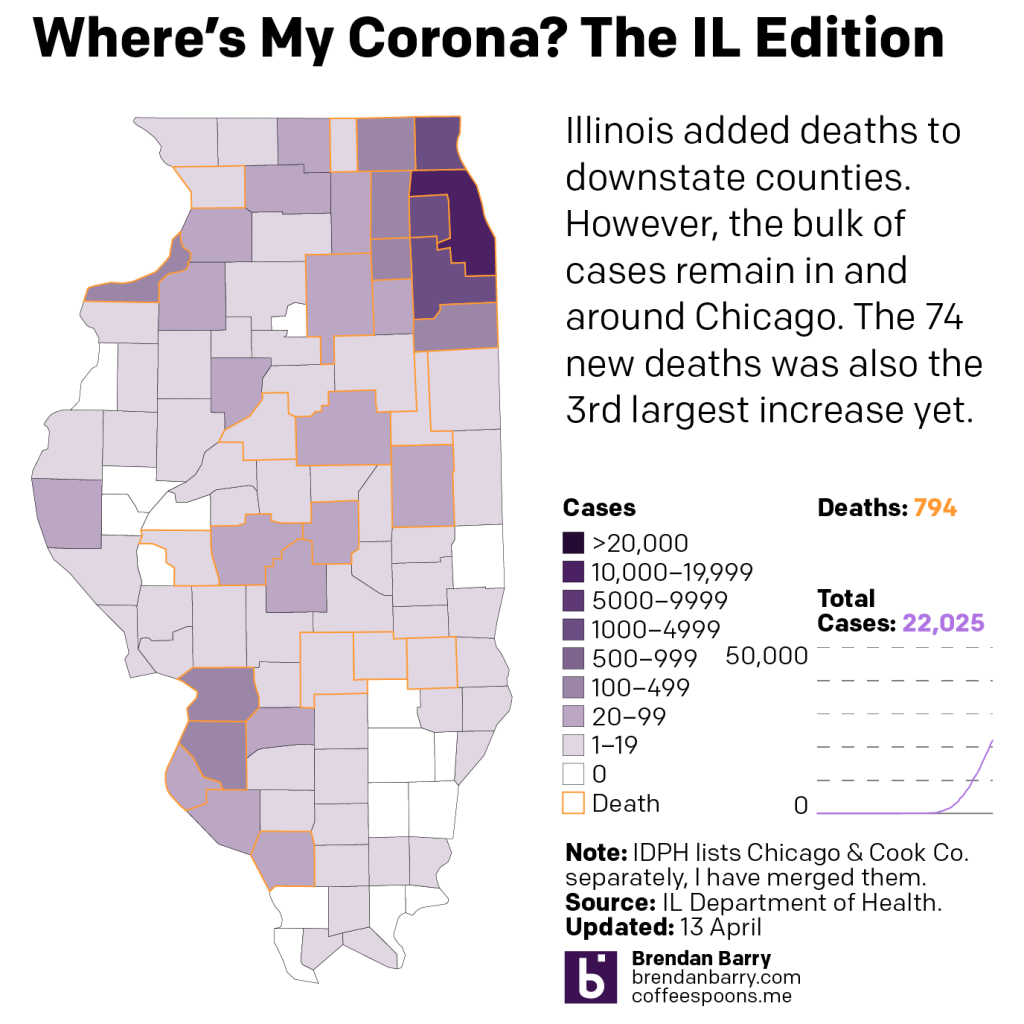
Illinois has shown a lot of variability in its day-to-day numbers, hence the advantage of the rolling average. But even that has appeared a wee bit jagged. It’s tough to see the curve flattening just yet, but if we receive updates today and over the next few days that cases are consistently lower, than we might just be able to say the curve is flattening.
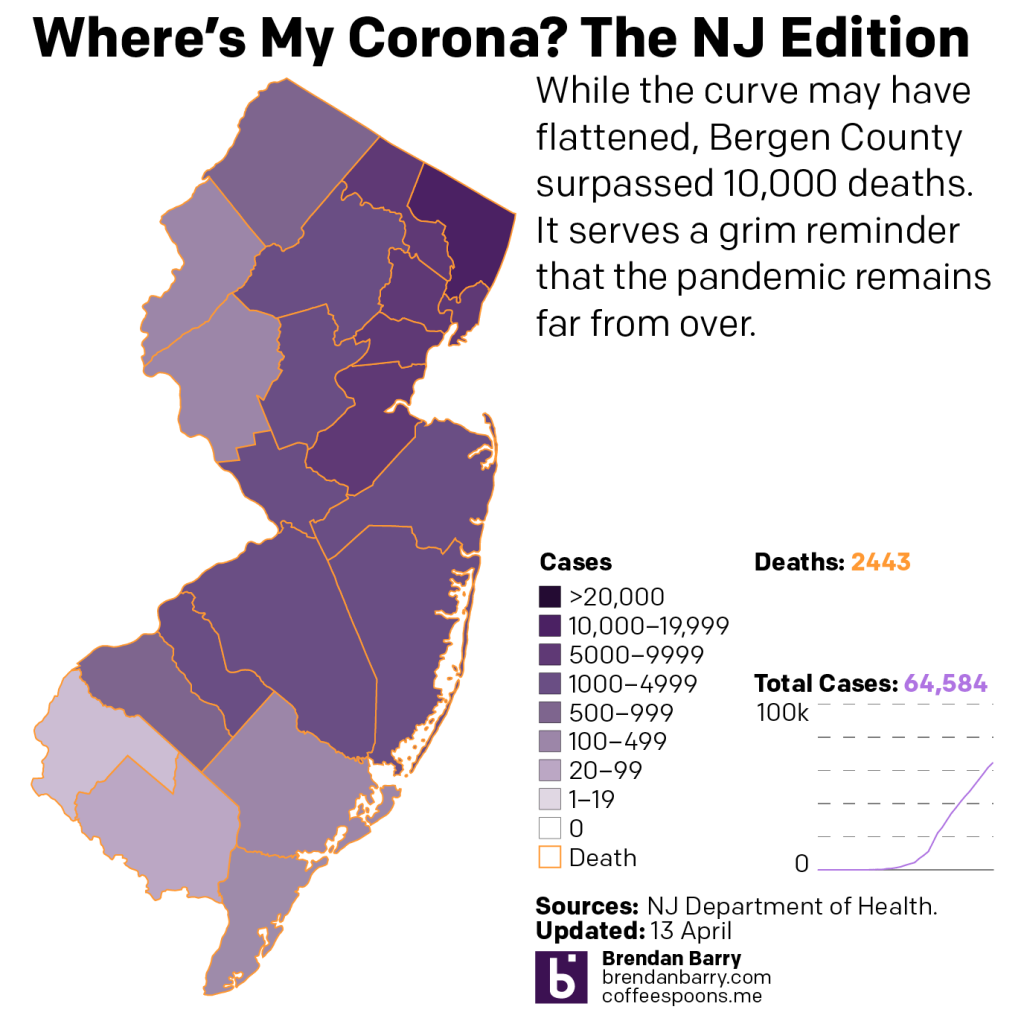
And of course in New Jersey we have a state where the curve really and truly has flattened. We have yet to see sustained evidence of a decline in the number of new daily cases. As I said before, this might be more a situation where the outbreak has stabilised and roughly the same number of new cases is being reported daily. Of course the hope is that whatever that rate is falls below the excess capacity threshold of the state’s hospitals.
But I also want to take a look at the state of New Jersey with a degree of granularity. Because, as I noted with Virginia above, not all states are at the same point in their outbreak. And the same can hold true within states. We know that the outbreak in New Jersey began in the north and was very late in reaching some parts of South Jersey. So the same metrics we run for the state, we can run for the counties—though the data I have been collecting from the states only goes back as far as St. Patrick’s Day.
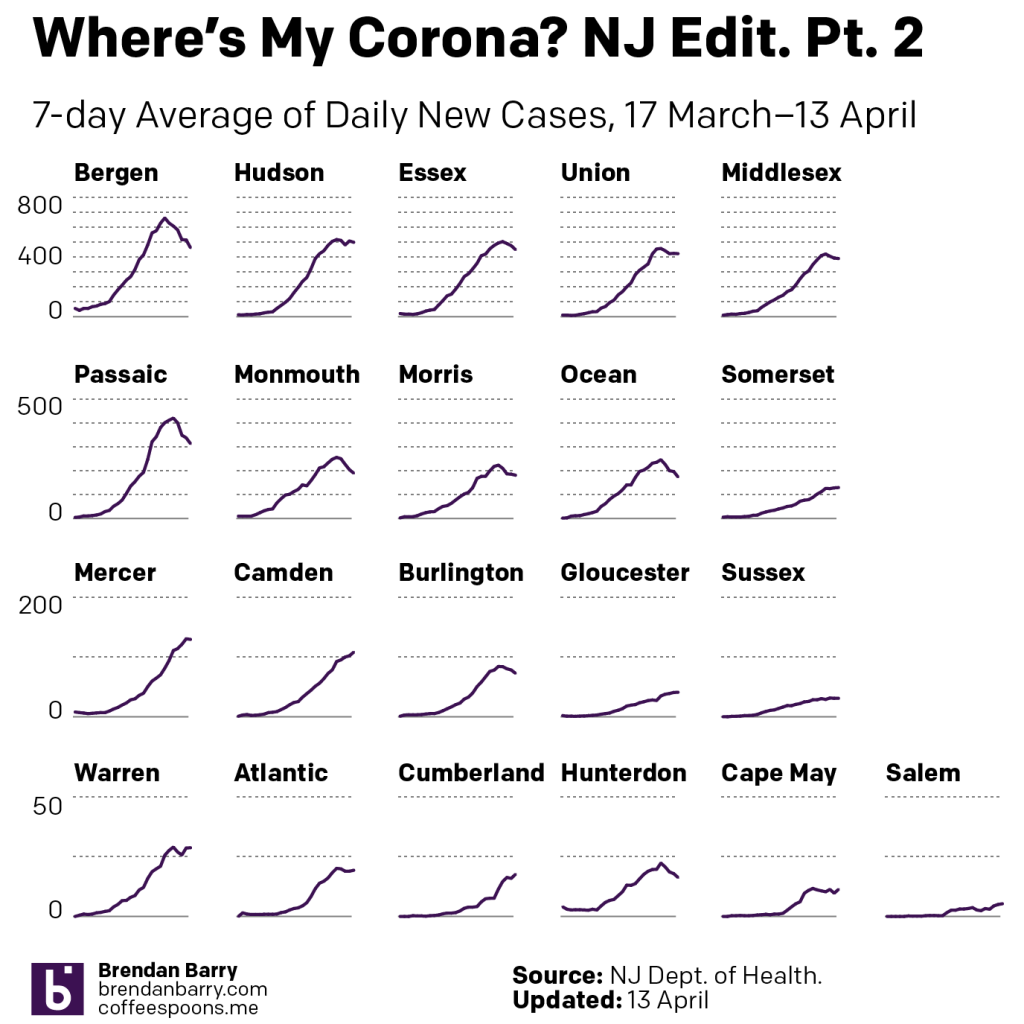
The northern counties, where the state has been hardest hit, have clearly begun to see the curve bend. But in the south the story is a bit more mixed. Some, like Burlington and Ocean, have seen the curve noticeably flatten. But in Camden and Mercer Counties, home to Camden and Trenton, respectively, the evidence is not quite there. Instead, in these populous counties there exists the very real possibility that the outbreak will continue accelerating for hopefully a very short while.
Credit for the pieces is mine.
