Category: My Work
-
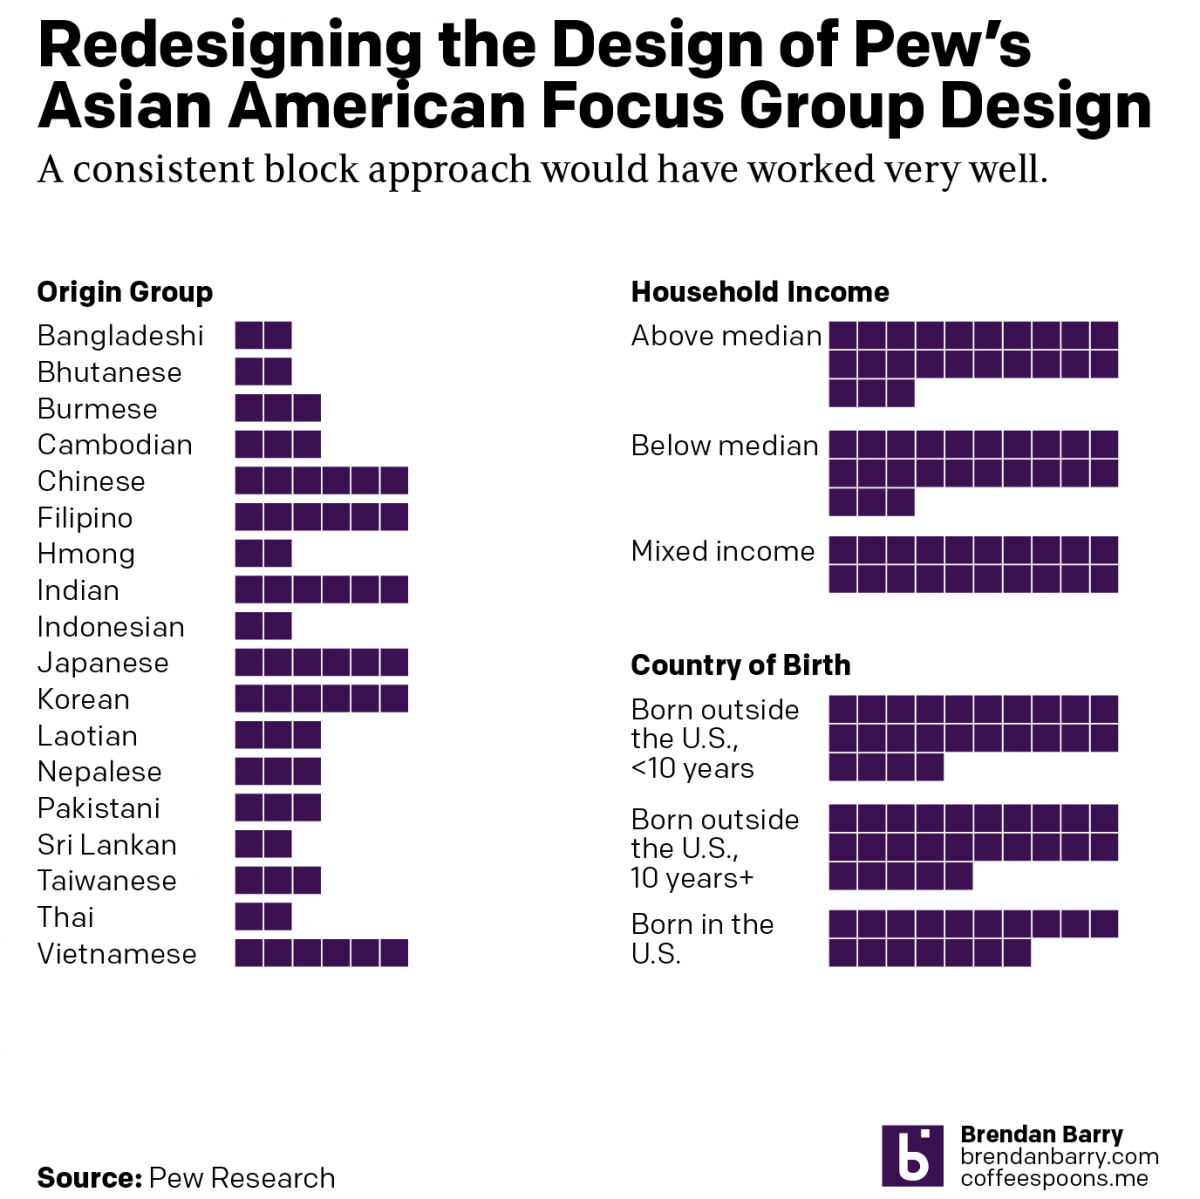
What It Is to be Asian American
Pew recently released a report into the Asian American experience. The report used 66 different focus groups to gather feedback and then summarised that with quotes, video bits, and lots of text. But at the beginning of the report was a nice little graphic that detailed the composition of the focus groups. This is not…
-
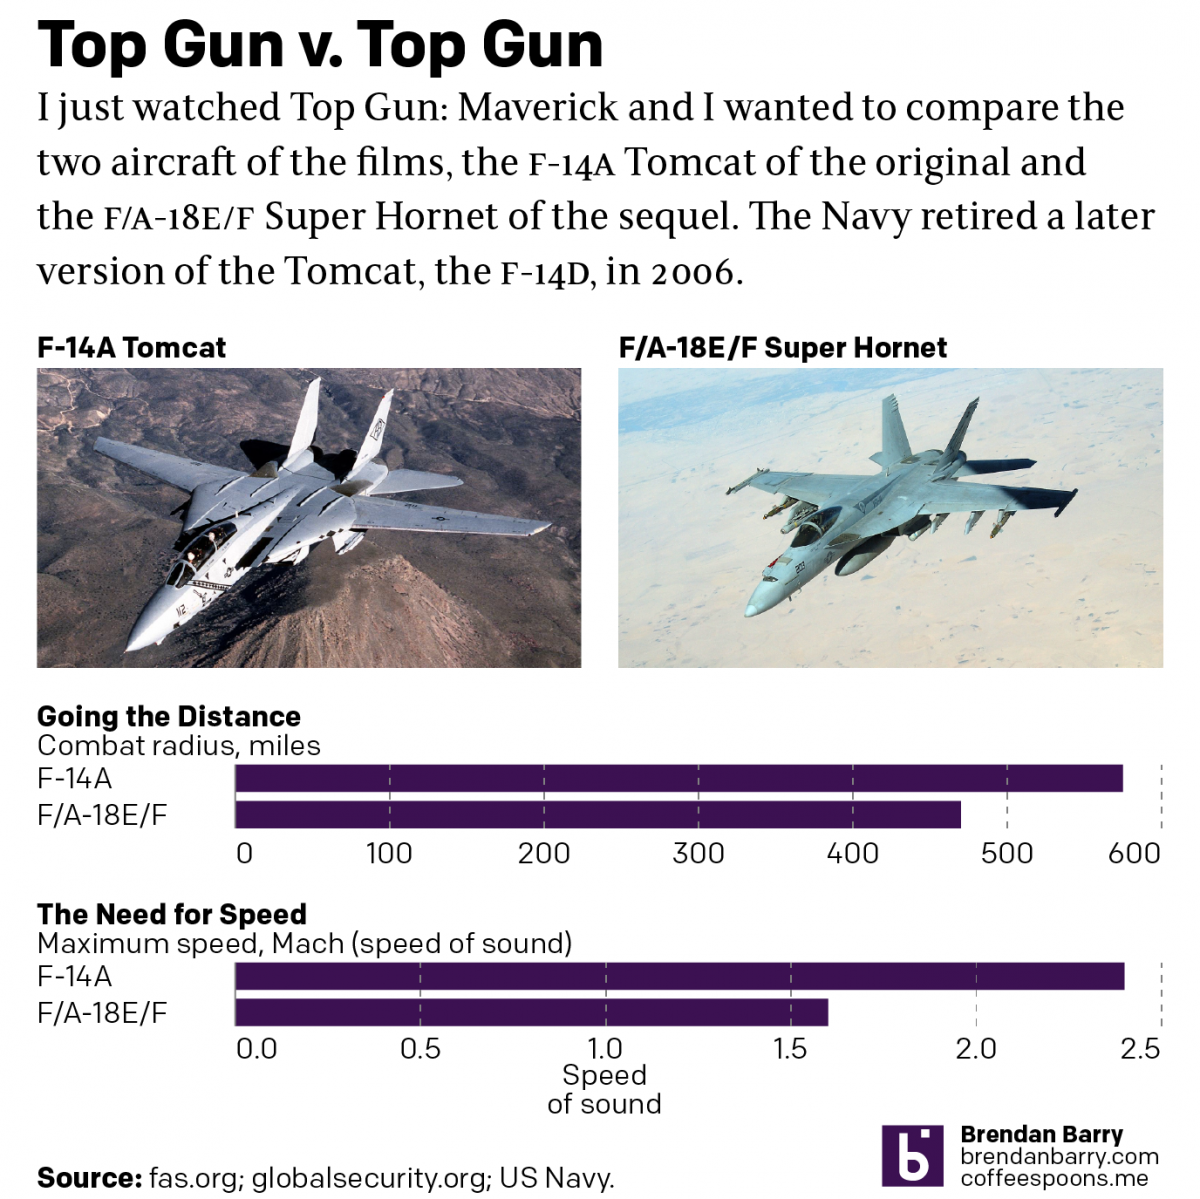
Top Gun
Last night I went to see Top Gun: Maverick, the sequel to the 1986 film Top Gun. Don’t worry, no spoilers here. But for those that don’t know, the first film starred Tom Cruise as a naval aviator, pilot, who flew around in F-14 Tomcats learning to become an expert dogfighter. Top Gun is the…
-
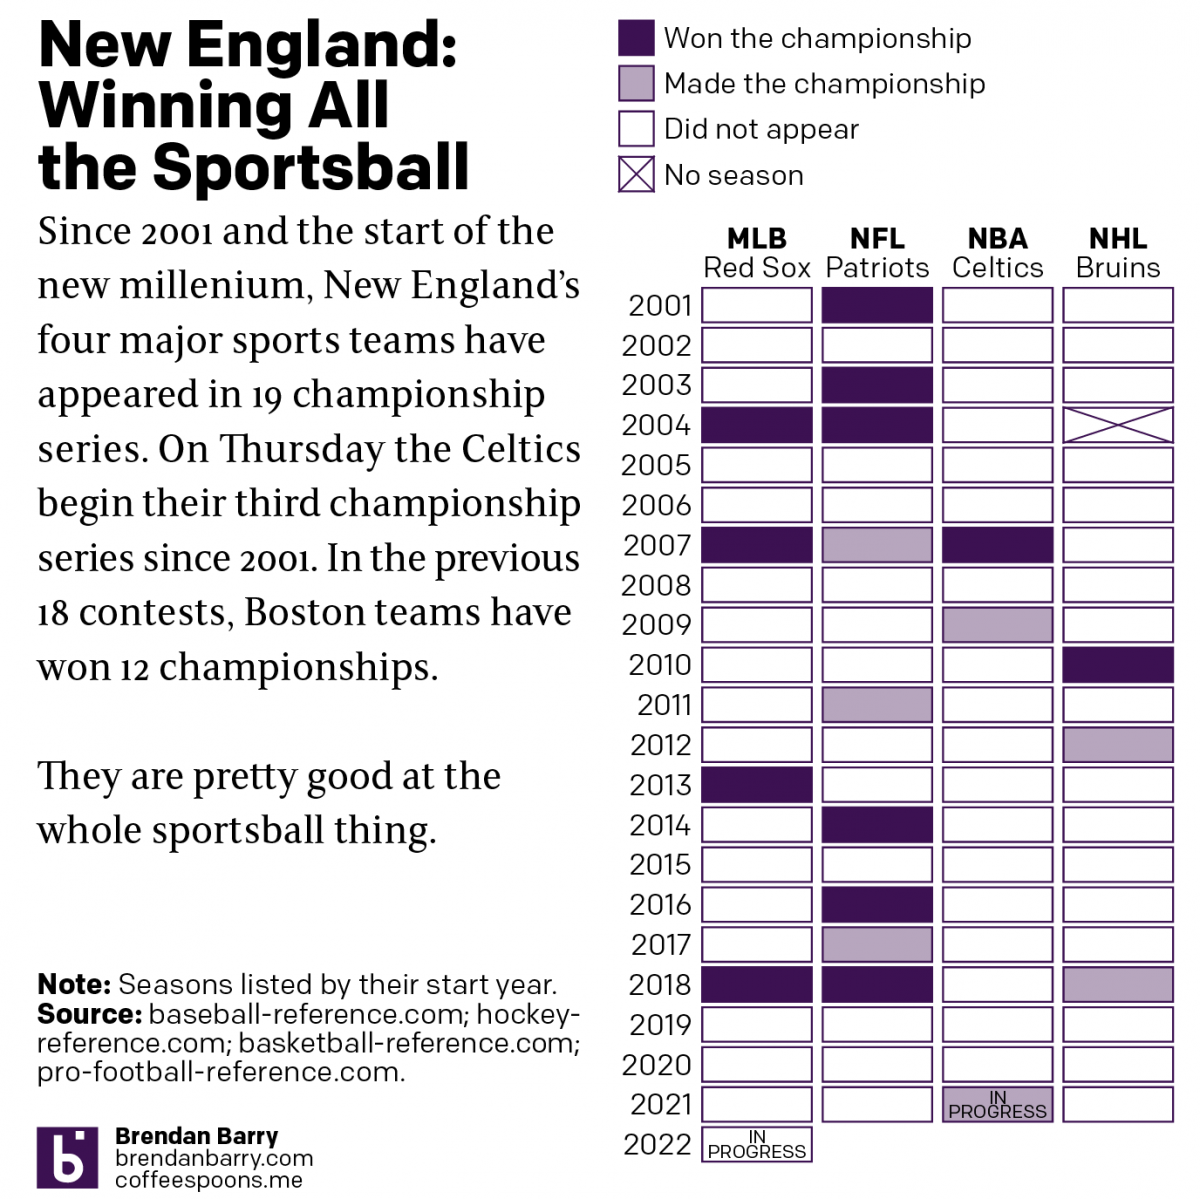
Boston: Sportstown of the 21st Century
Tonight the Boston Celtics play in Game 1 of the NBA Finals against the Golden State Warriors, one of the most dominant NBA teams over the last several years. But since the start of the new century and the new millennium, more broadly Boston’s four major sports teams have dominated the championship series of those…
-
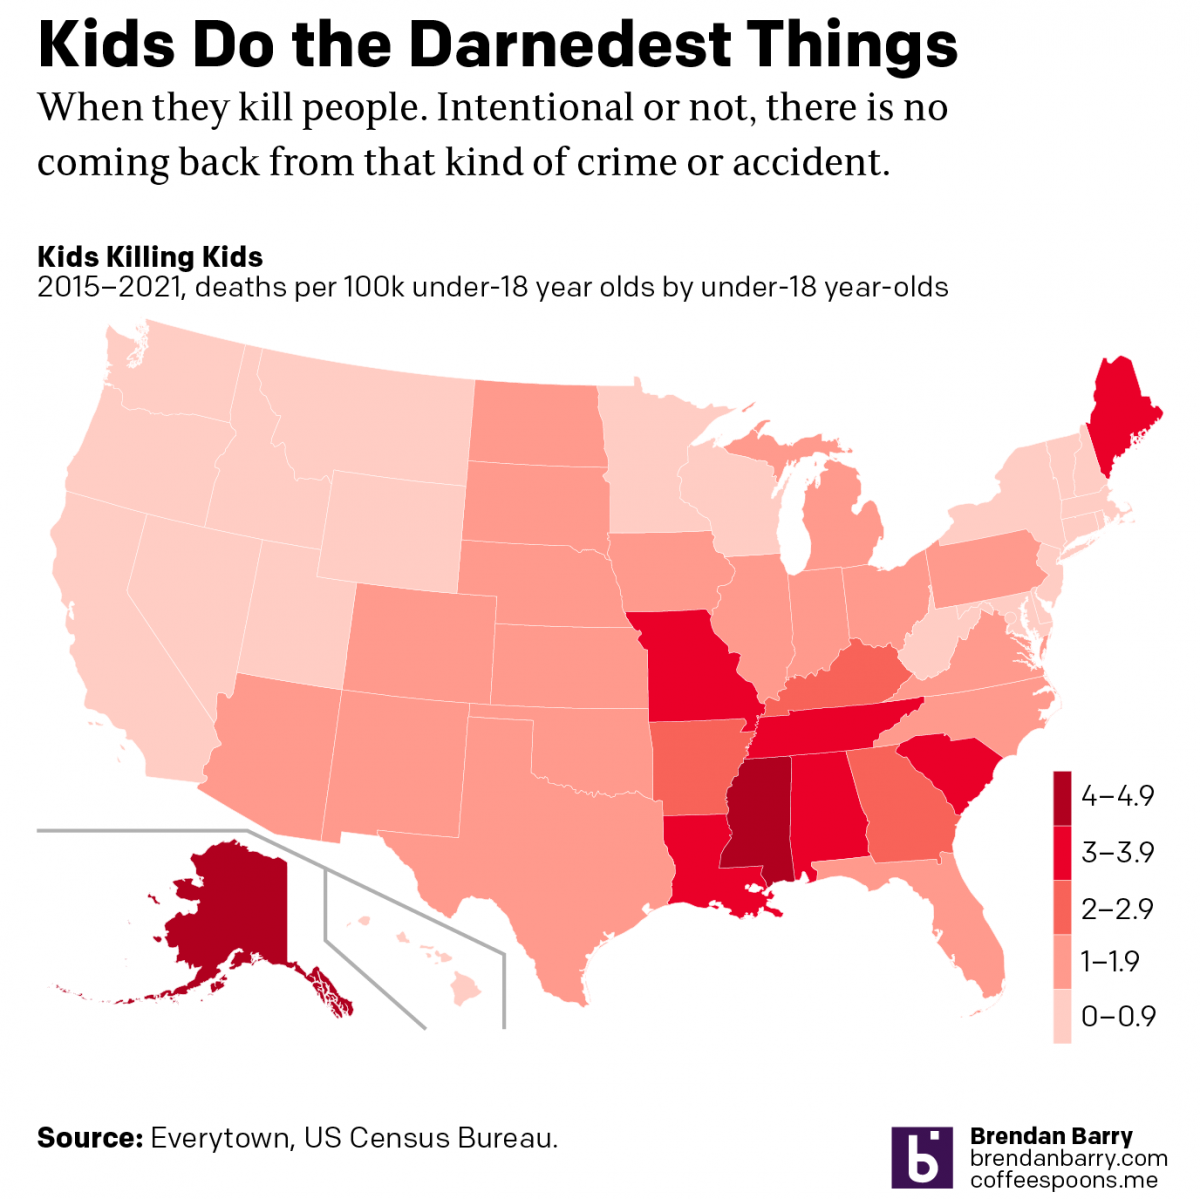
Kids Do the Darnedest Things: Shoot Other Kids
Last month, a 2-year old shot and killed his 4-year old sister whilst they sat in a car at a petrol station in Chester, Pennsylvania, a city just south of Philadelphia. Not surprisingly some people began to look at the data around kid-involved shootings. One such person was Christopher Ingraham who explored the data and…
-
Political Hatch Jobs
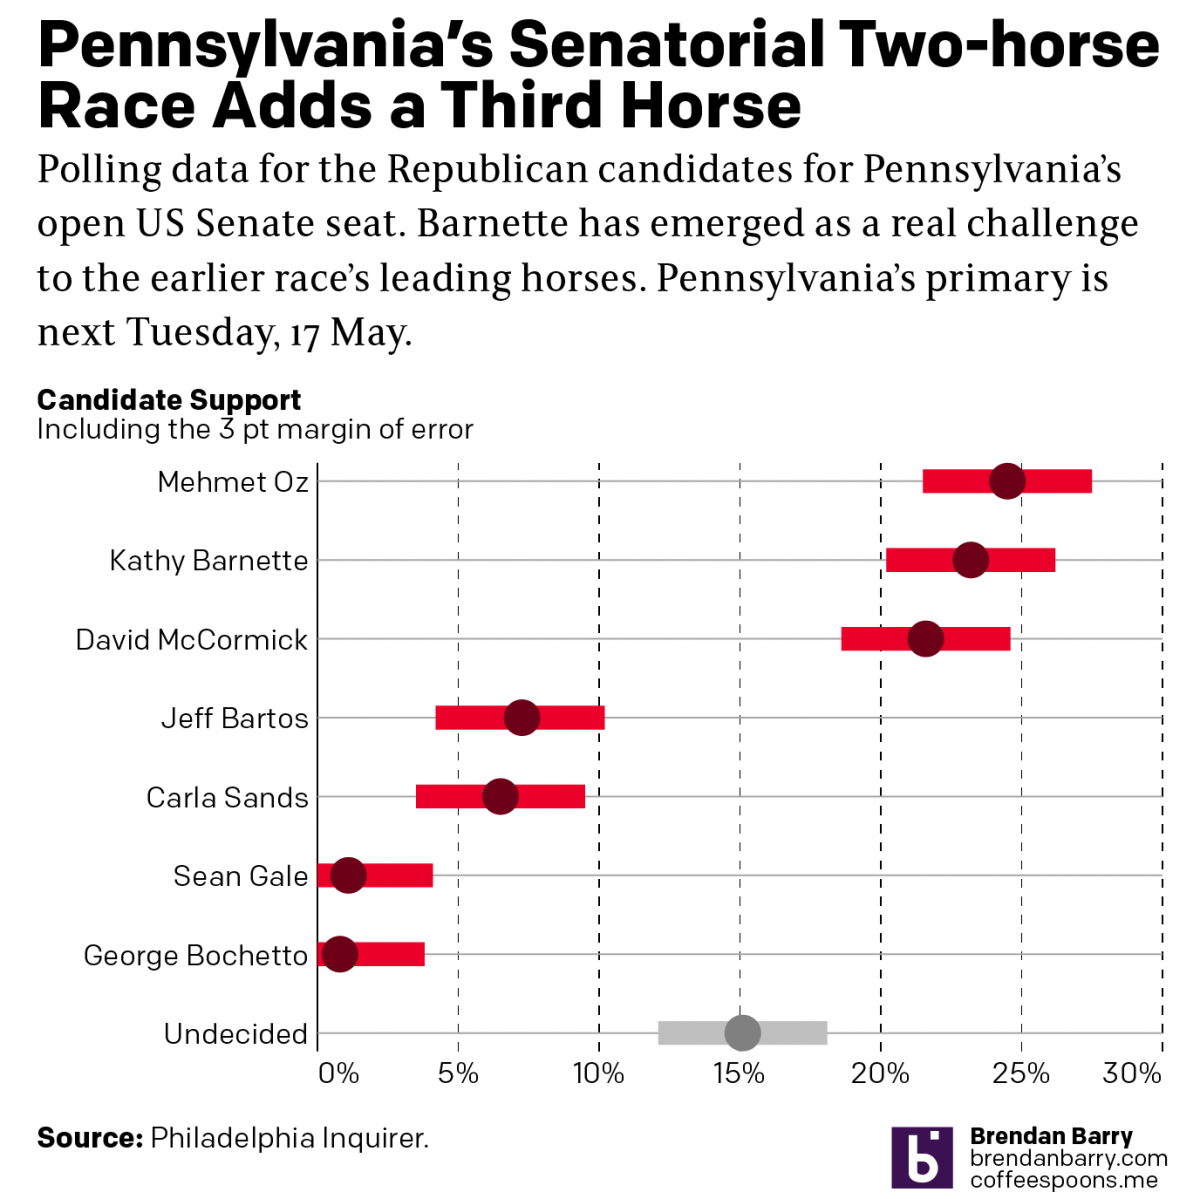
Earlier this week I read an article in the Philadelphia Inquirer about the political prospects of some of the candidates for the open US Senate seat for Pennsylvania, for which I and many others will be voting come November. But before I get to vote on a candidate, members of the political parties first get…
-
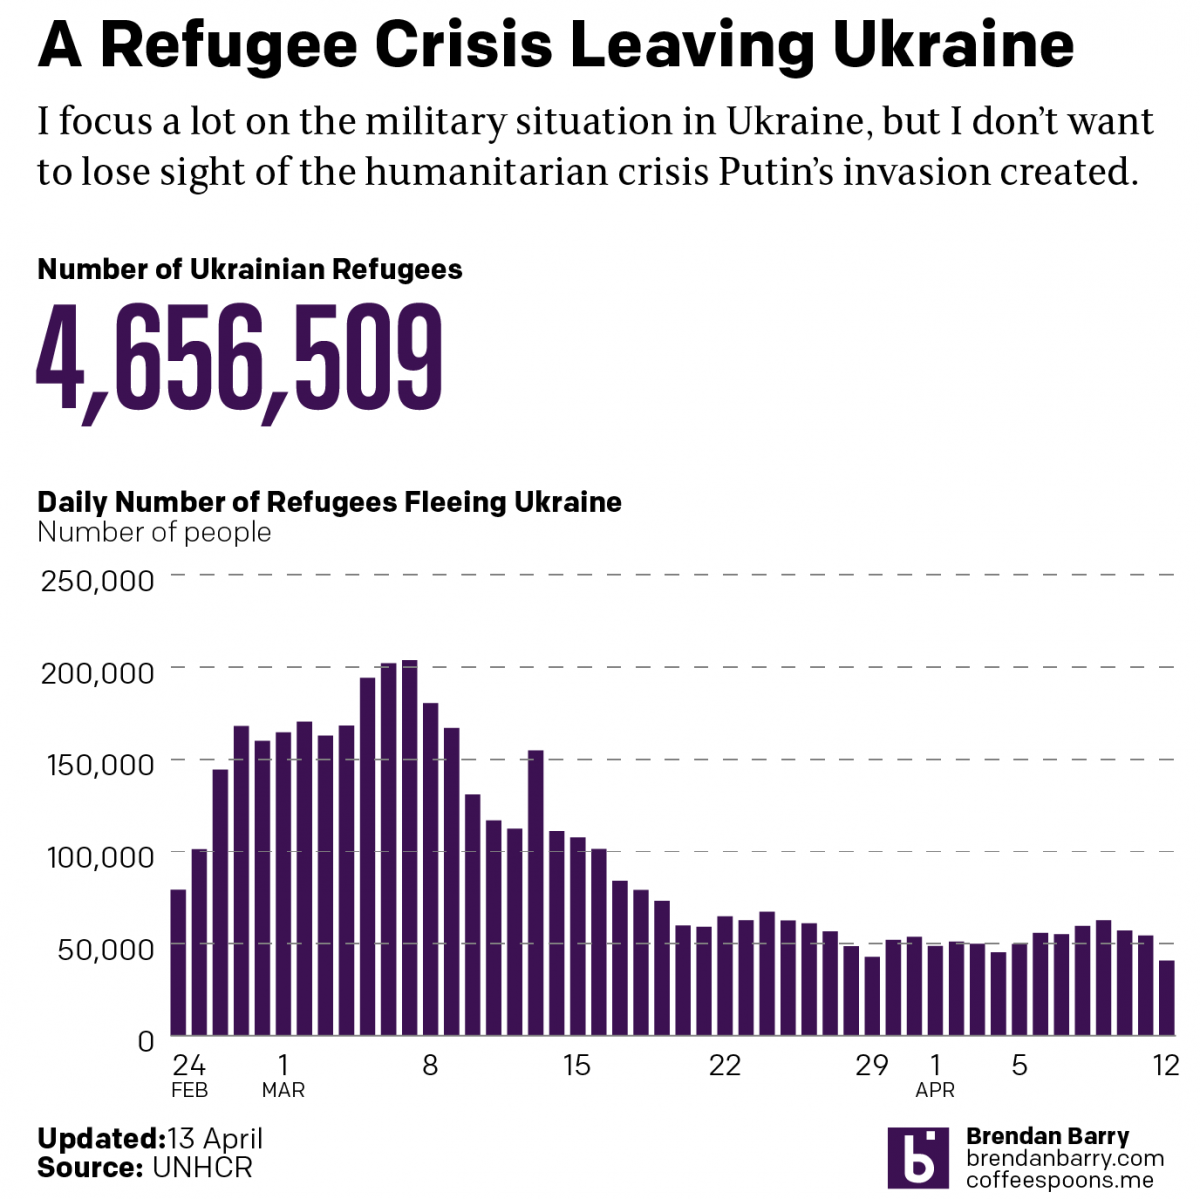
Russo-Ukrainian War Refugees: 12 April
Another week, more combat and refugees in Ukraine. I’m going to try and hold the war update until tomorrow pending some news that hasn’t been confirmed yet: the fall of Mariupol. Instead, we’re going to again look briefly at the refugee situation in Ukraine—technically outside. I haven’t seen a recent number on the internally displaced,…
-
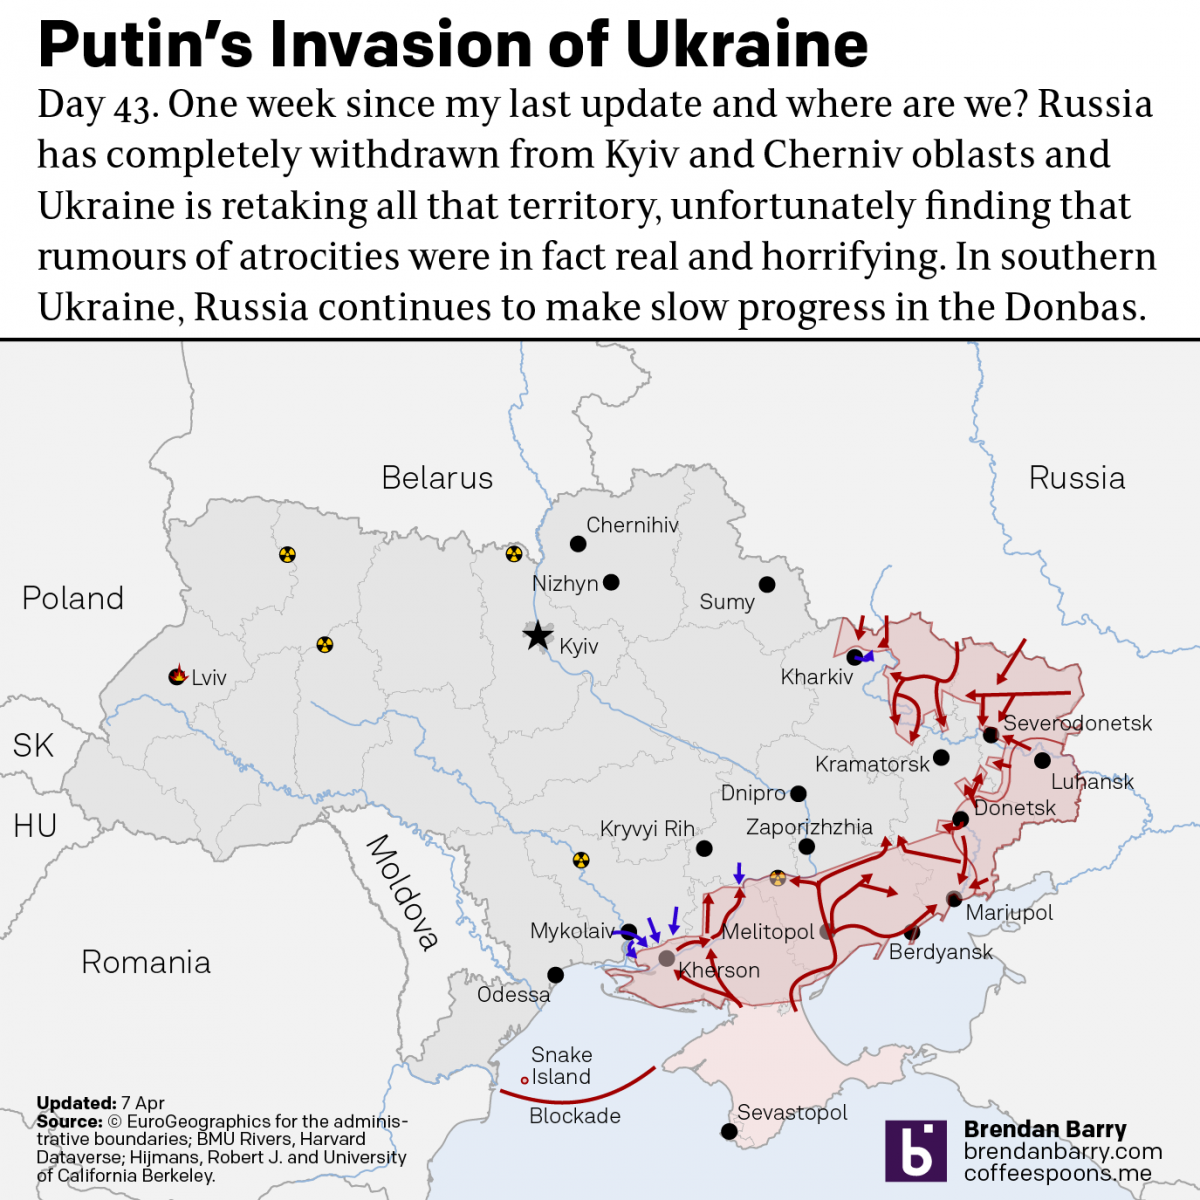
Russo-Ukrainian War Update: 6 April
It’s been a week since my last update and that’s in part because a lot has changed. When we last spoke, the Russians had announced they had successfully completed the first phase of the “special military operation”. They didn’t. Instead, Russian forces have completed a full-on retreat from northern Ukraine, sending troops and equipment back…
-
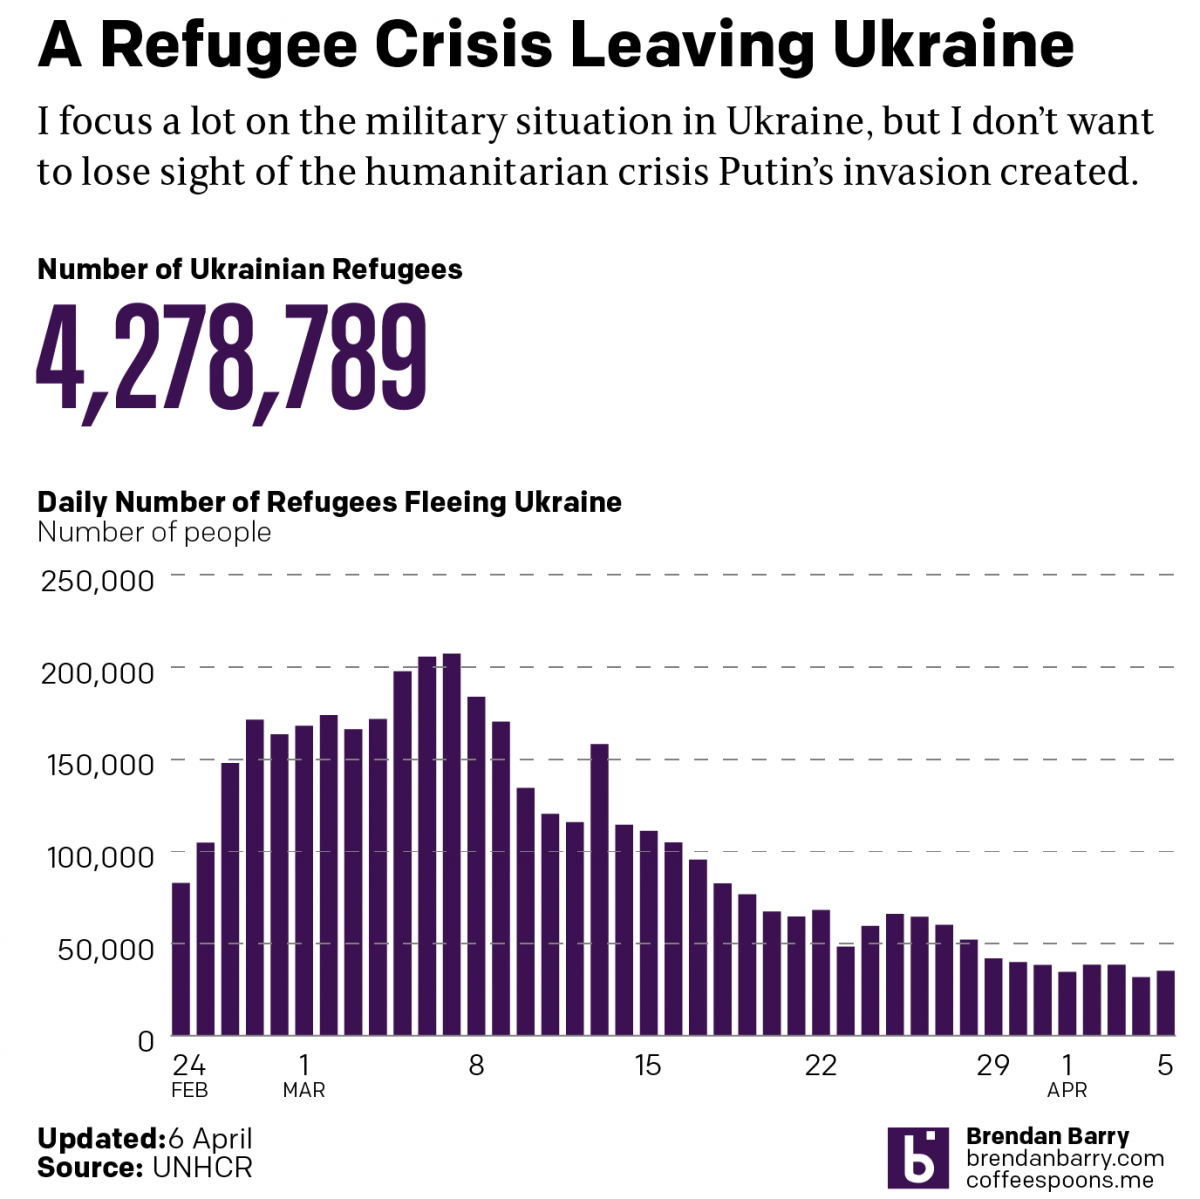
Russo-Ukrainian War Refugees: 5 April
Just a quick update as I try to update my battle map. Today we’re taking another look at the refugee crisis Putin created in eastern and central Europe. Over four million Ukrainians have left Ukraine and millions more have been displaced internally within Ukraine. Whilst we may hope they will eventually return home, the photos…
-
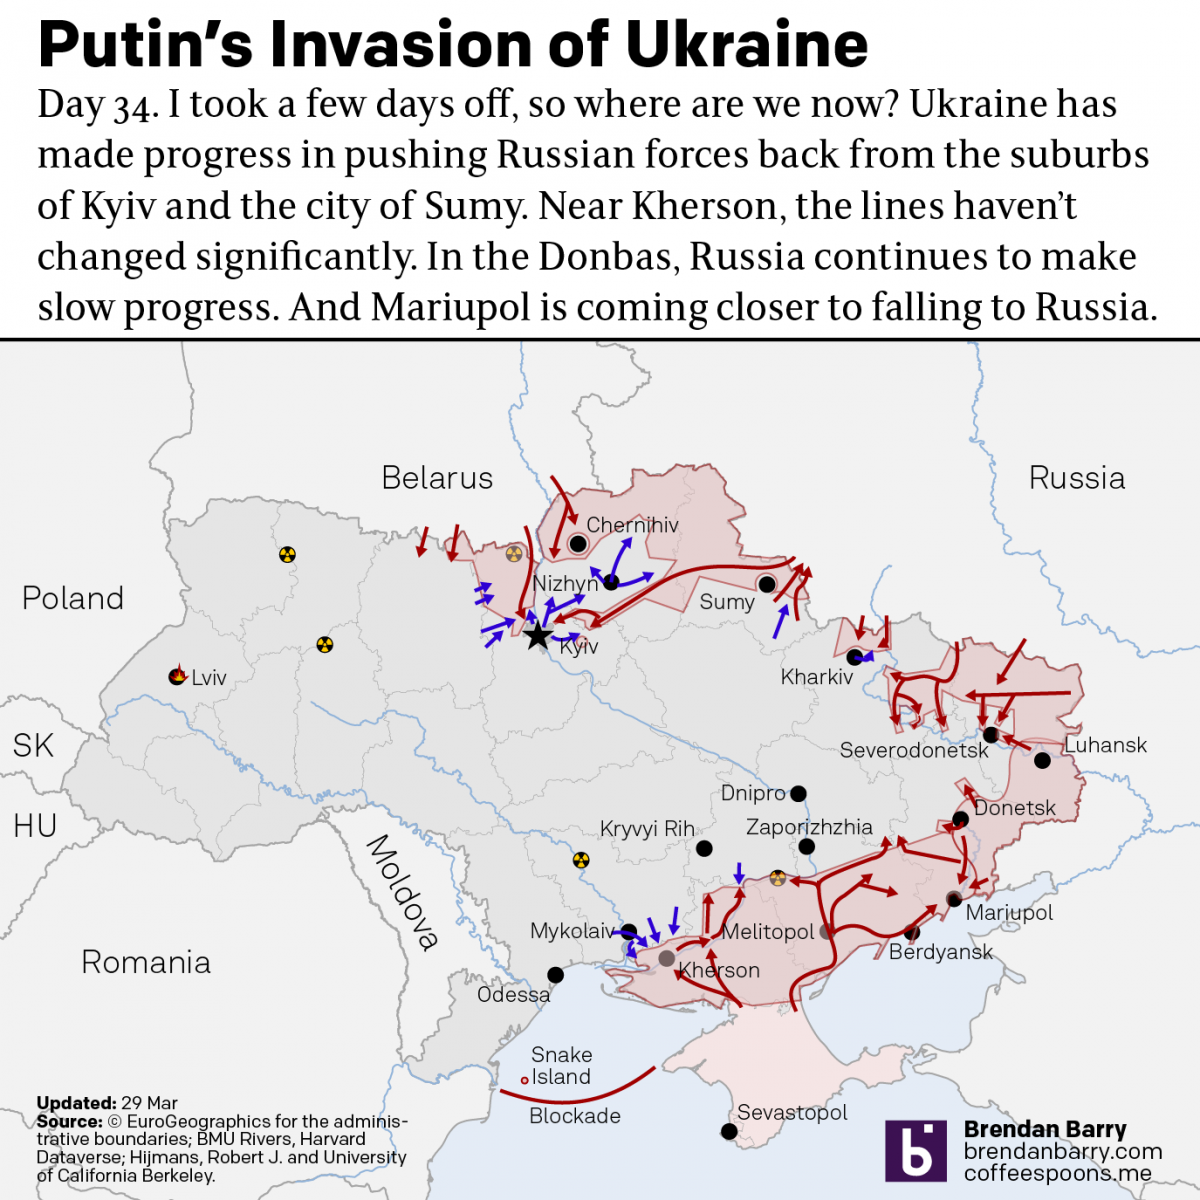
Russo-Ukrainian War Update: 29 March
I took a few days off from covering the war in Ukraine. Now it’s time to jump back in and catch up on things. Putin and his generals have declared the first phase of his “special military operation” over and that it was a success. They claimed that their goal was never the capture of…
-
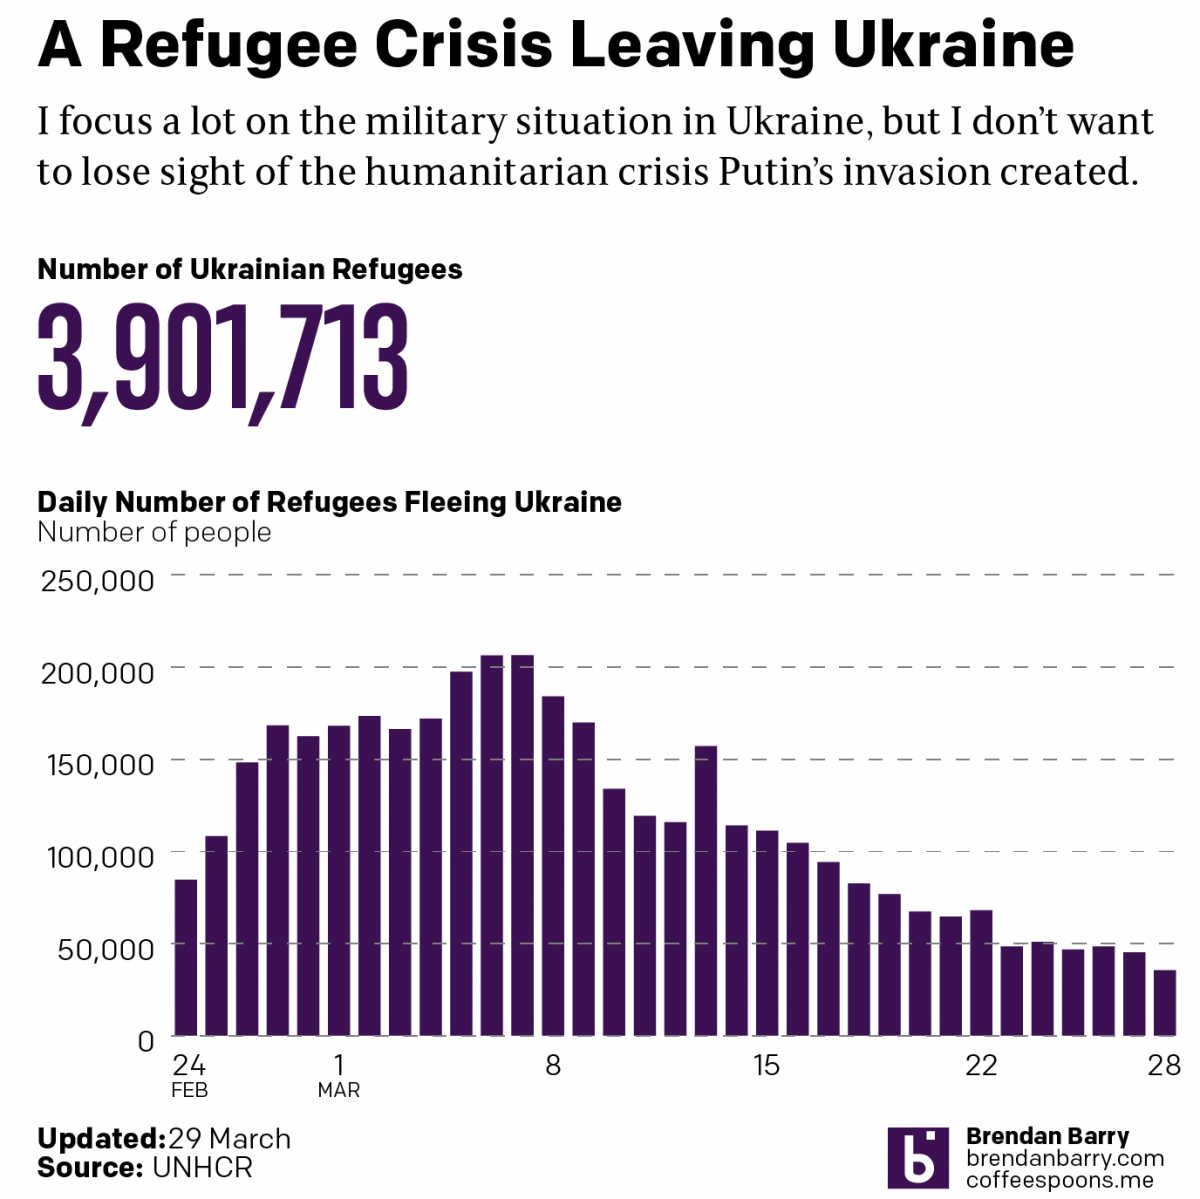
Russo-Ukrainian War Refugees
This data took far longer to clean up than it should have. And for that reason I’m going to have to keep the text here relatively short. We still see tens of thousands of refugees fleeing Putin’s war in Ukraine. Although, we are down from the peaks early on in this war. In total, nearly…