I know that I typically post more light-hearted content on Fridays. But after taking a holiday Monday and my internet being down all day yesterday—fun fact, trying to type up a blog post on my mobile is…well suffice it to say I am glad that it is only an emergency backup plan—we are going to enter the weekend with some updates on the spread of Covid-19 in Pennsylvania, New Jersey, Delaware, Virginia, and Illinois.
A little over a week ago I wrote about the emergence of slight upticks in our region of coverage. Nine days hence, those slight upticks are no longer so slight.
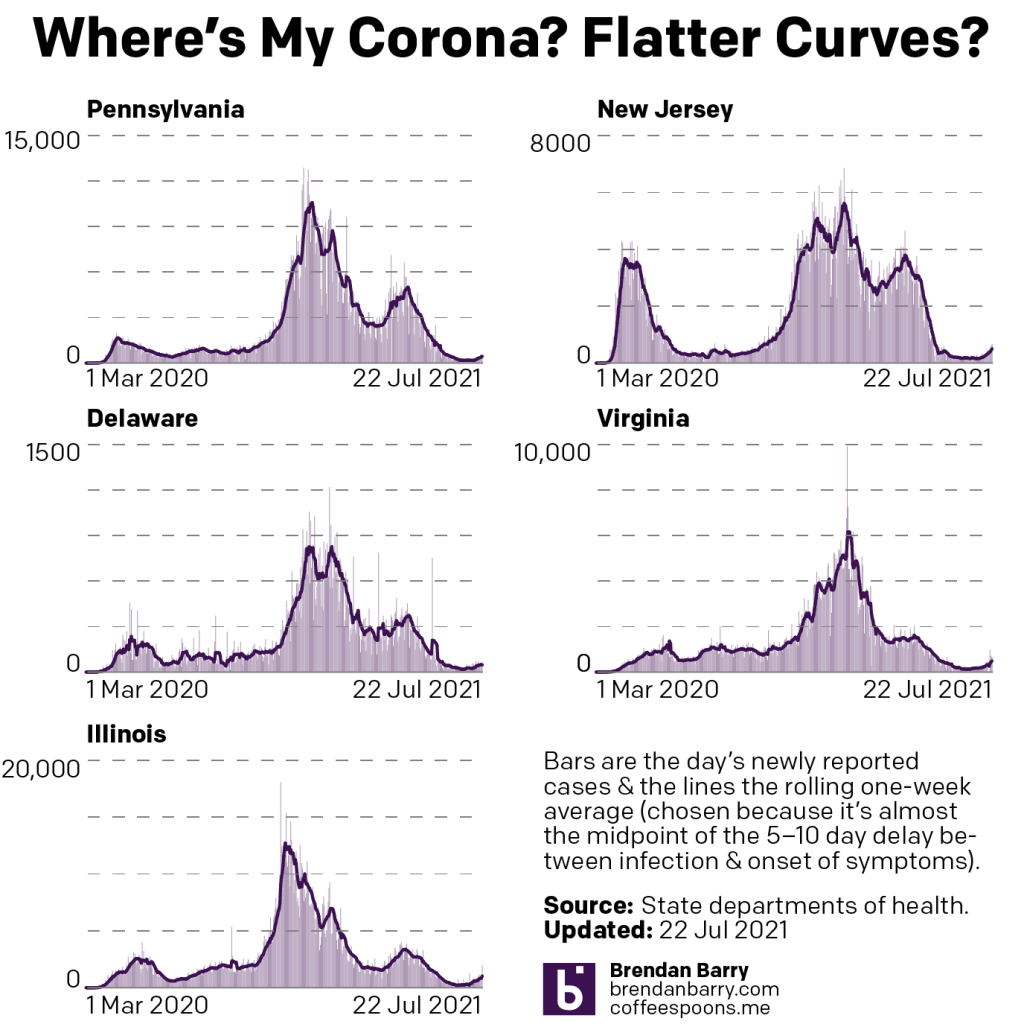
In all five states we are seeing significant increases in the numbers of new cases. In New Jersey we hit the milestone of 900,000 total cases. Three weeks ago, the Garden State had bottomed out with an average of about 160 new cases per day. Yesterday the moving seven-day average surpassed 500 for the first time since mid-May.
But New Jersey is not alone. In Illinois the seven-day average has doubled since my last post. The state reported just under 2000 new cases yesterday and that brought the seven-day average above 1000 for the first time since late-May. Before the spring surge earlier this year, Illinois had bottomed out with a seven-day average of about 1500 new cases per day. If these numbers continue, I would not be surprised to see the state back at those levels within another week or two.
Nor has Virginia been spared and yesterday Old Dominion’s seven-day average rose to just short of 500 new cases per day. That too is a level we haven’t seen since…wait for it…mid-May. The pattern emerging here is fairly clear. Things are beginning to get worse and get worse in a hurry. The average has nearly doubled since my last post about Covid.
We see the same situation in Delaware though it’s increase is on the smaller side. The seven-day average in the First State hit 50 new cases per day earlier this week, though it’s ebbed back slightly and sat at 48 yesterday. You have to go back to early June to find levels that high.
And finally it’s not as if Covid has spared Pennsylvania. Three weeks ago we were nearing 100 new cases per day. At the time of my last post, the seven-day average was just a little over 200 new cases per day. The average is double that number as of yesterday at 438 new cases per day. The Commonwealth has now reported three consecutive days of over 500 new daily cases for the first time since…early June. Surprised at that timing?
The common thread in these states is that the virus, almost certainly the Delta variant, is racing through the unvaccinated populations. And we are beginning to see rises in the numbers of hospitalisations, something that I don’t chart but on which I keep tabs. But what I do track visually are the deaths from Covid.
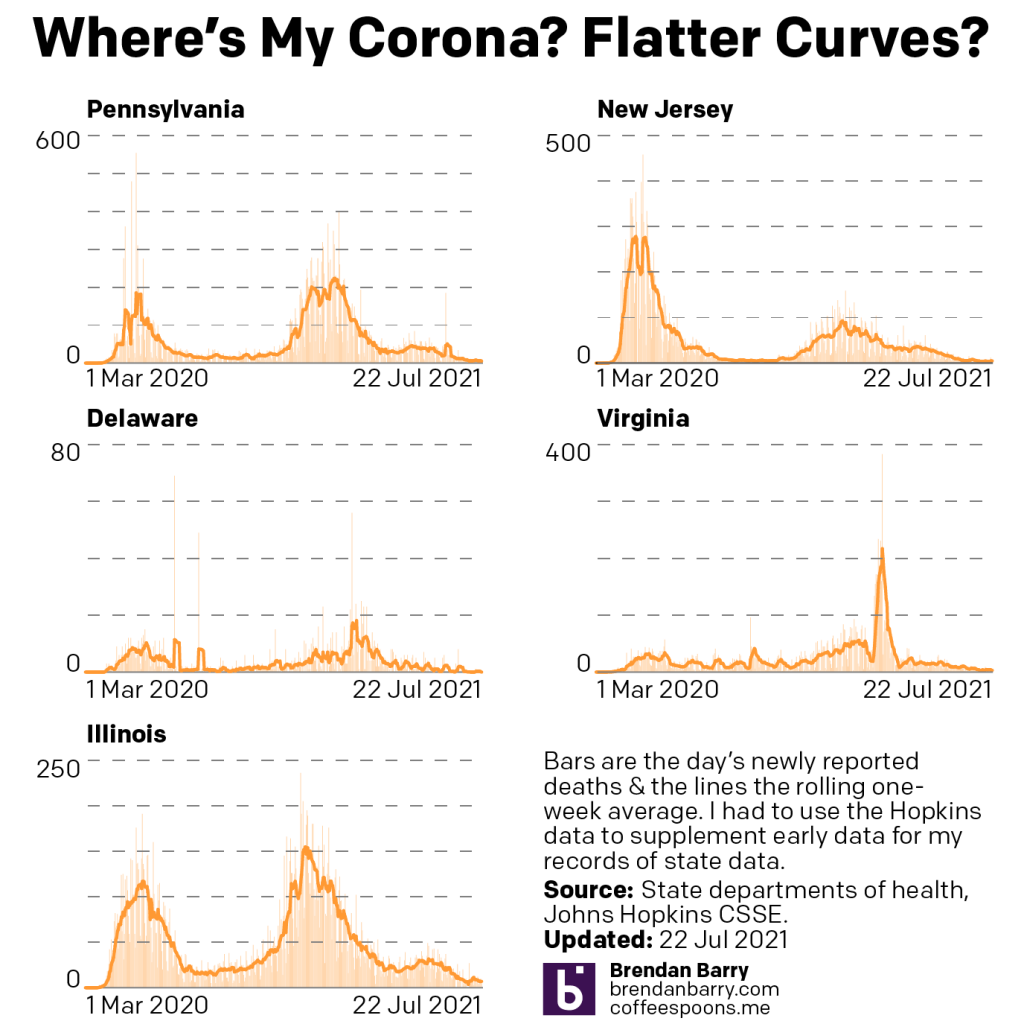
We need to keep in mind again that deaths are a lagging indicator and that it takes a few weeks from someone’s infection to their death, if that person’s case is severe enough.
The good news is that we are not yet seeing a corresponding increase in the numbers of deaths. Though it might still be too early for that, should it occur. Of course lack of death does not preclude one from suffering from long Covid, a debilitating and persistent illness that lasts for months. As for deaths, instead we see the numbers entering something of a holding pattern.
Starting with Pennsylvania, deaths from Covid-19 have halved since this time last month. But we were largely at that point when I last wrote nine days ago. Deaths haven’t fallen significantly since, dropping from 7.3 per day to 5.3 per day.
And that’s a pattern we see elsewhere. In Illinois deaths are also down nearly half from an average of 12 per day last month to just 7 per day. But they were at 9 when I last wrote. In New Jersey deaths were averaging 6 per day last month and now they sit at an average of 4.7. What was the average nine days ago? 4.7. Virginia is also similar, going from an average of 6 deaths per day to 4 and now just 3.
Delaware is the one state where we have some genuinely good news. Deaths had been averaging about 2 per day last month and we are at 0 today. Since the beginning of July we’ve seen only three additional deaths. That’s great news, but Delaware is also one of the smallest states.
The takeaway from this should be please get vaccinated if you’re still not. They are safe. They are effective. And they are free. Especially as this new Delta variant begins ripping through unvaccinated populations, I really hope my unvaccinated readers will take an opportunity this weekend to get their shots. Because remember, except for the Johnson & Johnson vaccine, you need two shots and you need to wait between those two doses. And then the vaccine takes about two weeks to kick in after that second dose.
Credit for the piece is mine.
Leave a Reply
You must be logged in to post a comment.