A few weeks back, a good friend of mine sent me this graphic from Statista that detailed the global beer industry. It showed how many of the world’s biggest brands are, in fact, owned by just a few of the biggest companies. This isn’t exactly news to either my friend or me, because we both worked in market research in our past lives, but I wanted to talk about this particular chart.
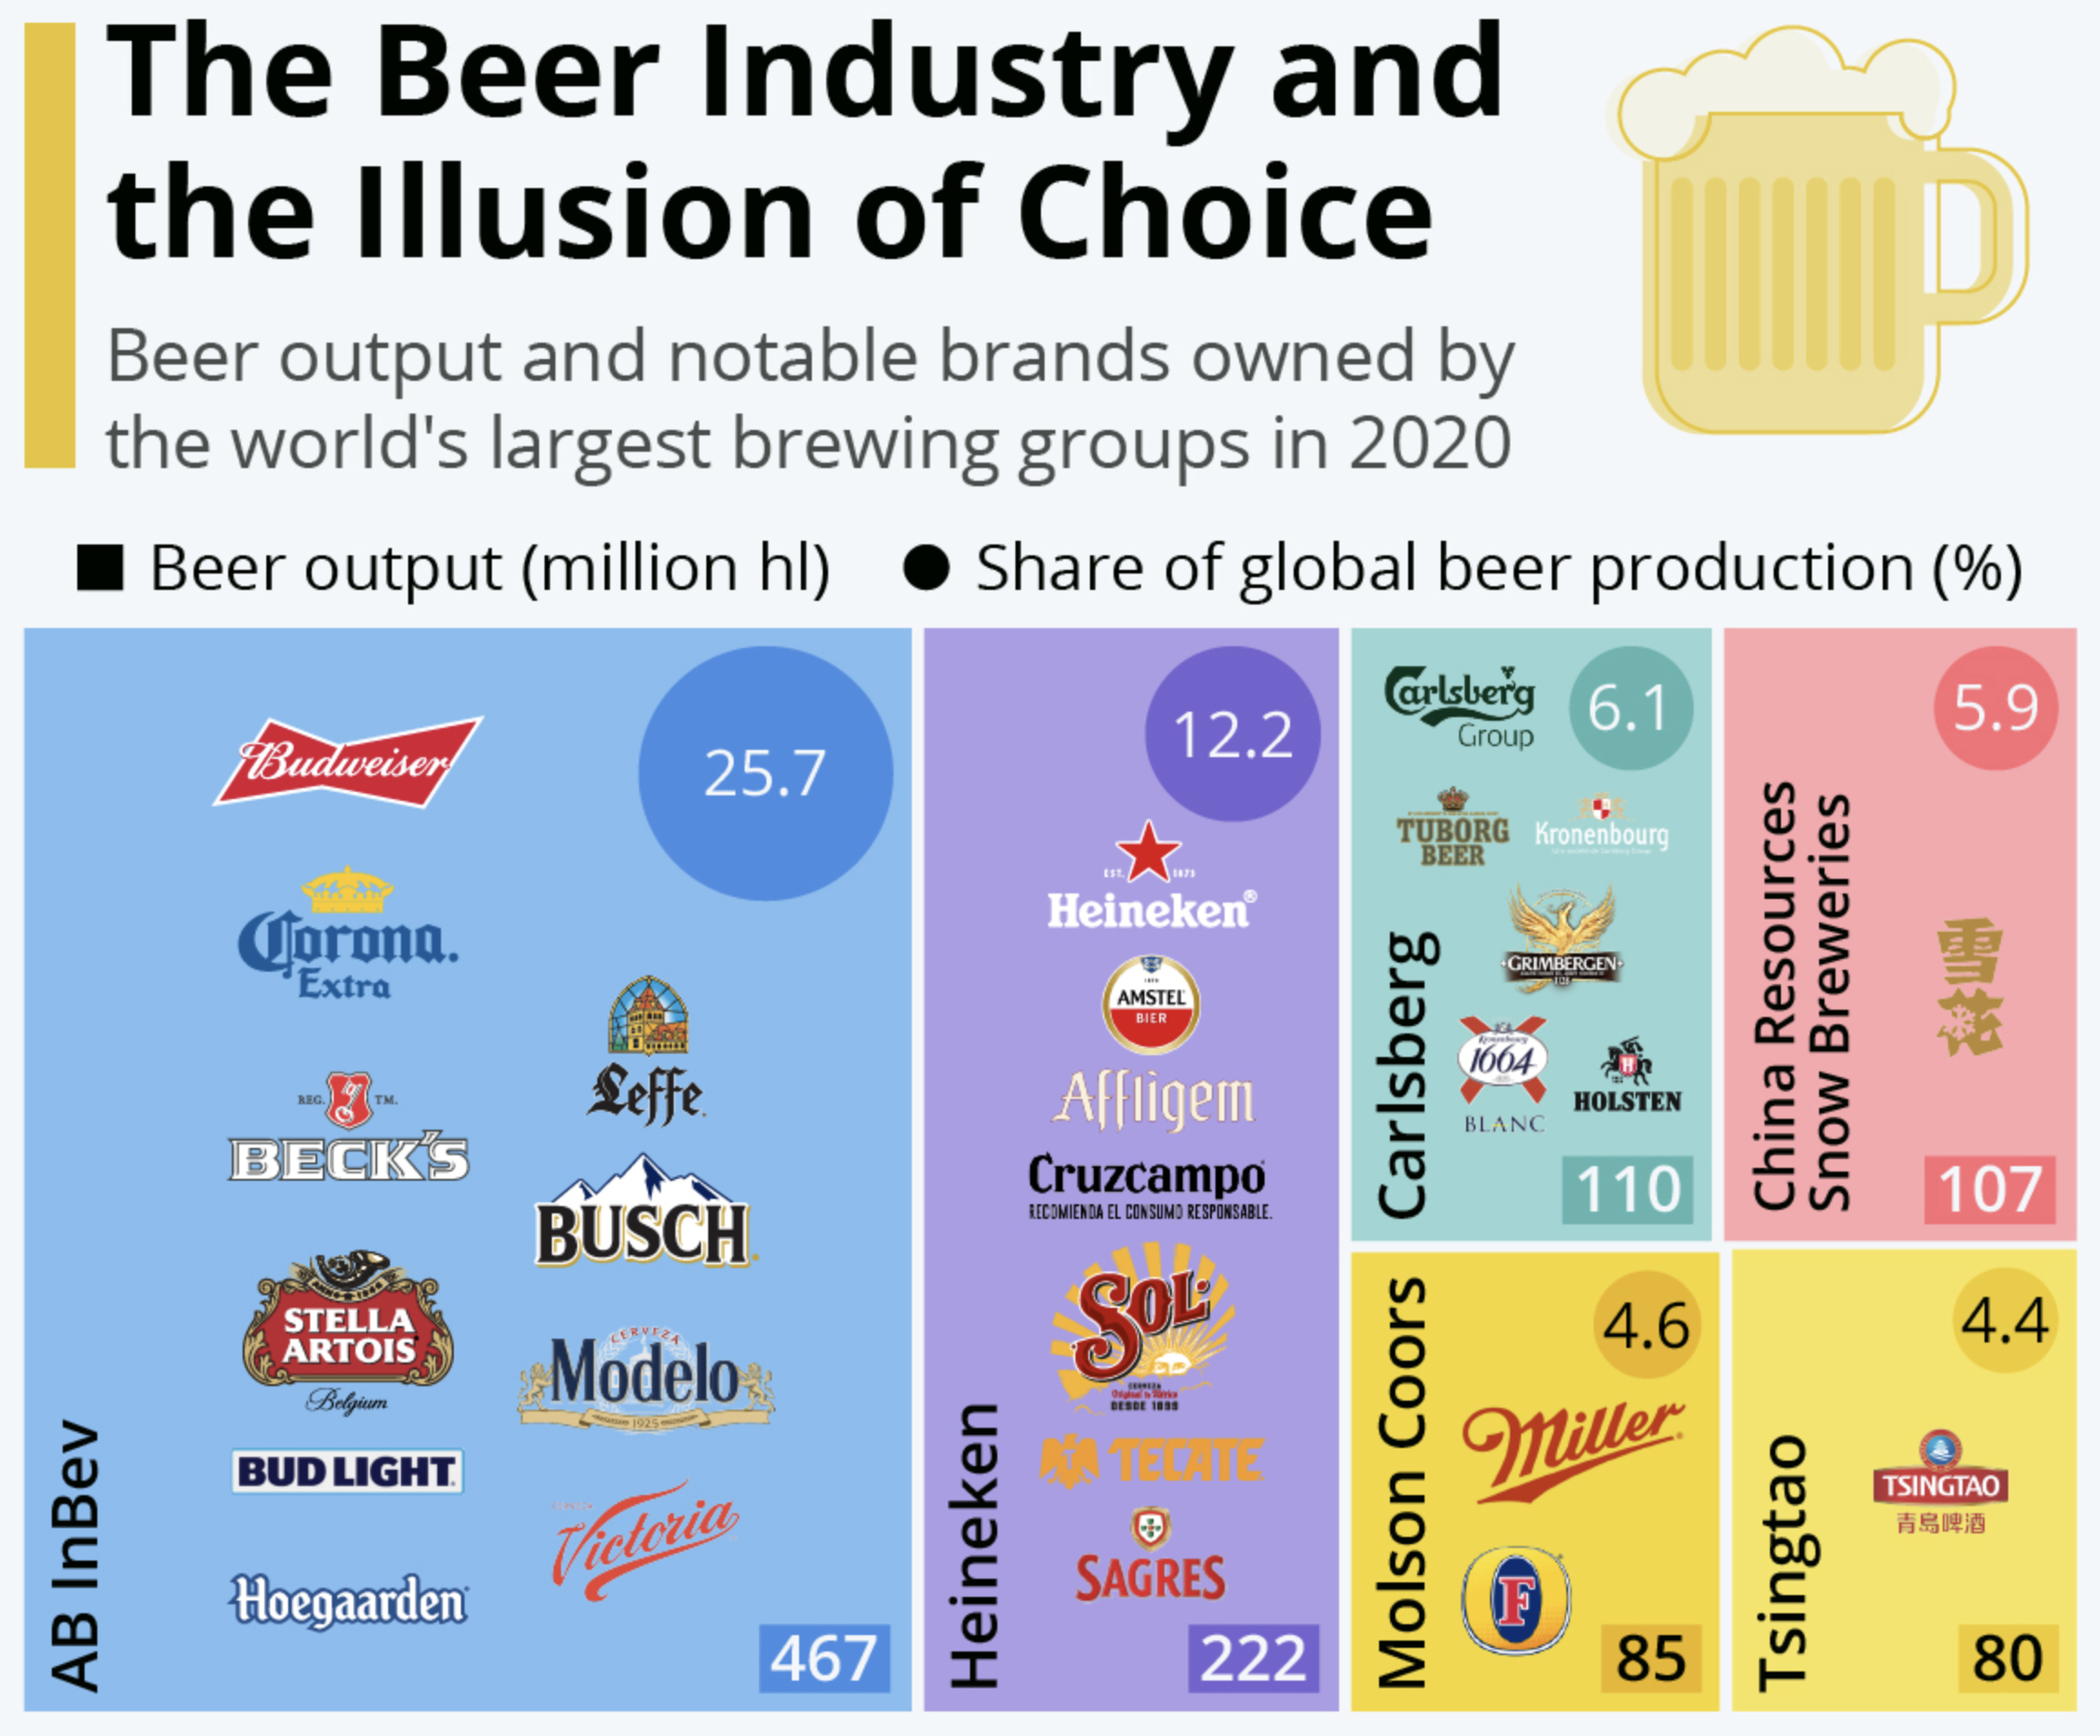
At first glance we have a tree map, where the area of each “squarified” shape represents, usually, the share of the total. In this case, the share of global beer production in millions of hectolitres. Nothing too crazy there.
Next, colour often will represent another variable, for market share you might often see greens or blues to red that represent the recent historical growth or forecast future growth of that particular brand, company, or market. Here, however, is where the chart begins to breakdown. Colour does not appear to encode any meaningful data. It could have been used to encode data about region of origin for the parent company. Imagine blue represented European companies, red Asian, and yellow American. We would still have a similarly coloured map, sans purple and green,
But we also need to look at the data the chart communicates. We have the production in hectolitres, or the shape of the rectangle. But what about that little rectangle in the lower right corner? Is that supposed to be a different measurement or is it merely a label? Because if it’s a label, we need to compare it to the circles in the upper right. Those are labels, but they change in size whereas the rectangles change only in order to fit the number.
And what about those circles? They represent the share of total beer production. In other words the squares represent the number of hectolitres produced and the circles represent the share of hectolitres produced. Two sides of the same coin. Because we can plot this as a simple scatter plot and see that we’re really just looking at the same data.
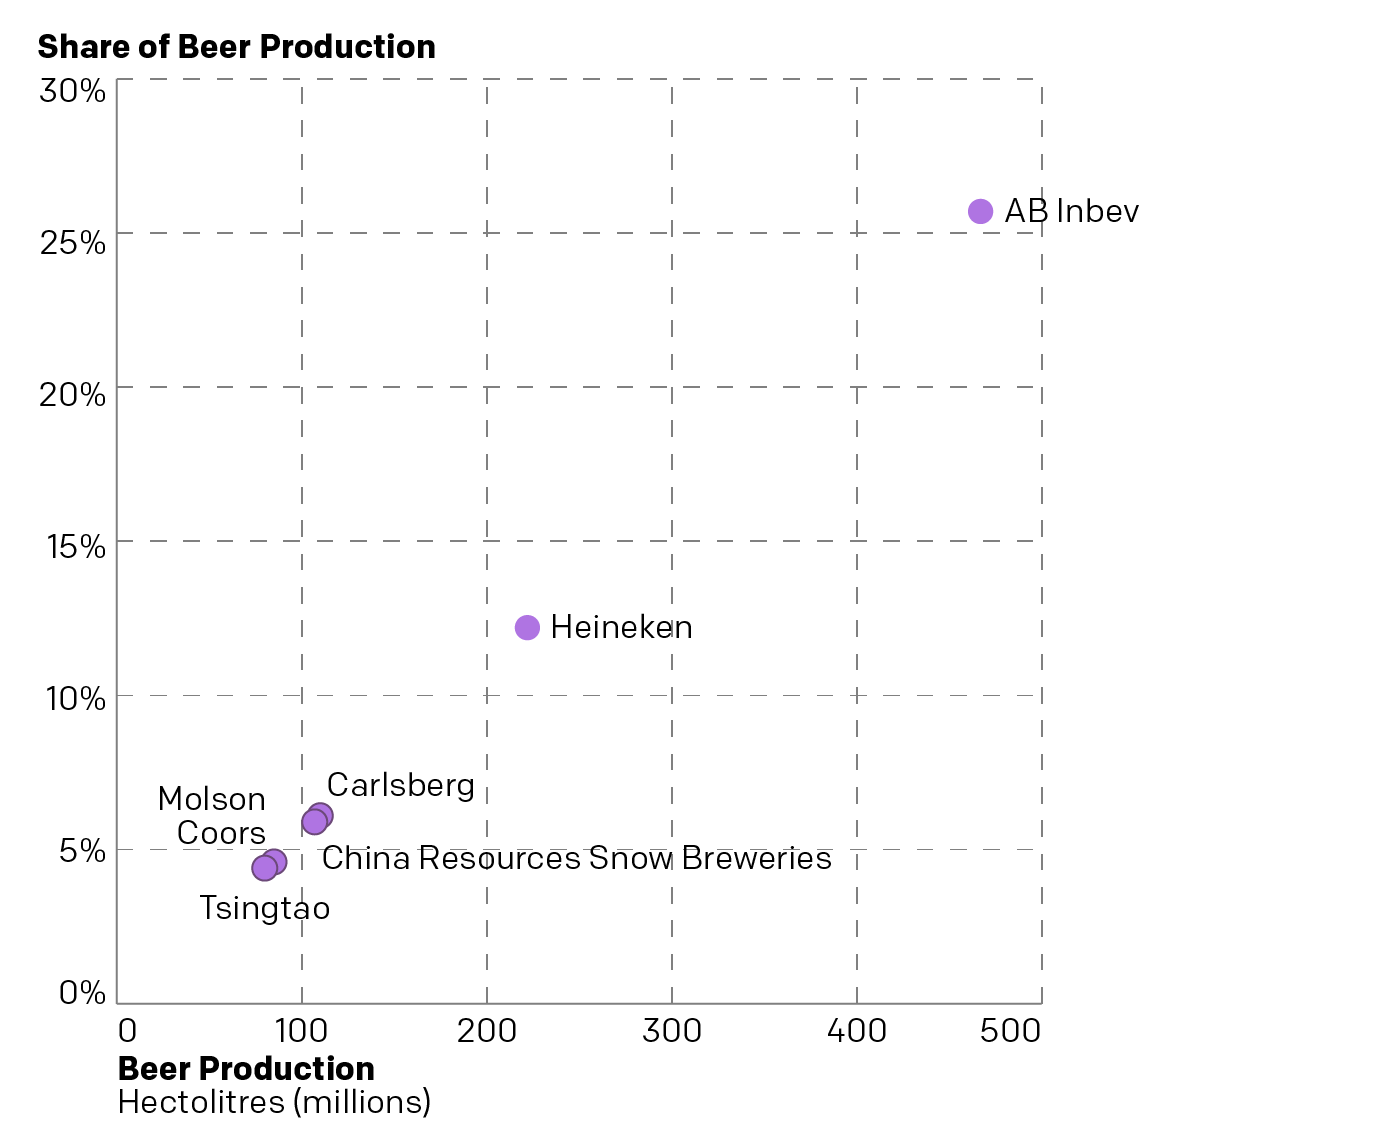
We can see that there’s a pretty apparent connection between the volume of beer produced and the share of volume produced—as one would (hopefully) expect. The chart doesn’t really tell us too much other than that there are really three tiers in the Big Six of Breweries. AB Inbev is in own top tier and Heineken is a second separate tier. But Carlsberg and China Resources Snow Breweries are very competitive and then just behind them are Molson Coors and Tsingtao. But those could all be grouped into a third tier.
Another way to look at this would be to disaggregate the scatter plot into two separate bar charts.
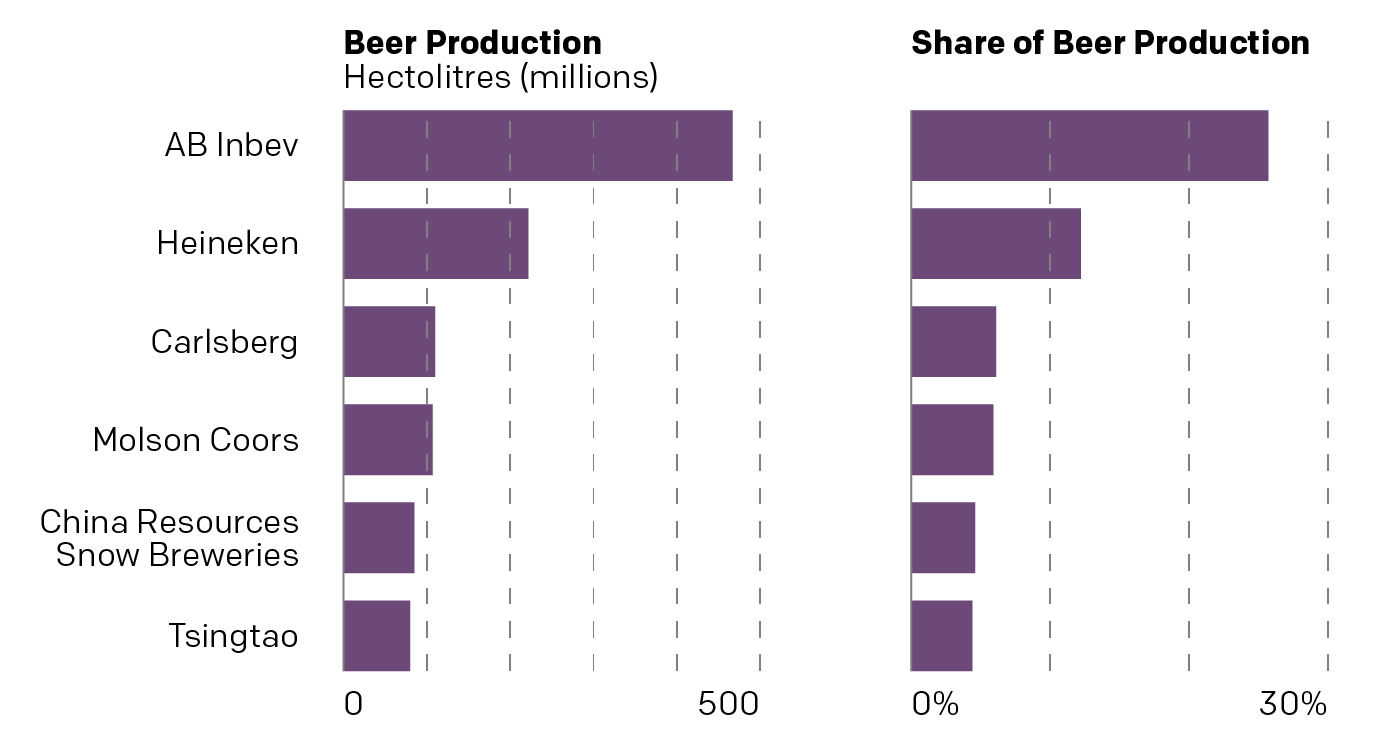
You can see the pattern in terms of the shapes of the bars and the resulting three tiers is broadly the same. You can also see how we don’t need colour to differentiate between any of these breweries, nor does the original graphic. We could layer on additional data and information, but the original designers opted not to do that.
But I find that the big glaring miss is that the article makes the point despite the boom in craft beer in recent years, American craft beer is still a very small fraction of global beer production. The text cites a figure that isn’t included in the graphic, probably because they come from two different sources. But if we could do a bit more research we could probably fit American craft breweries into the data set and we’d get a resultant chart like this.
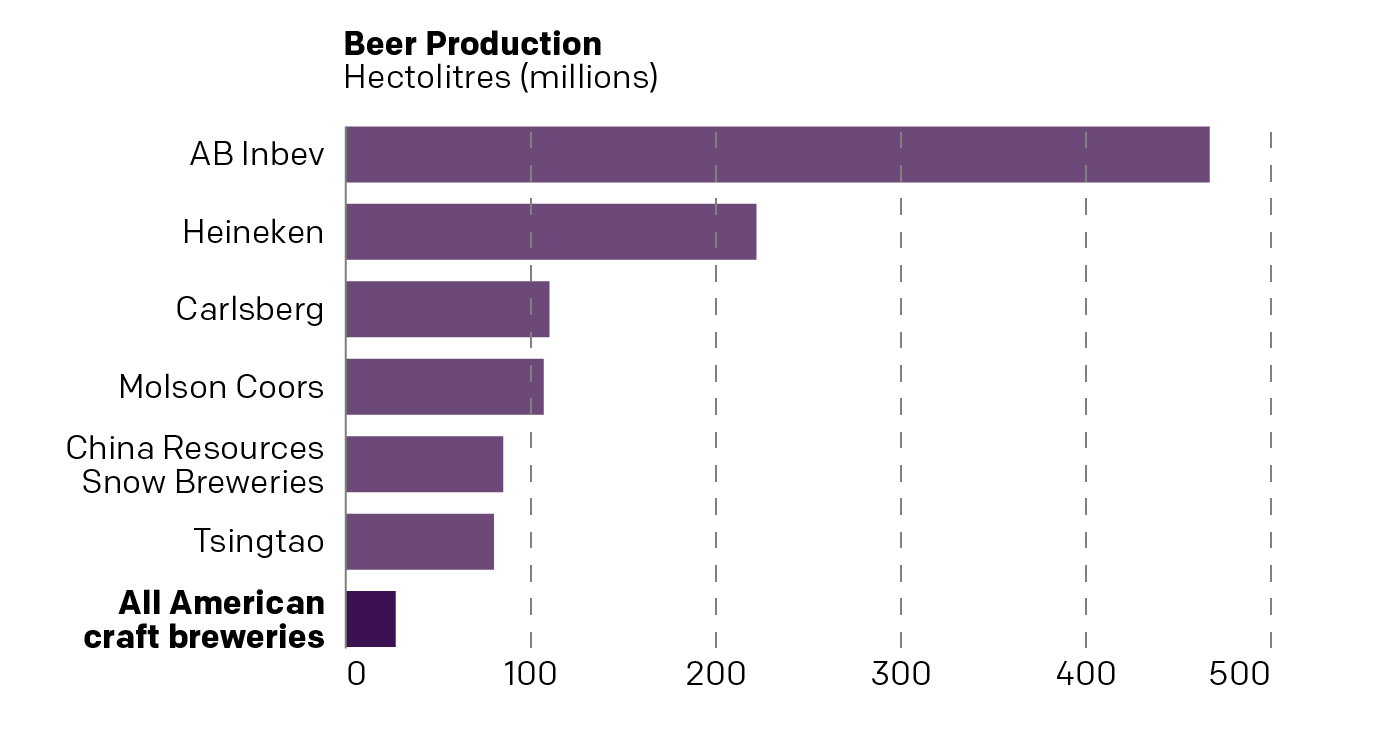
This more clearly makes the point that American craft beer is a fraction of global beer production. But it still isn’t a great chart, because it’s looking at global beer production. Instead, I would want to be able to see the share of craft brewery production in the United States.
How has that changed over the last decade? How dominant are these six big beer companies in the American market? Has that share been falling or rising? Has it been stable?
Well, I went to the original source and pulled down the data table for the Top 40 brewers. I took the Top 15 in beer production, all above 1% share in 2020, and then plotted that against the change in their beer production from 2019 to 2020. I added a benchmark of global beer production—down nearly 5% in the pandemic year—and then coloured the dots by the region of origin. (San Miguel might not seem to fit in Asia by name, but it’s from the Philippines.)
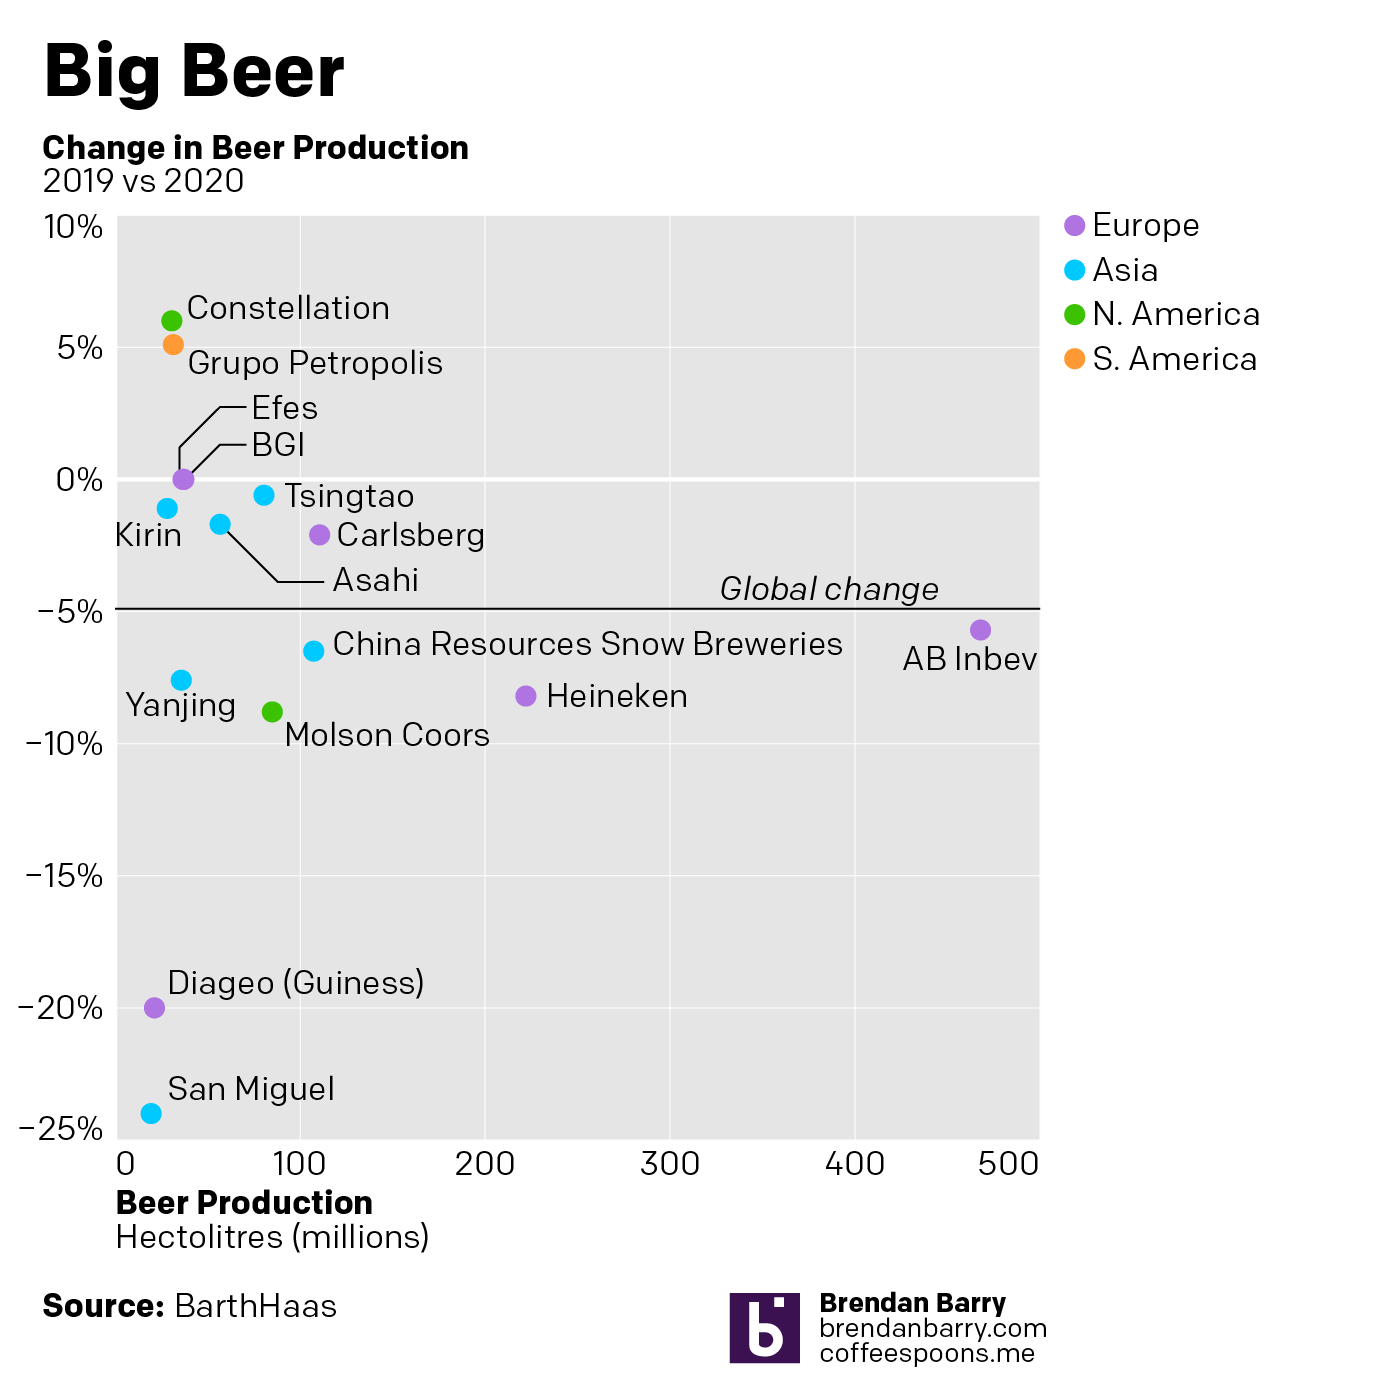
What mine does not do, because I couldn’t find a good (and convenient) source is what top brands belong to which parent companies. That’s probably buried in a report somewhere. But whilst market share data and analysis used to be my job, as I alluded to in the opening, it is no longer and I’ve got to get (virtually) to my day job.
Credit to the original goes to Felix Richter.
Credit for my take goes to me.

