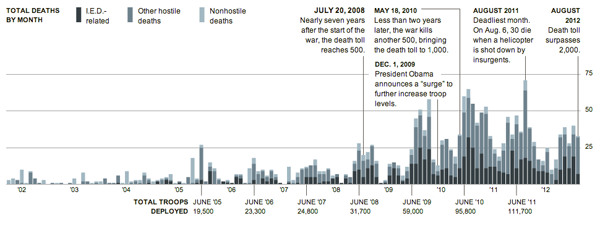
We are still in Afghanistan and people are still dying. This graphic from the New York Times looks at those deaths in detail.
Tag: military
The Enemy Amongst Us
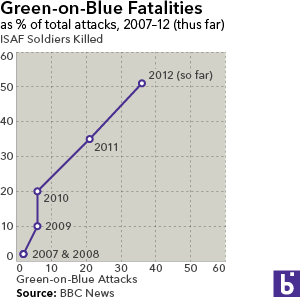
Perhaps the greatest danger now facing NATO and US troops in Afghanistan is the age-old wolf in sheep’s clothing, the insurgent dressed in Afghan Army fatigues. As the graphic below shows, the number of fatalities has been increasing along with the number of attacks. The silver lining in the cloud (to mix metaphors) is that the average lethality of the attacks is on the decline as fewer ISAF soldiers are killed per attack.
Spies
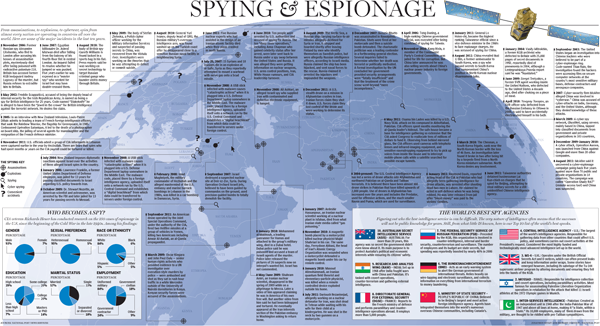
This infographic from the National Post is nearly a year old, however its look at global espionage in the wake of unrest in the Middle East is once again relevant.
Credit for the piece goes to Jonathan Rivait and Richard Johnson.
The Second Battle of Bull Run or The Second Battle of Manassas. Take Your Pick.
So the battle has two different names, but it was undoubtedly bloody. The Washington Post created an infographic exploring this important battle of the Civil War that led to a bloody Union defeat.

Credit for the piece goes to Gene Thorp, Brenna Maloney, Laura Stanton, and Don Troiani.
USS Iowa
Battleships are cool. Pointless in the 21st century, but they’re still cool. And now the USS Iowa is open as a museum in Los Angeles. Around the opening of the museum earlier this month, the LA Times put together a few graphics that were collected in one infographic piece that illustrated some of those parts of the ship open to the public. But what’s cooler than the guns that fire shells as big as trees (wrong ship in the song, but the point stands).
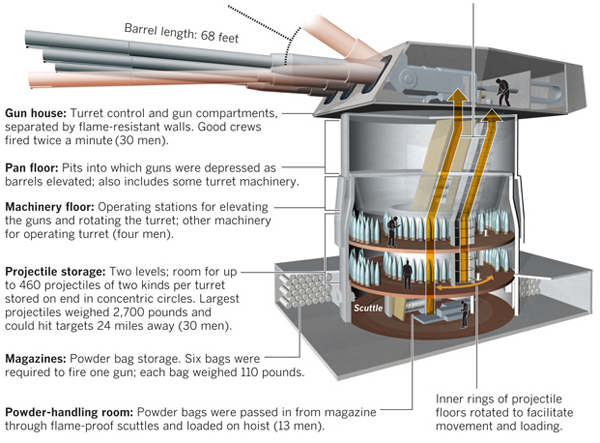
Credit for the piece goes to Tom Reinken, Raoul Ranoa, and Anthony Pesce.
Blowing Things Up (Or Shooting Them Down)
After an odd two short weeks—imagine two weeks with each only having a Monday and a Friday—we (in the royal sense of I) are back to the routine. So what better way than to look at American awesomeness in blowing things up. Through air strikes launched from US aircraft carriers.
This graphic comes from the New York Times and looks at the changed nature of air warfare in Afghanistan. No longer are US fighters dropping bombs all over the place—during the early days of the war, aircraft would take off laden with so many bombs that they needed to drop some before returning to the carrier—instead they use cannon fire and use it far more sparingly.
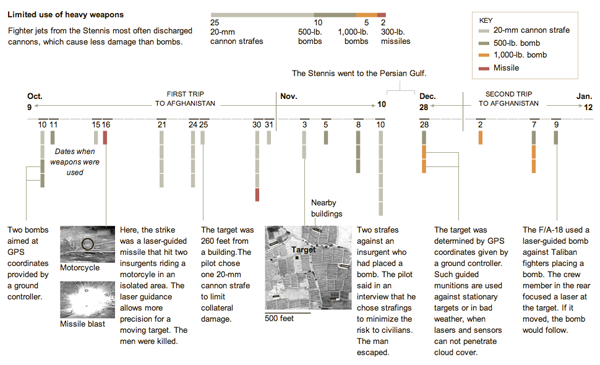
Credit for the piece goes to Sergio Peçanha.
North Korean Missile Technology (Or Lack Thereof)
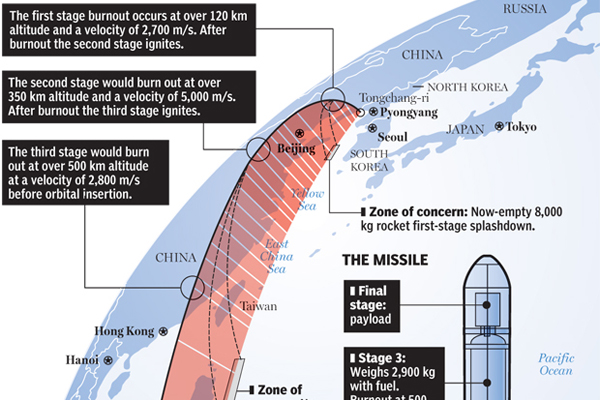
North Korea wanted to launch a missile, but failed miserably in doing it. Richard Johnson at the National Post created an infographic, prior to the missile’s launch, that looked at what the North Koreans wanted to do.
Today is a Happy Happy Joy Joy Story
For the past two posts I focused on the sinking of the RMS Titanic, an historical event that has always been of some interest to me, but is not always the most uplifting of subjects. When in high-school, I once had an English teacher who took to heart our complaints that our literature selection was rather dark and depressing. So after finishing yet another such story, he had us turn to a specific page in our reader. The title of that day’s story was To the Gas Chambers, Ladies and Gentlemen; it was a story about the Holocaust.
Here is today’s uplifting story. What would happen if a dirty bomb was detonated in lower Manhattan. Courtesy of the National Post.
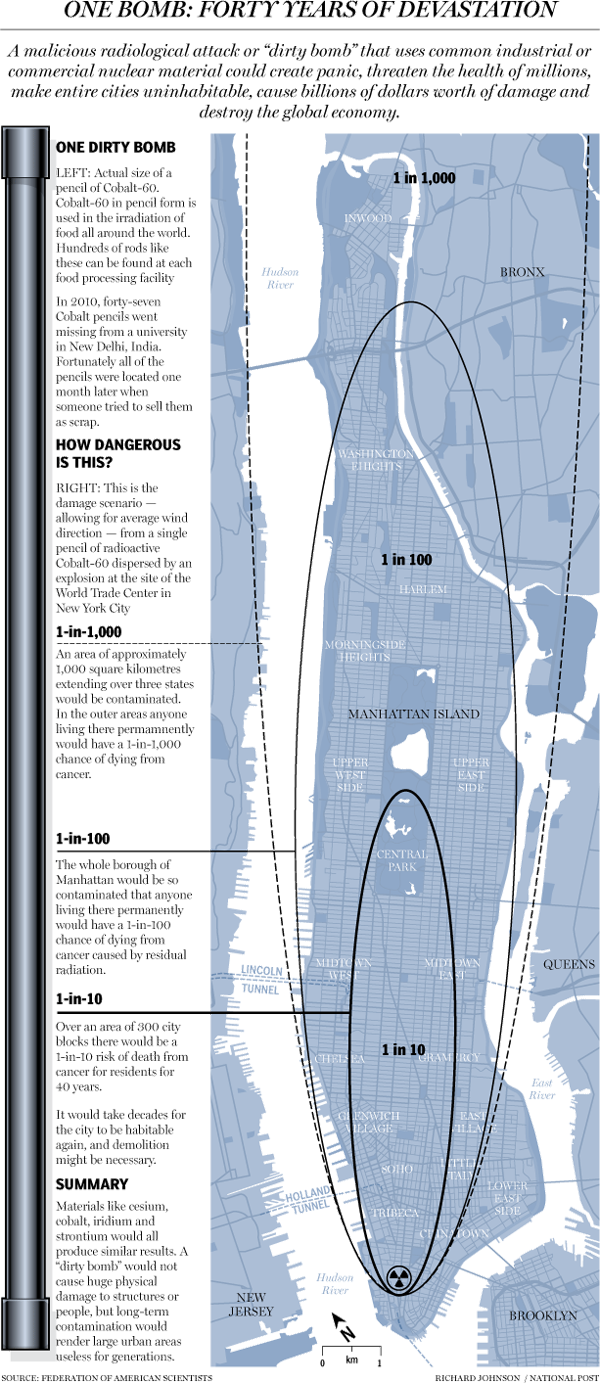
Credit for the piece goes to Richard Johnson.
A Timeline of Deaths in Syria
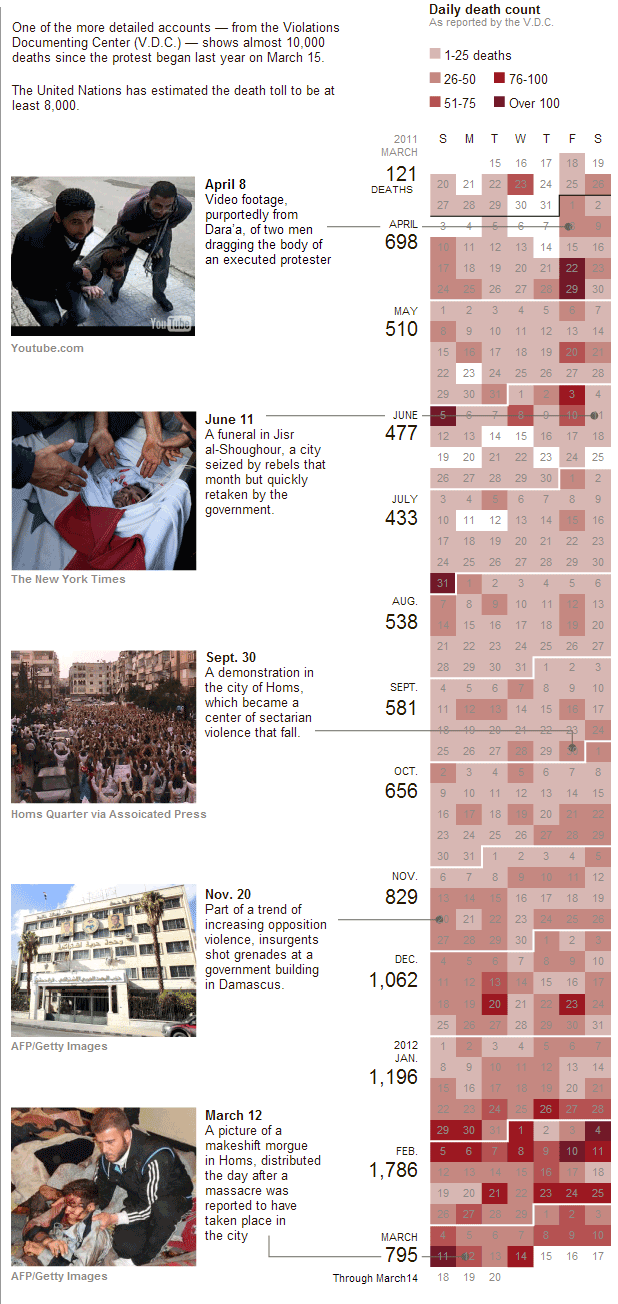
The civil war in Syria rages on. The following graphic from the New York Times accompanies the article and uses a calendar-style timeline to look at the mounting death toll. The visualisation type appears more and more often for time-based data sets shaped around days; we all (usually) understand how calendars work and are shaped.
In this particular case, specific key dates and images are brought out of the timeline and featured on the left. These provide an additional context to the human side of the story that may otherwise be left in the dates and deaths on the right.
A problem with such a design is the length of the year, which might preclude users of small screens from being able to see the entire year in one screen-height. I am left to wonder about whether the user can make an adjustment to a horizontally-scrolling calendar and if in the future such arrangements may better take advantage of widescreen monitors.
Busting Bunkers
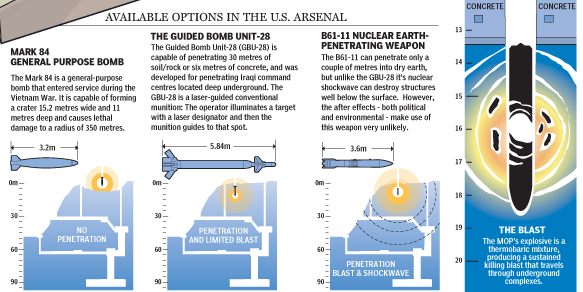
There is quite a lot of talk these days about the possibility of Israel, either with or without American assistance, launching an attack on Iran to halt the further development of its nuclear programme. The trouble is that Israel may not have the weapons necessary to carry out a successful attack, but the US has quite the arsenal. And one of the most useful, for just such a task is the Massive Ordnance Penetrator.
The National Post created an infographic to look at the bomb and just how it might be used if the US should decide to use it.
Credit for the piece goes to Mike Faille and Richard Johnson.

