Revising the Jobs Reports

Last Friday was the jobs report for the month of August. And it was not as high as economists had expected. The problem is that the initial report is often inaccurate despite the fact we make such a big deal about the report. So the Washington Post looked at the revisions that take place in the months afterwards. Yeah, the initial reports are not so accurate.
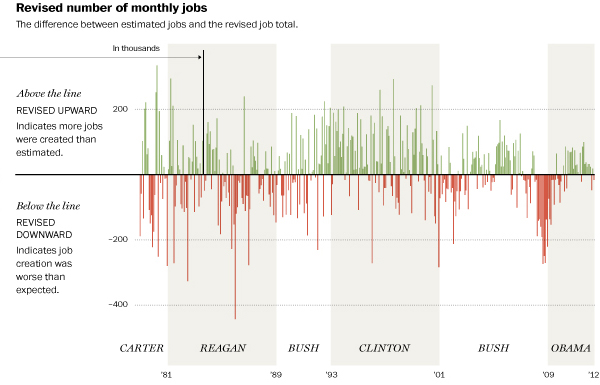
Revising the Jobs Reports Numbers

The first two sets of charts (not shown above) look at the initial versus the revised numbers. The third (the cropping above) looks at the difference between those figures. The result is that the first few years of President Obama’s presidency created more jobs than expected but that the last two months have seen worse-than-expected job creation. I would be curious to see how this correlates to the end of the stimulus plan, but I imagine it would be difficult to link that to the jobs reports.

Credit for the piece goes to Todd Lindeman.

How Has the Republican Party Changed

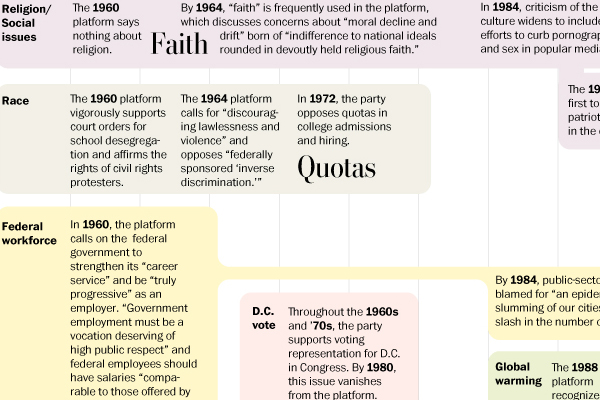
Yesterday I shared an infographic looking at the demograhics behind the evolution of the Democratic Party—and by comparison the Republican Party. Today is the Washington Post’s infographic on the evolution of the Republican Party’s policy platform. Since the 1960s the party has shifted from a socially liberal agenda coupled with fiscal conservatism to an extremely conservative social agenda and an even more fiscally conservative platform. (For example, one wonders if the Tea Party remembers how the great conservative in Ronald Reagan raised taxes because it was how to generate increased revenue?)

An evolving GOP platform

Credit for the piece goes to Marc Fisher, Laura Stanton, and Karen Yourish.

How Has the Democratic Party Changed

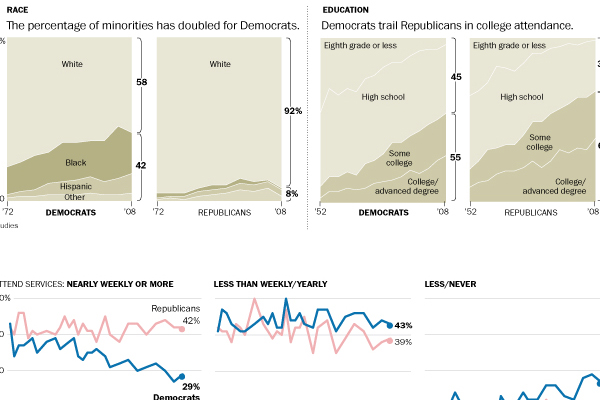
This past weekend the Washington Post published an infographic looking at how the Democratic Party has demographically changed over time and compared those changes to those in the Republican Party. The piece is large, but shows some interesting trends particularly with the racial diversification of the political parties—or lack thereof. It is an important trend when considering the white population is growing at much slower pace than minority groups.

Democratic Party trends

The Second Battle of Bull Run or The Second Battle of Manassas. Take Your Pick.

So the battle has two different names, but it was undoubtedly bloody. The Washington Post created an infographic exploring this important battle of the Civil War that led to a bloody Union defeat.

Second Bull Run
Second Bull Run

Credit for the piece goes to Gene Thorp, Brenna Maloney, Laura Stanton, and Don Troiani.

Ethnic Comparison of Romney and Obama Voters

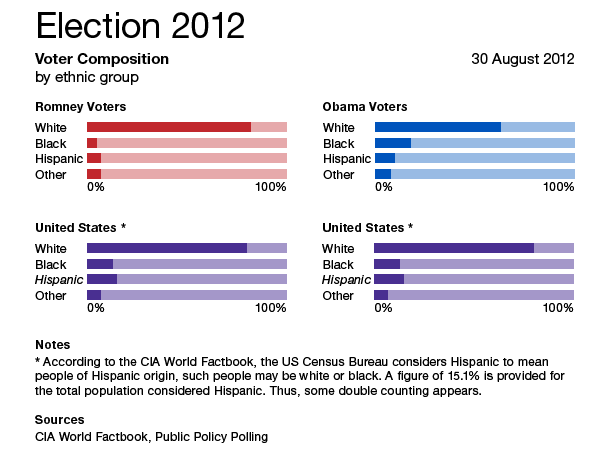
A rare mid-day posting. Some interesting figures published on Twitter by Public Policy Polling look at the ethnic breakdown of the—I presume self-identified—voters for both Governor Romney and President Obama. Perhaps we all already knew this, but one voter group is more diverse than the other.

To see whether these align with the national population, I included some quick stats published by the CIA World Factbook on the ethnic breakdown of the United States. The tricky part, however, is that the US Census Bureau does not regard Hispanic as a discrete ethnic group. Instead, it is considered an origin. Thus, you can be a black Hispanic of Caribbean descent or a white Hispanic from Spain. So, in full transparency, my United States figures for Hispanic are a bit suspect.

Obama Administration Failing on Mortgage Modifications

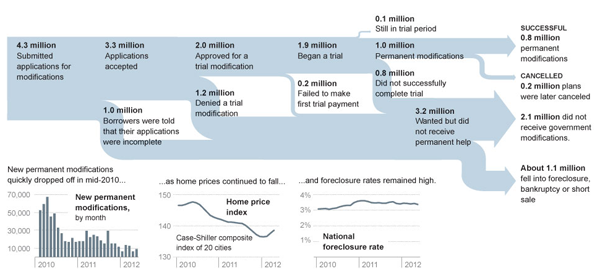
Today’s post features a Sankey diagram from the New York Times that looks at how the Obama administration has been failing to help homeowners with mortgage problems. Less than 25% of applicants have seen successful modifications of their home loans. The diagram here clearly shows the process and the failures that have led to so many Americans not receiving the help they sought.

Sankey
Sankey

Credit for the piece goes to Alicia Parlapiano.

World Bank—Mobile Phones

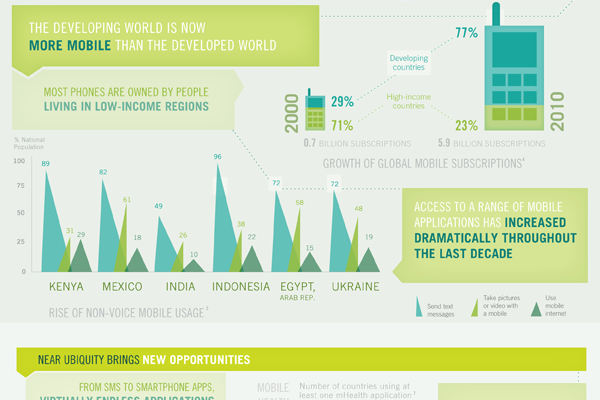
A little while ago the World Bank, generally a rich-country club that doles out loans to the developing world, published an infographic looking at mobile phones and their presence in the developing world.

The piece supplemented a report and is rather large. It actually exists as two separate images. The cropping below focuses just on how people in the developing world use mobile phones. Overall the piece is a bit weak in terms of data visualisation types and some of it is a bit confusing, but the story is clearly worth telling. And fortunately there are more hits than misses.

Developing world usage


Surveys of Swing States for the 2012 Presidential Election

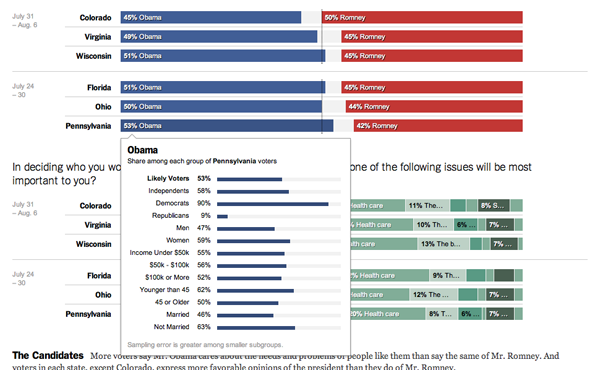
The New York Times has been conducting surveys or polls of voters and likely voters in swing states, i.e. the states where the 2012 election will be decided. The nice thing about the piece is that it allows the user to select different sets of demographics through which one can view the questions asked. Furthermore, the user can mouse over the individual bar of a response and see the whole set.

Election Polling
Election Polling

Obama Campaign Spending Breakdown

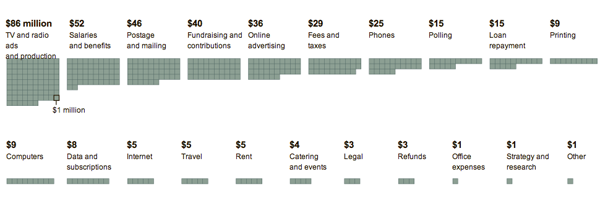
Over the weekend, the New York Times looked at how the Obama campaign has been spending its cash.

Obama Campaign Spending Breakdown

I appreciate the value in these sort of block charts, but, I wonder if a bar chart would not have been more clear for the comparison. I like the block charts when the designer is rearranging the data in different ways. For example, if the data set also included when the cash was spent, the blocks could be re-ordered into a day by day or month by month analysis.

Comparing Ad Spending in Three Key Election States

In this infographic about campaign ad spending in three battleground states, the New York Times shows that small multiples can work to create effective comparisons through an efficient use of space.

Campaign Ad Spend
Campaign Ad Spend