Britain Bombing in Eurovision

Last weekend was not only the Game of Thrones finale, but also the Eurovision final. For the Americans not familiar with it, it’s a part music, part theatrics competition between all European countries and then sometimes guest countries like Australia or Israel. The winner is chosen by the total number of points their act receives. The UK, as one of the largest countries in Europe, is one of the few countries that is guaranteed a spot.

But that doesn’t mean the UK performs well. Last weekend, the UK bombed. The winner, the Netherlands, scored 498 points. The UK? 11. But the UK has been terrible for years now. And unlike in American baseball, it’s not because tanking gets you coveted draft picks for new talent. The BBC charted the placement of the British entries since its last win in 1997, the height of Cool Britannia.
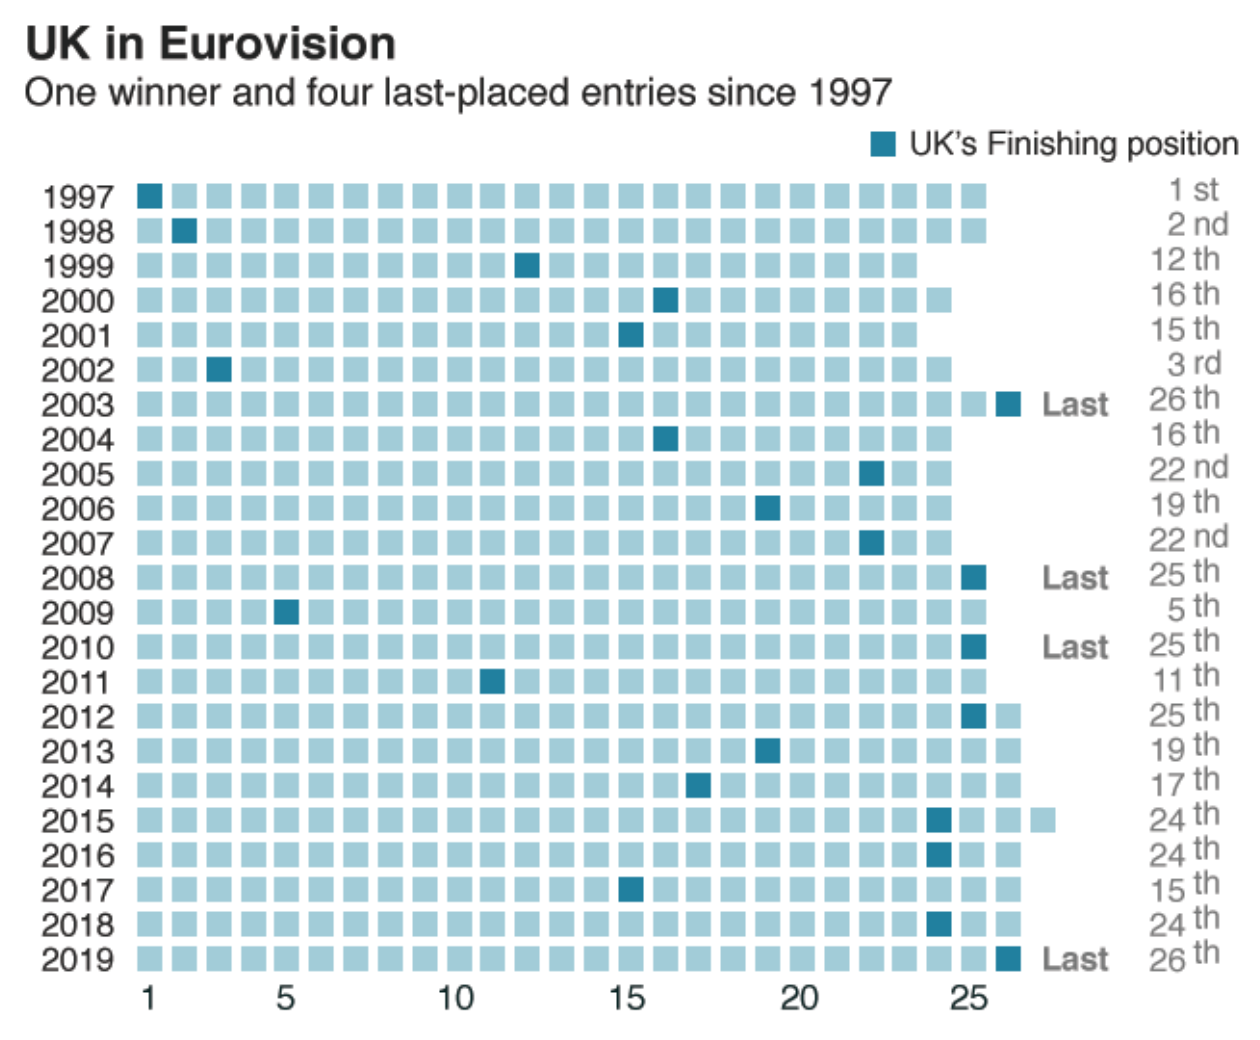
Consistently bad over the last several years

Design wise, I wonder about the horizontal movement of places. A top-to-bottom movement might make more sense. The labelling here is also a bit too much. My eye immediately settles on the black text for the years, as their tight spacing creates a dark field that overpowers the otherwise nice light blue–dark blue contrast in the graphic. Maybe the beginning and end years could have been labelled with some key intervals, say every five years?

Similarly, the use of the ordinal number over the cardinal on the right hand side puts more emphasis on the labelling than the graphic itself. Here, however, the designers wisely chose a grey for the text so as not to overpower the graphic. But I wonder if the use of a cardinal number could have reduced the extra bits of text at the end and drive more focus to the graphic.

Overall, it’s a neat graphic. But I think a few small tweaks could improve the design. Unfortunately for the UK, they are more than just a few small tweaks away from winning Eurovision 2020.

Credit for the piece goes to the BBC graphics department.

The Chrysanthemum Throne

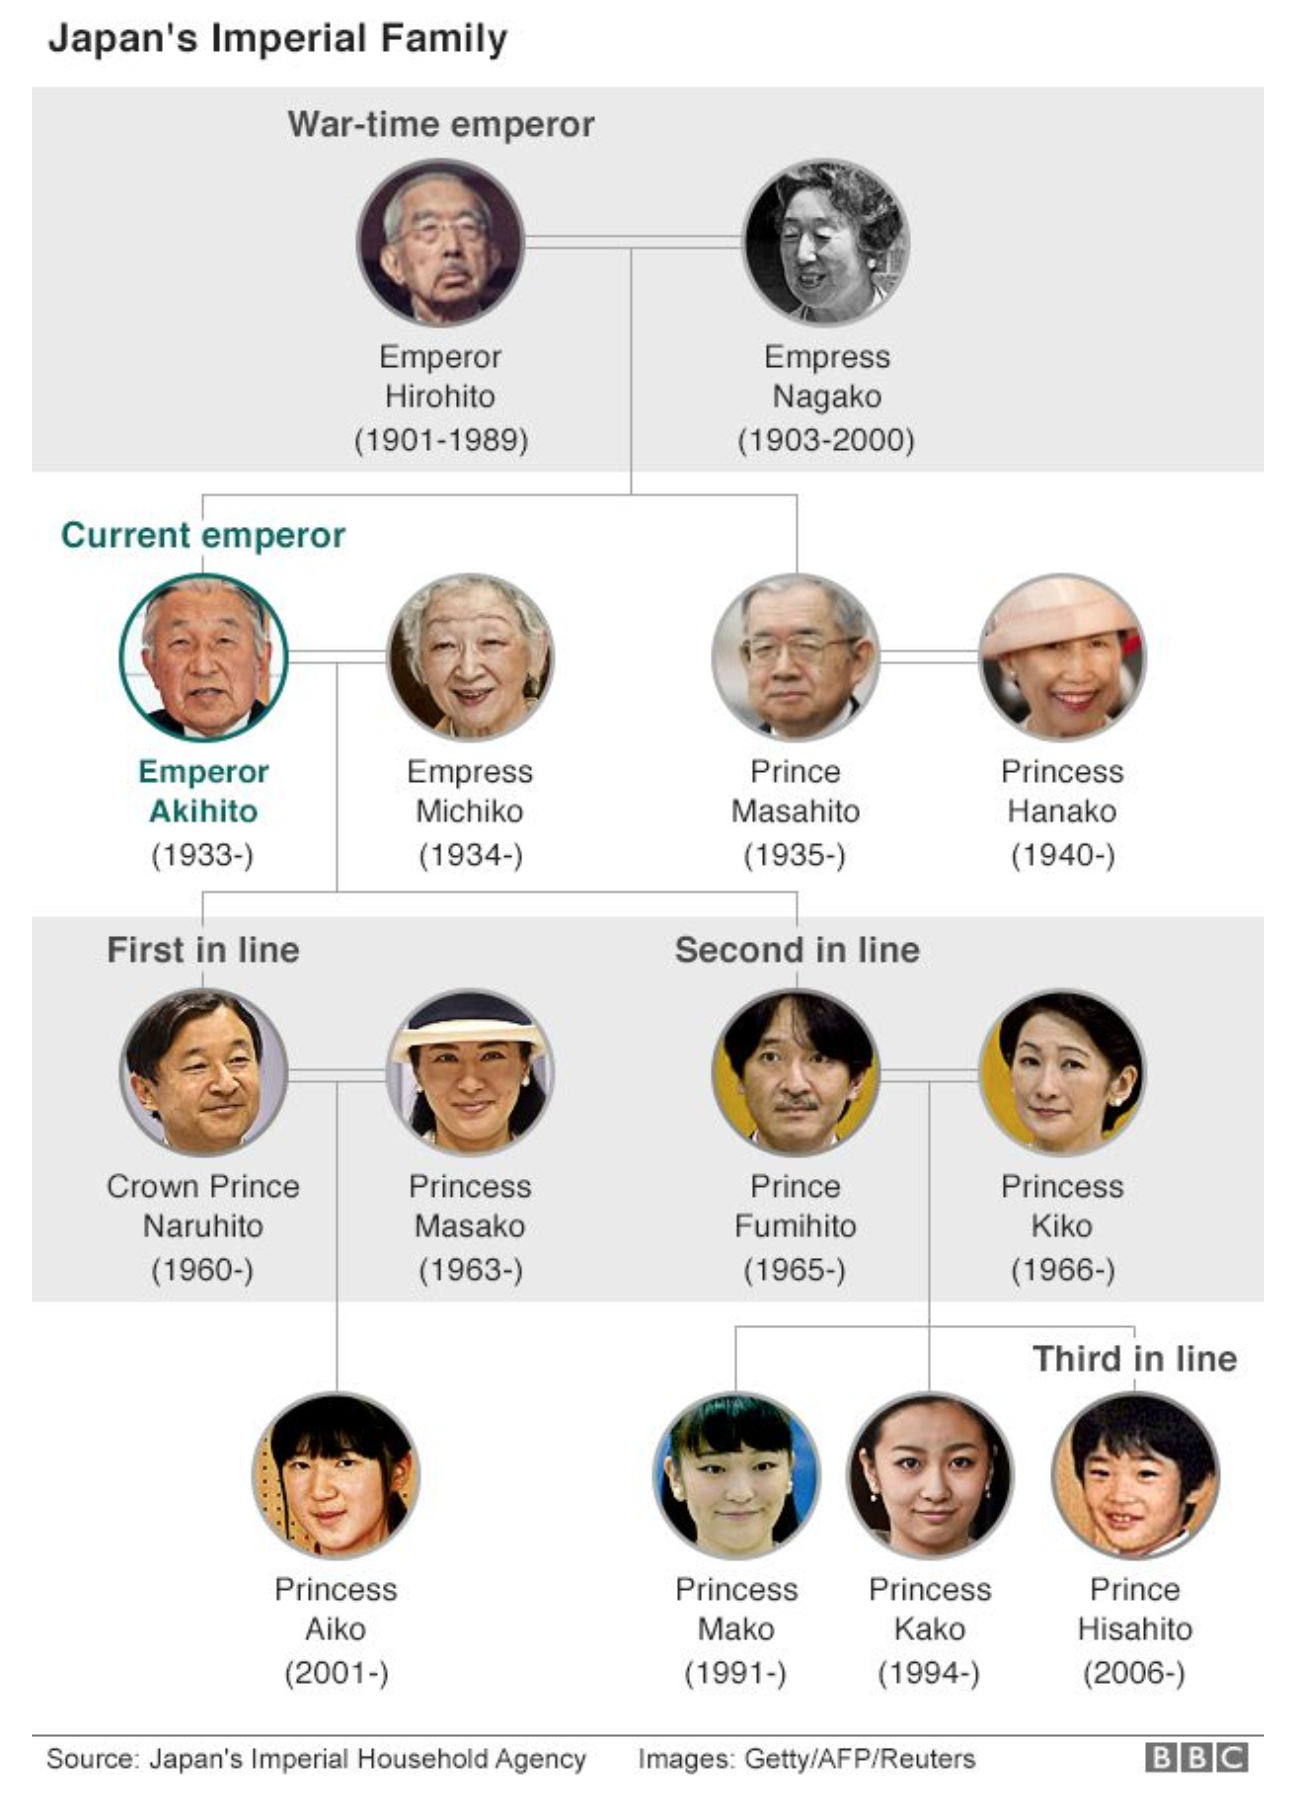
Today we move from the Iron Throne of Westeros (Game of Thrones) to the Chrysanthemum Throne of Japan. Emperor Akihito abdicated his throne in favour of his son Naruhito. Fascinatingly, because Japanese monarchs are not allowed to abdicate, the Japanese parliament had to pass a law allowing Akihito to do just that. It was also a one-time deal. The next emperor would need similar legislation should he ever want to abdicate. You will also note there are a lot of male pronouns in this paragraph. By law, women cannot inherit the throne. And when royal princesses marry, they leave the royal household.

Not surprisingly, the news today had some graphics depicting the family tree of the Japanese royal family. And you all know how much I am a sucker for genealogy related work. This piece comes from the BBC and it is pretty simple. It uses a nice grey bar to indicate the generations and some titling indicates who succeeds whom.

There ain't no Cersei here…
There ain’t no Cersei here…

The graphic also makes rather painfully clear that if Japan wants to preserve its monarchy, it will need to embrace some kind of reforms. There are only four males left in the line of succession and only one is likely to have any sons.

Credit for the piece goes to the BBC graphics department.
The Fire at Notre Dame Cathedral: Part Deux

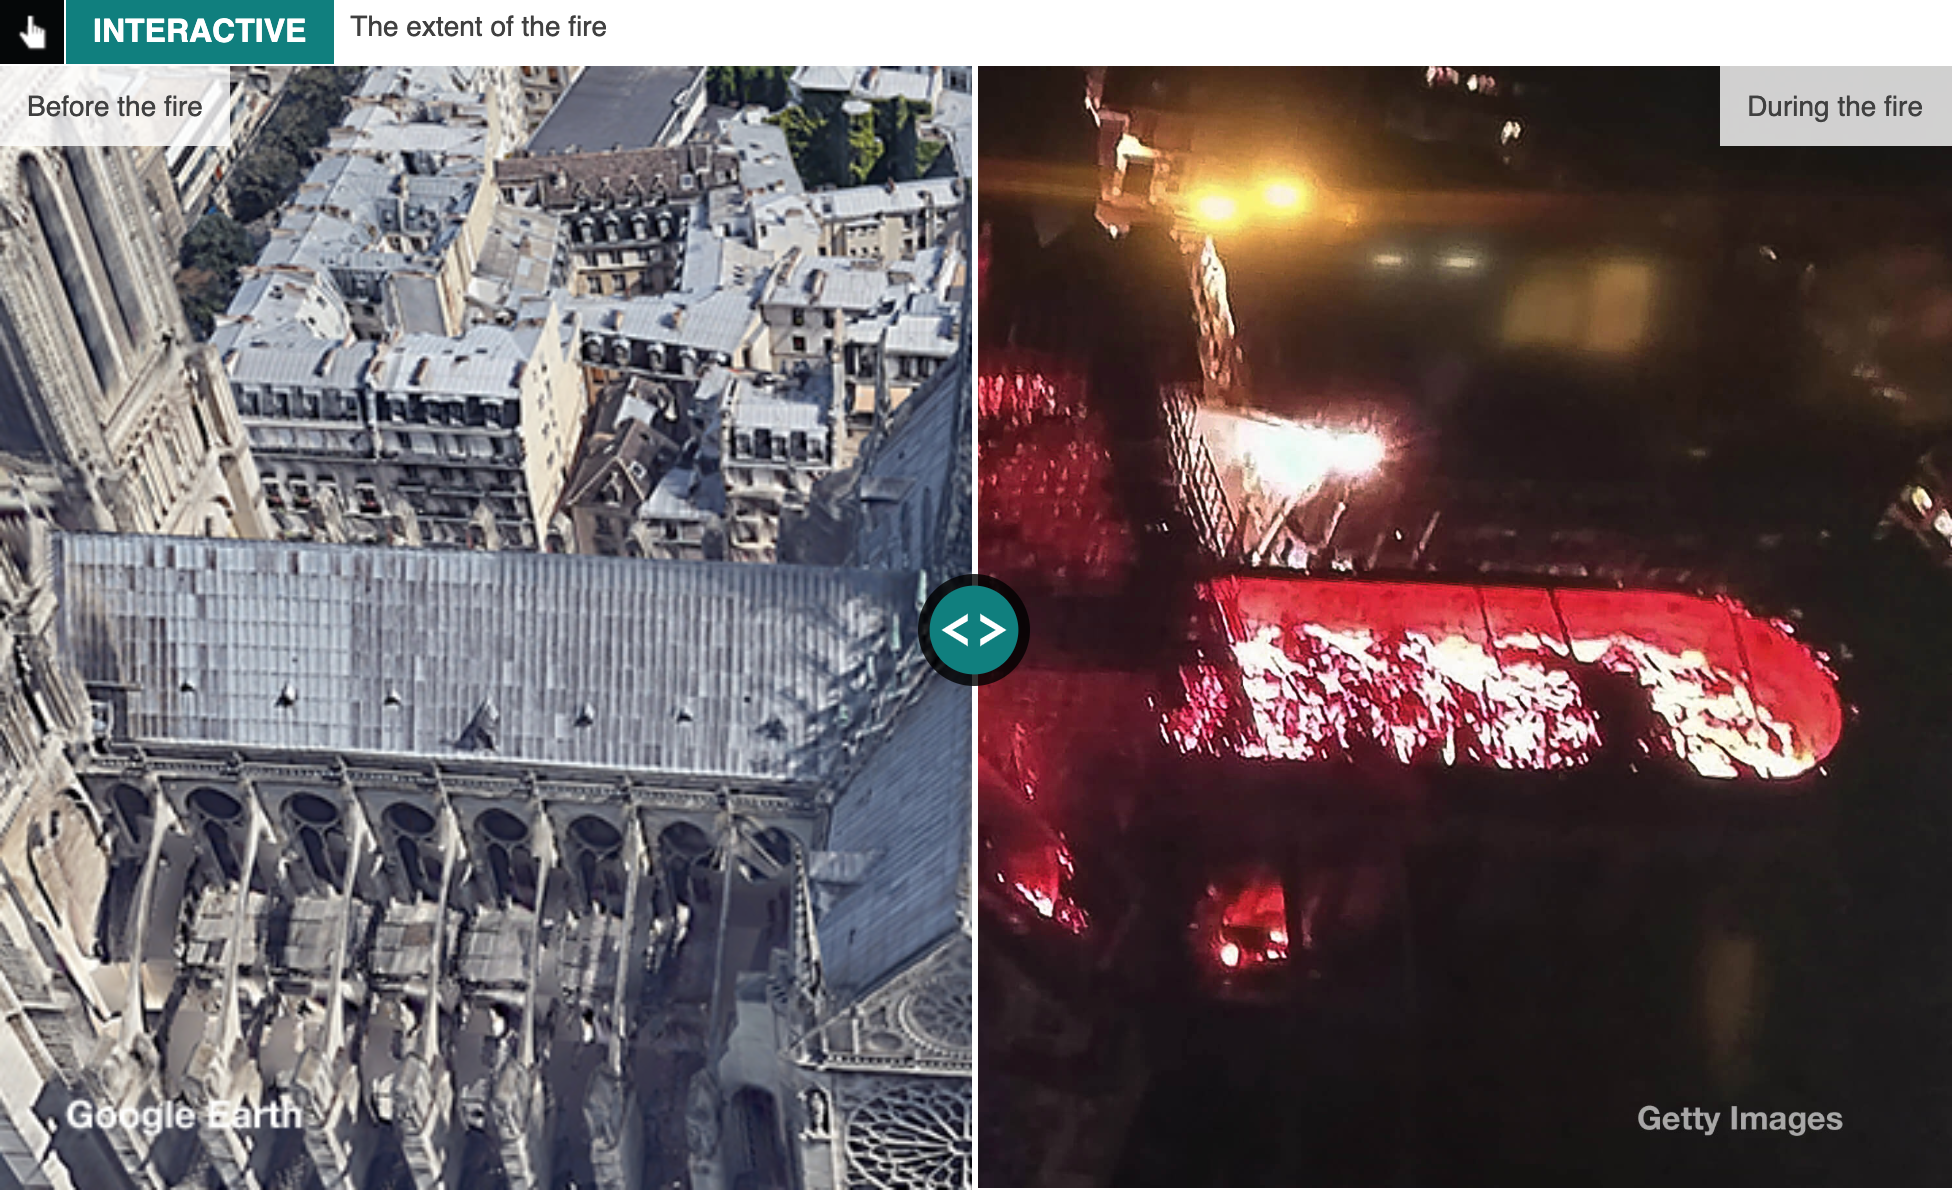
Yesterday I mentioned how there were few graphics detailing the fire at Notre Dame de Paris. Just give media organisations a day. The BBC published this piece about the fire. It includes, much like the Times piece from yesterday, an illustrative diagram detailing the key locations of the fire.

But the BBC piece goes a bit further and includes photo sliders like this.

The roof is on fire
The roof is on fire

It shows the extent of the fire burning away at the roof. (Amazingly, the stone vaulted ceiling below the roof contained most of the fire as the ground floor is nearly intact.)

Another slider looks at the appearance of the cathedral while photographs are annotated to provide immediate context of what the reader is seeing.

Overall, it is a very strong piece.

Credit for the piece goes to the BBC graphics department.
Black Holes and Revelations

On Sunday night I went to see the English rock band Muse perform here in Philadelphia. The concert was to support their latest album, but of course they played Starlight, a song which gave us its respective album’s title: Black Holes and Revelations.

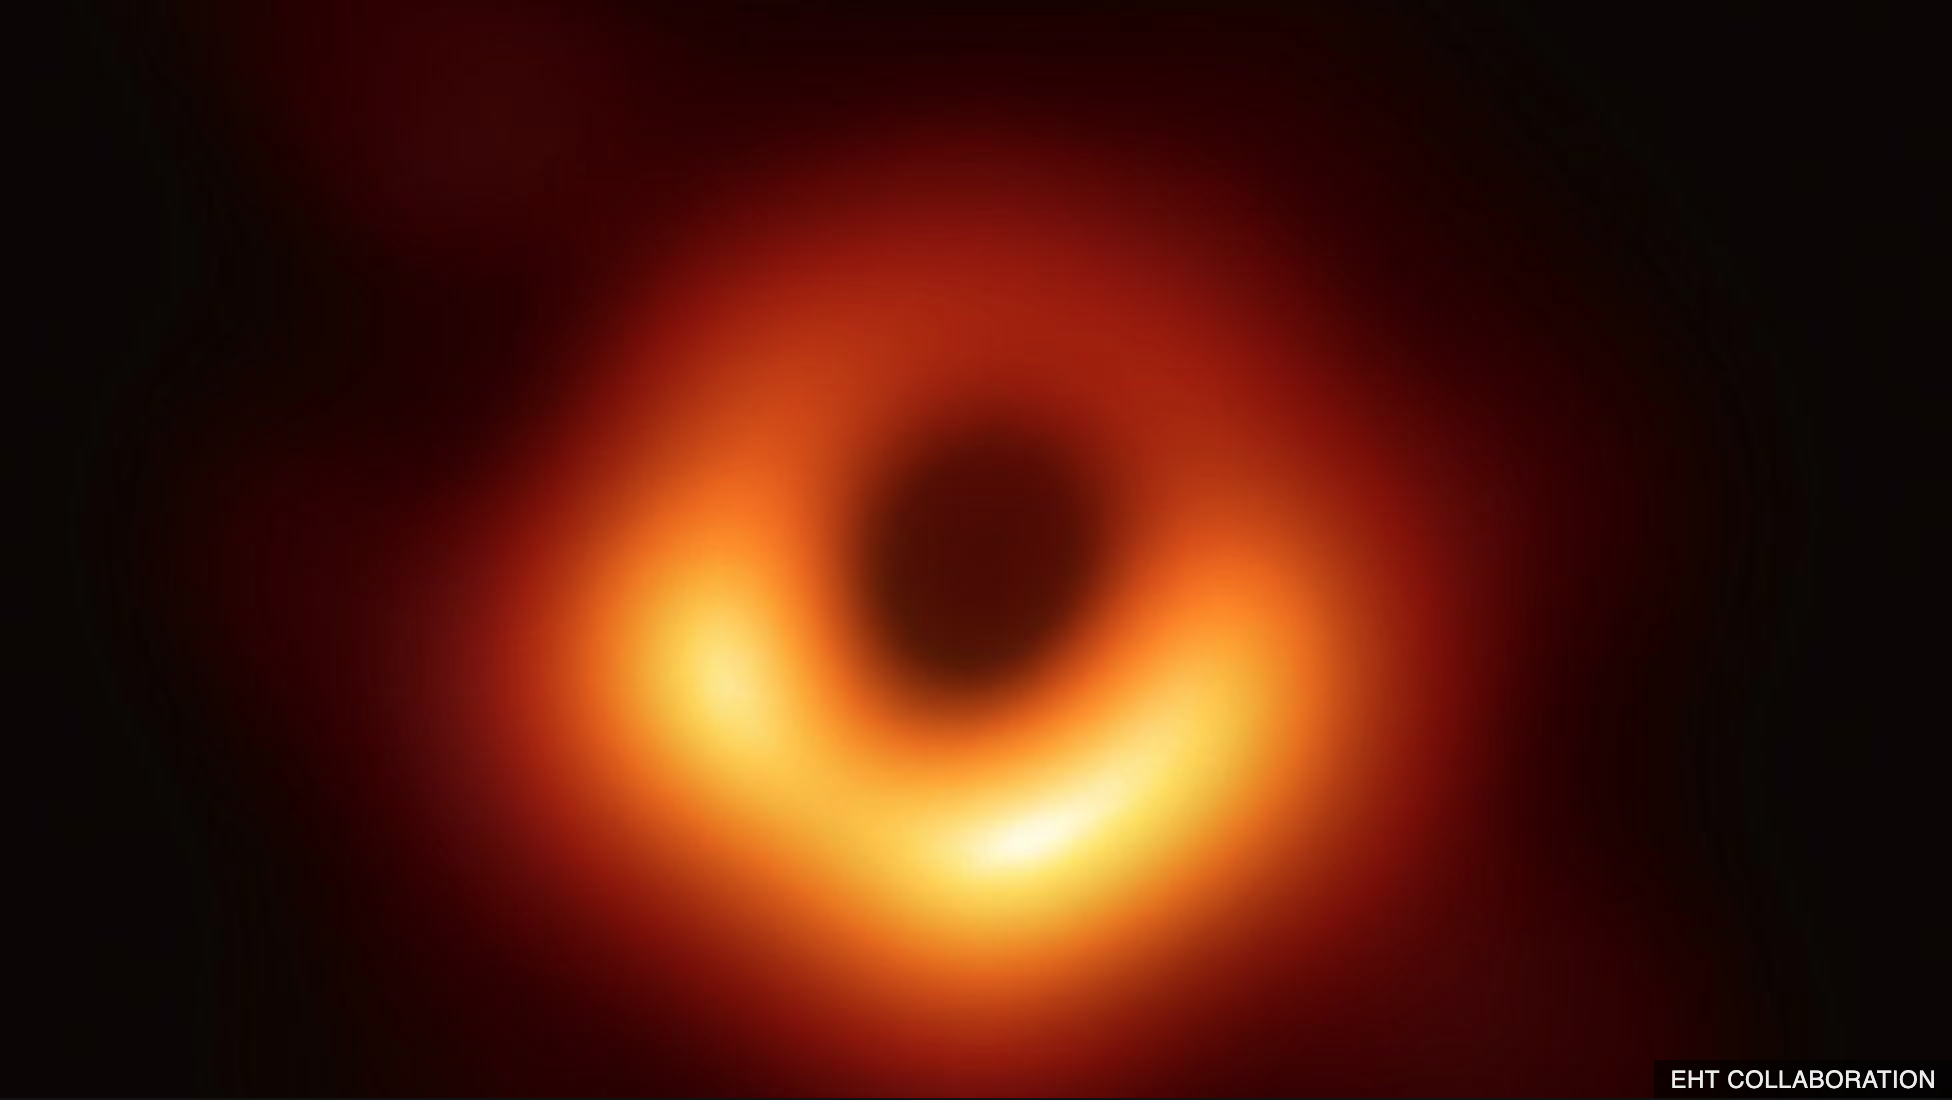
Then on Wednesday, scientists announced that for the very first time, we have actually been able to take a photograph of a blackhole. This one is a supermassive black hole at the heart of the M87 galaxy, some 500 million trillion kilometres distant.

Hopes and expectations?

The bright light, or ring of fire, is the heated gas before falling beneath the event horizon, which here is the black disk. Beyond that point, the gravitational force is so strong that not even light can escape. And of course without light escaping to be seen, a black hole cannot be directly imaged. Instead, we have to look for its accretion disc.

It’s just cool.

Credit for the piece goes to the Event Horizon Telescope Collaboration.

The Stunted Growth of North Korea

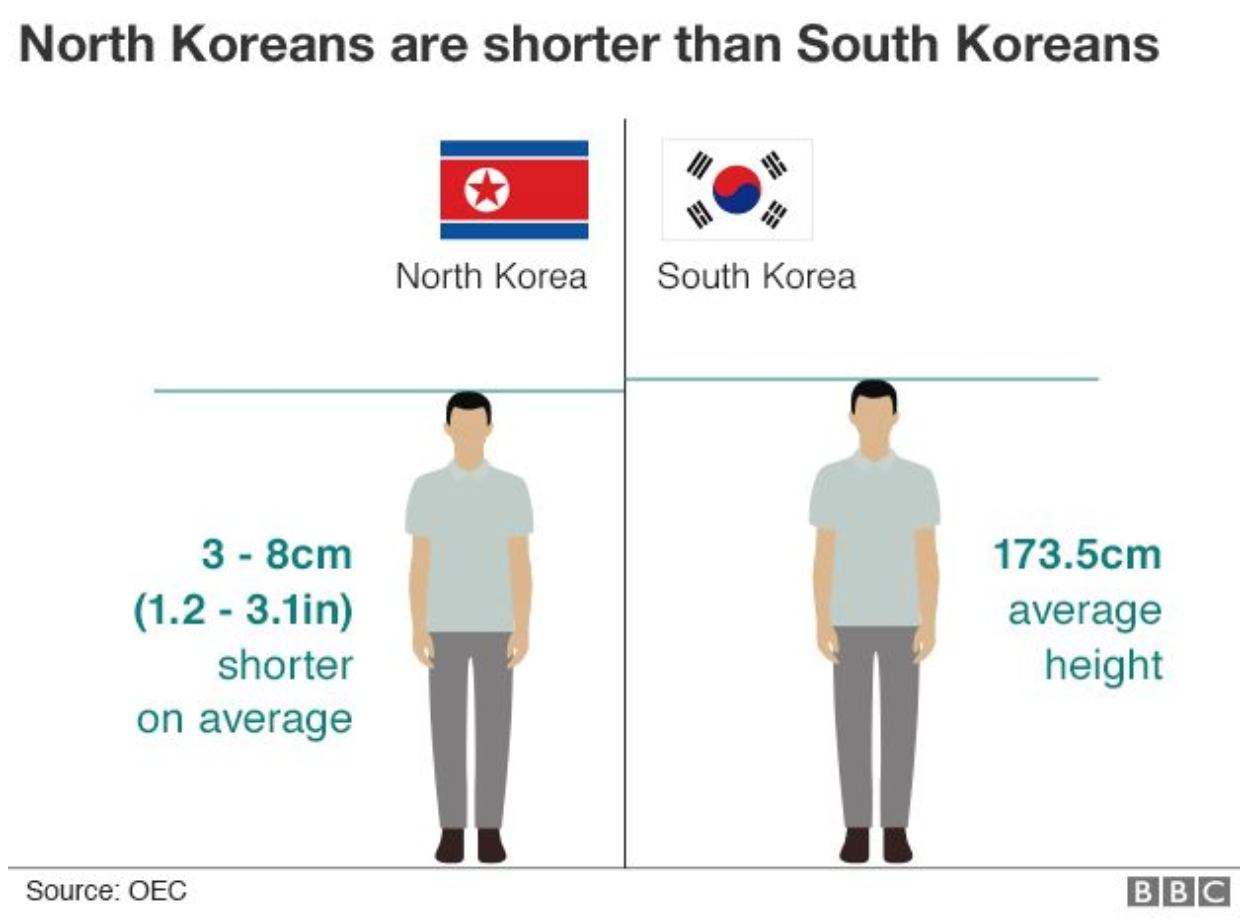
This piece from the BBC is a few years old, but it provides some interesting nuggets about North Korea. Unsurprisingly it appeared on my radar because of the coverage of the Trump–Kim summit in Vietnam. The article says it is nine charts that tell you all you need to know about North Korea. Now, I do not think that is quite true, but it does contain the following graphic—I hesitate to call it a chart—that illustrates one of my favourite details.

It's just a matter of inches
It’s just a matter of inches

The two figures illustrate the average height of a person from North Korea and then South Korea. What do you see? That the North Korean is shorter. This is despite the fact that the populations were the same just a few decades ago. The impact of years of malnutrition, undernourishment, and general lack of well-being have manifested themselves in the physical reduction of size of human beings compared to their nearly identical population to the south.

Thankfully the rest of the piece contains data on things like GDP, birth rates, and life expectancy. So there are some things in there that one should know about North Korea. As much as I find the story of height interesting, I struggle to think it is one of the nine things you should really know about the state.

Credit for the piece goes to Mark Bryson, Gerry Fletcher, and Prina Shah.

Cold, Dangerous Cold

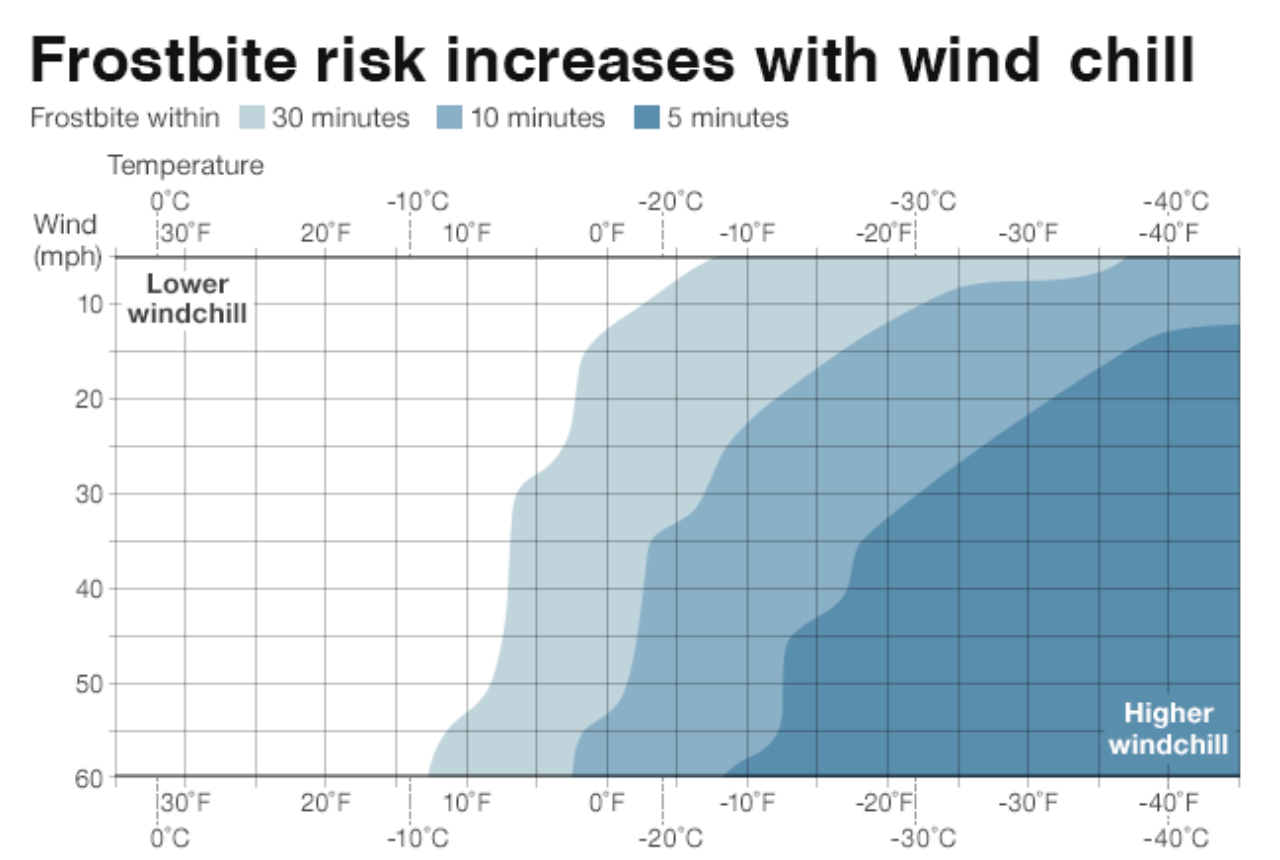
It’s cold out in Chicago. And not just the usual winter cold, but record-setting cold. And when the temperature gets that low, when you mix in a little bit of wind, it can become dangerous very quickly. In an article about the weather conditions in the Midwest, the BBC included this graphic at the end.

You don't want to be in the lower right
You don’t want to be in the lower right

Even the slightest bit of wind decreases the time one has before frostbite sets in. So wrap up and stay warm, everyone.

Credit for the piece goes to the BBC graphics department.
The Changing Shape of Anak Krakatau

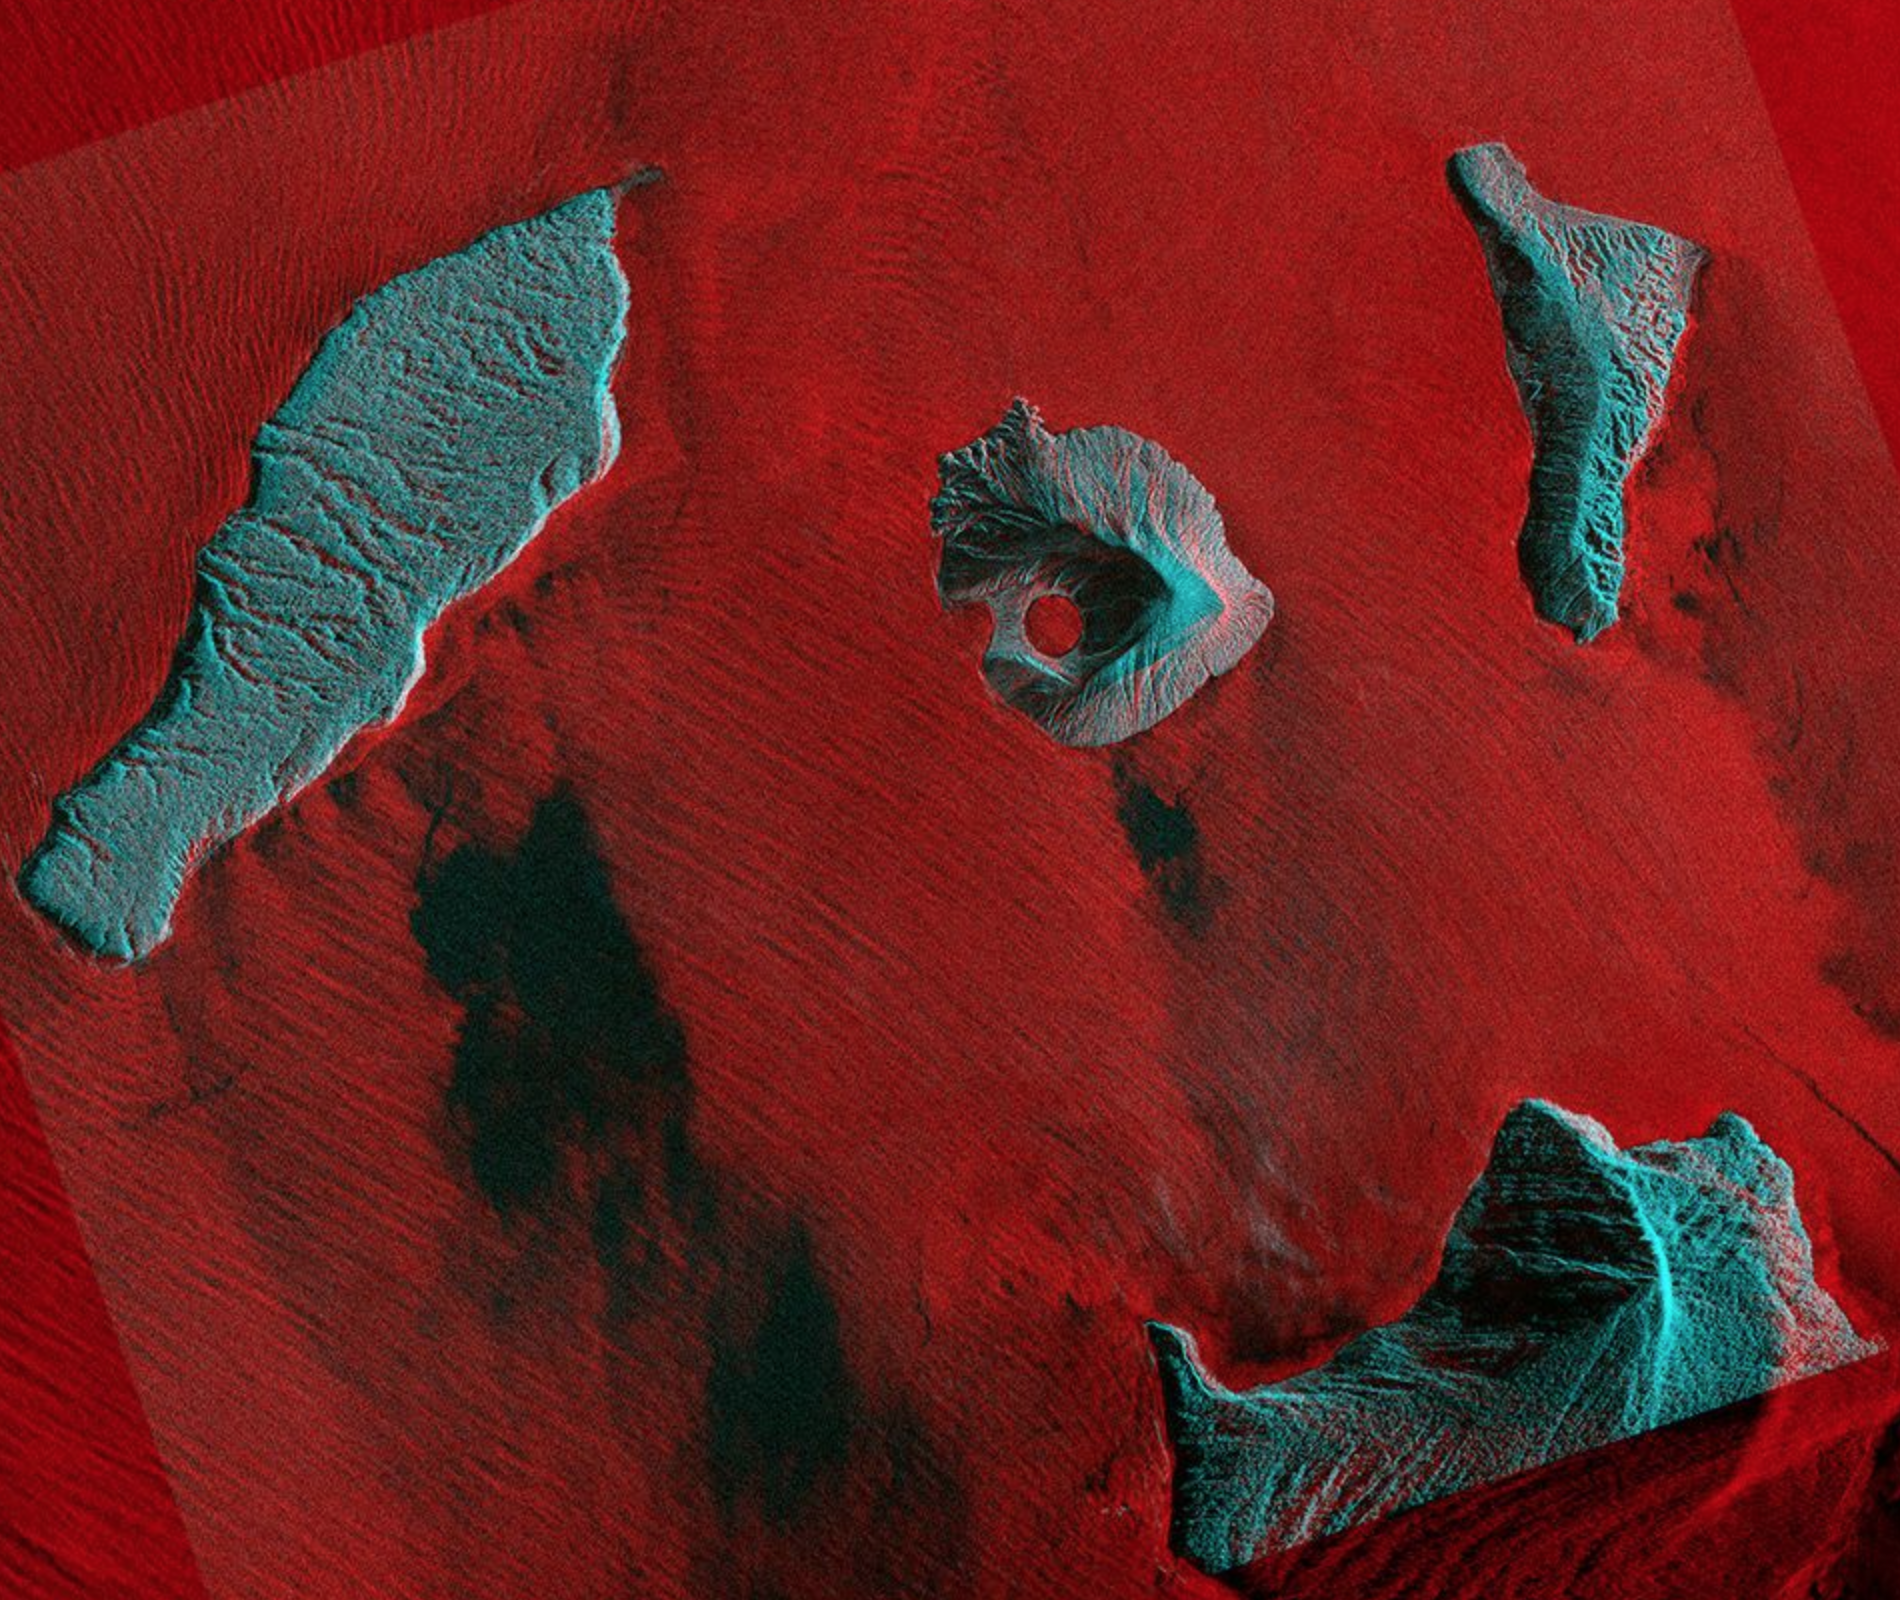
A few weeks ago we took a look at an interactive piece from the BBC that used a slider to show before and after photos of Anak Krakatau. For those that forget, that was the volcano that exploded and created a tsunami in Indonesia, which killed over 400 people. Well, geography is always changing and so has the shape of the volcano.

The BBC published a piece about two weeks ago that looked at new details from a Finnish radar satellite. These show how the crater of the volcano has been cut off from the ocean and is now a little lake.

Maybe not the most ideal lounging lagoon

This piece is not really revolutionary in its design. But it does provide a nice follow-up on a story that piqued my interest.

Credit for the piece goes to ICEYE.

The Brexit Deal Vote

Today’s (one of) the day(s). For those of you who haven’t followed Brexit, the British Parliament will vote this evening on whether to accept the deal Prime Minister Theresa May negotiated with the European Union…or not. And if not, well, the government now only has three—instead of the original 21—days to figure out a Plan B.

Of course this vote is only happening today because the government punted back in December when it was clear they were going to suffer a substantial loss. And back then, the BBC prepared this article about Brexit, where it was and where it was going. Funny thing is, after a month, not much has changed.

The screenshot below is of the process. As I noted above, the most critical change is that the government no longer has 21 business days to figure out what’s next. So instead of, to use the American football phrase, running out the clock, May will have to come up with something and present it to Parliament before 29 March, the day the UK leaves by statute.

How neat and orderly it must all seem…

I think the thing missing from the graphic is the chaos that happens if the deal is rejected. And while that may have been far from clearly the most obvious result two and a half years ago, it is now. And Parliament is scheduled to start voting around 19.00 GMT, or 14.00 EST for those of us on the East Coast or 13.00 CST for those of you in the Midwest.

Credit for the piece goes to the BBC graphics department.
Anak Krakatau

During my winter holiday to London the volcano Anak Krakatau erupted, sending enormous amounts of material sliding into the ocean. The displaced water had to go somewhere and travelled as a tsunami that devastated the Indonesian coastline.

Of course Anak Krakatau is one of several remnants of the much larger volcano of Krakatoa that erupted several times, perhaps most famously in 1883. Anak Krakatau specifically emerged in the late 1920s and has been building ever since until it collapsed almost two weeks ago. But by how much did it collapse?

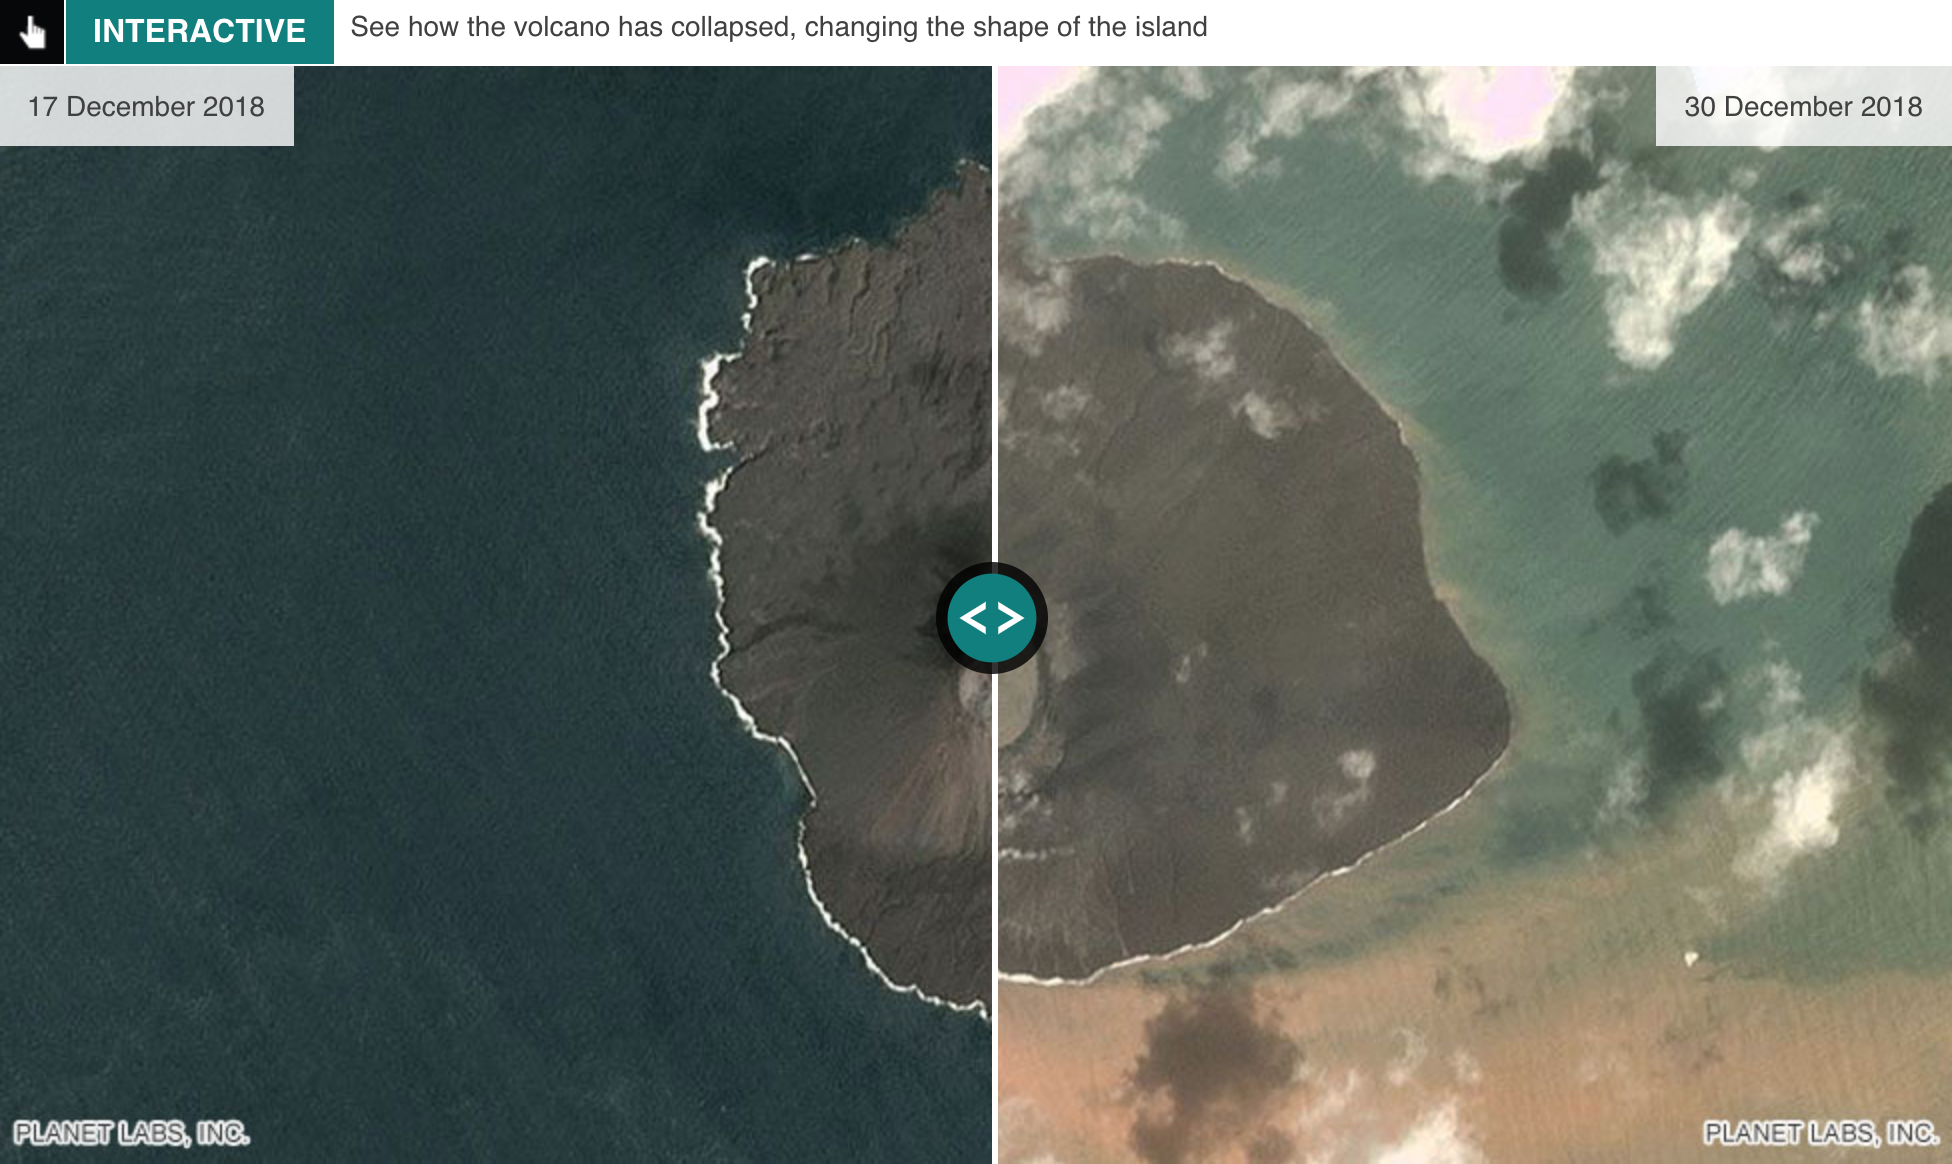
Until just a few days ago, the skies above the volcano have not permitted detailed photography. But within the last day or so we have started to get images and the BBC put together this piece that looks at Anak Krakatau before and after.

Before on the left, after on the right

It is a fairly common convention these days, the slider overtop the two images. But conceptually it shows clearly how the shape of the island has changed, in particular the new bay that has emerged. The other remarkable feature is the extension of land to the presumably east (right) of the image.

Credit for the piece goes to the BBC graphics department.
Millennials Are the Worst

Happy Friday, everybody. We made it to week’s end. But wouldn’t you know it? Millennials are still terrible. Admittedly this piece is over a year old, but I could not remember ever seeing it before.

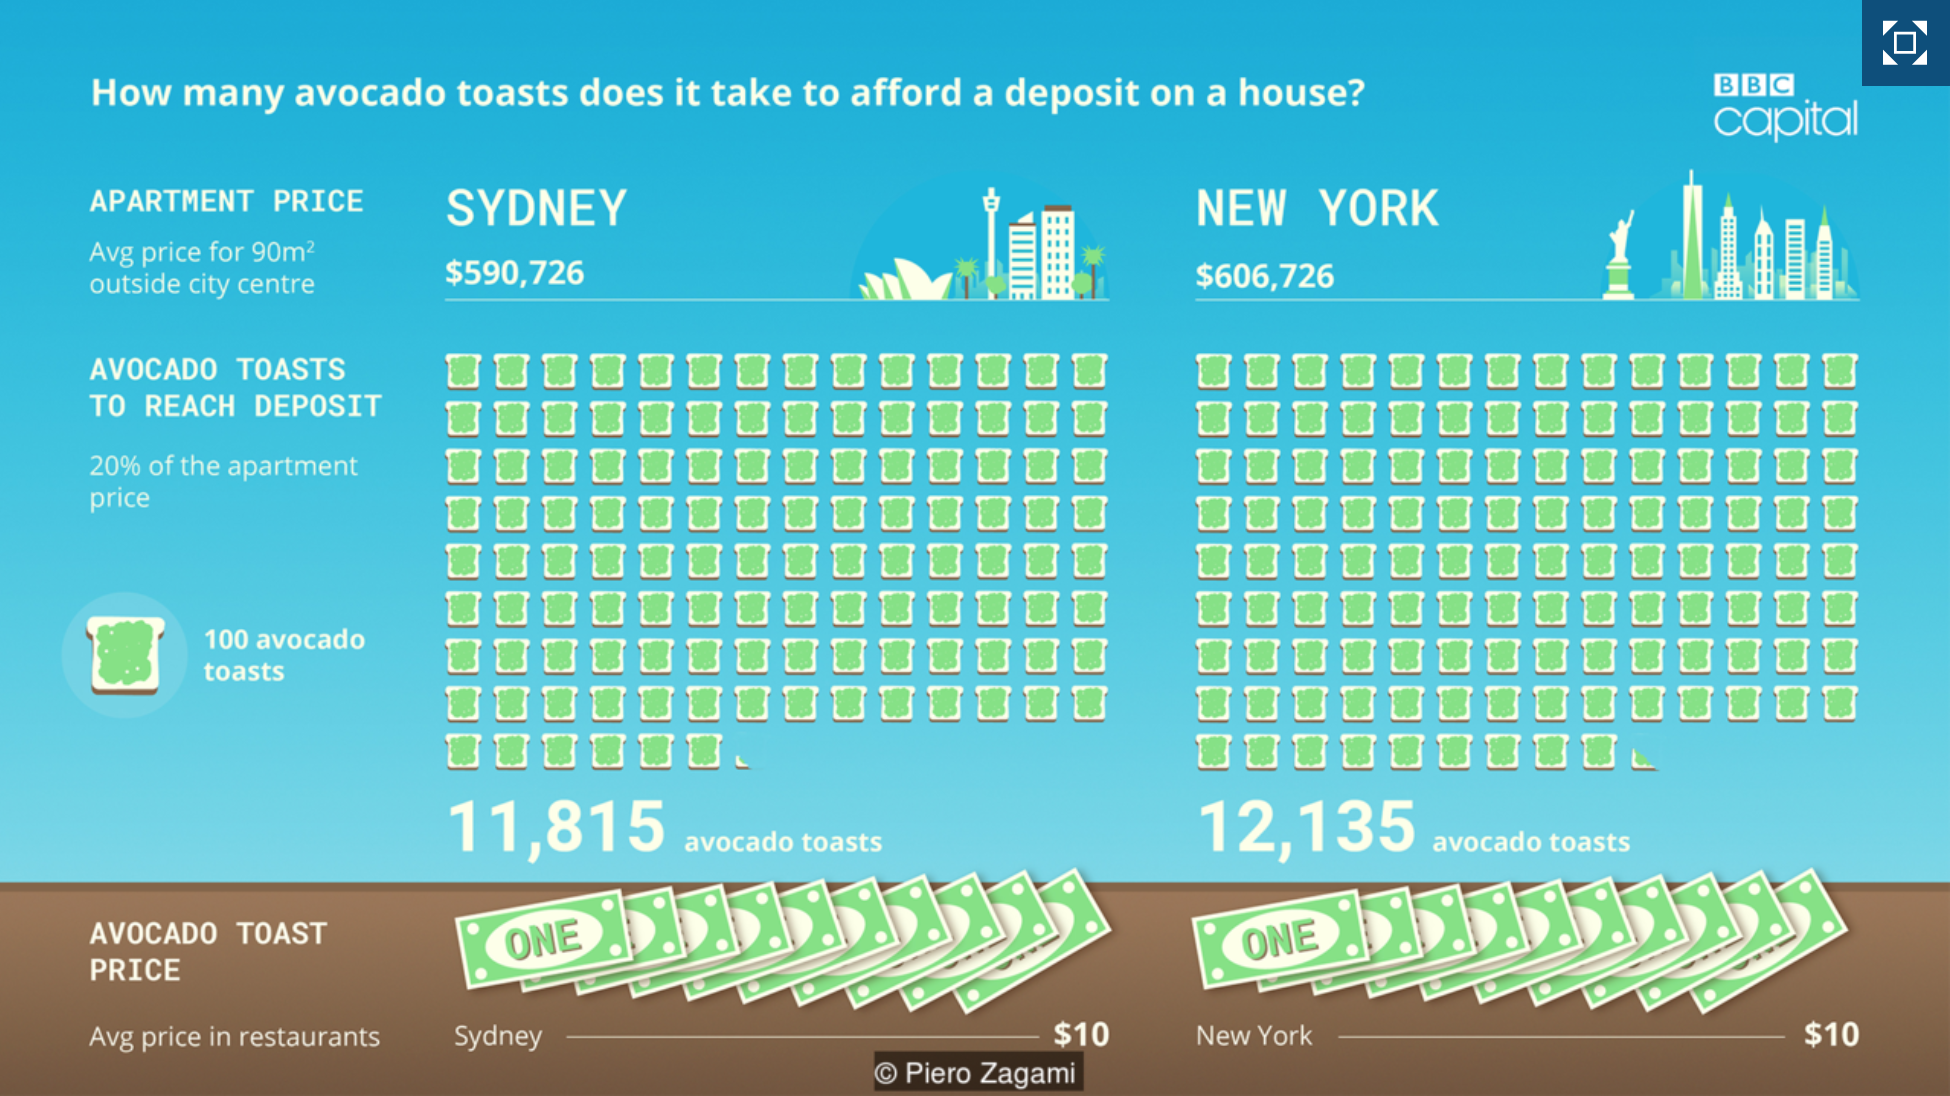
If you do not recall, last year there was a debate about the spending habits of millennials and why they are not out there buying homes and properties. The point was that we waste our money on experiences like expensive coffees and, most specifically, avocado toast. So amidst all this, the BBC decided to look at how many pieces of avocado toast would be needed to purchase an apartment in 10 global cities. Neither Philadelphia nor Chicago were on that list, but New York is.

Note they even have local prices for avocado toast to make the index more accurate.

Ultimately, I have never had avocado toast. But it sounds pretty good. But I find it a stretch to think the reason I do not own a home is because I am trying to eat 12,135 slices of avocado toast.

Credit for the piece goes to Piero Zagami.